All published articles of this journal are available on ScienceDirect.

How Can a Steel Structure Survive to Impact Loading?
Authors Info & Affiliations
Abstract
Recent events such as natural catastrophes or terrorism attacks have highlighted the necessity to ensure the structural integrity of buildings under exceptional events. For more than 10 years, the University of Liege is strongly involved in researches further investigating the response of structures to such exceptional events [1, 2]. The present paper gives a global overview on recent or on-going developments performed at the University of Liege in the field of robustness of steel building structures subjected to impact loading leading to the loss of a column. The conducted studies are founded on a combination of experimental, numerical and analytical approaches with the final aim to propose simplified procedures useful for practitioners and allowing ensuring an appropriate level of robustness to structures for the considered scenario.
INTRODUCTION
Recent events such as natural catastrophes or terrorism attacks have highlighted the necessity to ensure the structural integrity of buildings under an exceptional event. According to Eurocodes and some other national design codes, the structural integrity of civil engineering structures should be guaranteed through appropriate measures and one way to guarantee it is to ensure an appropriate robustness of the structure, which may be defined as the ability of a structure to remain globally stable in case of exceptional event leading to local damages. However, although global design approaches such as the activation of alternative load paths or the key element method are provided in modern codes and standards, no easy-to-apply practical guidelines are provided. The present paper reflects recent researches realised at the University of Liege with the objective of proposing such practical guidelines for the activation of alternative load paths in the structure, knowing that this design strategy generally leads to the most economical solutions.
The behaviour of steel (and composite) structures under the exceptional event “loss of a column” has been recently investigated through many researches (e.g. from [2-17] among others). At the University of Liege, this topic is under investigation since many years using experimental, numerical and analytical approaches [2-8]. The adopted general philosophy in Liege is to observe the redistribution of the loads in damaged structures through the activation of alternative load paths and to develop analytical methods to predict this redistribution of loads. Knowing how the loads are redistributed, it is possible to estimate whether or not the remaining elements are able to sustain the additional loads coming from this redistribution, without causing a progressive collapse of the entire frame and to predict the request in terms of ductility/deformation capacity for the structural elements, i.e. the structural requirements. The final aim is, on the basis of the acquired knowledge, to produce easy-to-apply design recommendations/guidelines for practitioners that ensure an appropriate behaviour of the structure in case of exceptional events.
The present paper summarises researches conducted in the framework of recent [18, 19] or on-going European and National research projects and of PhD theses.
In a first section, the paper summarises the performed developments aiming at further investigating the quasi-static response of a structure to a column loss. In particular, an analytical model developed at the University of Liege is briefly presented and then, an easy-to-use and efficient numerical tool also developed at the University of Liege is described and validated.
In a second section, it is demonstrated how the dynamic effects which could be associated to a column loss further to an impact can be predicted on the basis of the knowledge of the quasi-static response using a simplified analytical approach.
QUASI-STATIC RESPONSE OF STRUCTURES
Study of 2D Frames
When a frame suffers from a column loss, two parts can be identified in the structure: the directly affected part and the indirectly affected (Fig. 1). The directly affected part contains all the beams, columns and beam-to-column joints located above the lost column. The rest of the structure (i.e. the lateral parts and the storeys under the lost column) is defined as the indirectly affected part.
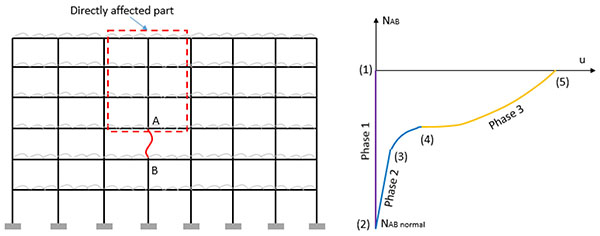
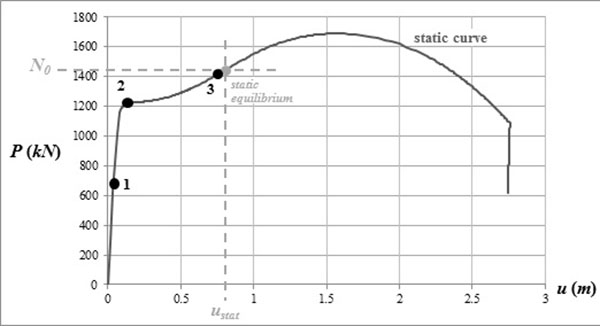
For a frame losing one of its columns (column AB in Fig. (1), the evolution of the compression force NAB in the lost member vs. the vertical displacement (u) at the top of this column can be divided in 3 phases as illustrated in Fig. (1).
During Phase 1 (from (1) to (2) in Fig. (1), the column is “normally” loaded (i.e. the column supports the loads coming from the upper storeys) and the compression load in the column before its disappearance is defined as equal to NAB normal.
Phase 2 (from (2) to (4) in Fig. (1) begins when the column loss is initiated. During Phase 2, a plastic mechanism develops in the directly affected part. Each change of slope in the curve of Fig. (1) corresponds to the development of a new hinge in the directly affected part, until reaching a complete plastic mechanism (point (4) on Fig. (1).
Phase 3 (from (4) to (5) in Fig. (1) starts when this plastic mechanism is formed: the vertical displacement at the top of the column increases significantly since there is no more first order rigidity in the structure. Due to these large displacements, catenary actions are developing in the beams of the directly affected part, giving a second-order stiffness to the structure. The role of the indirectly affected part during phase 3 is to provide a lateral anchorage to these catenary actions: the stiffer the indirectly affected part is, the more catenary action will develop in the directly affected part. In the extreme situation where the indirectly affected part has no lateral stiffness, then catenary action will not develop and there will have no Phase 3.
If the displacement associated to point (5) can be predicted, it is then possible to estimate what are the required deformation capacities of the structural elements and the associated redistribution of forces within the frame; accordingly, it is possible to check if the structure is sufficiently robust to reach this new state of equilibrium.
The prediction of the response of the frame during Phase 1 and Phase 2 can be obtained easily while the prediction the response during Phase 3 is much more complicated as significant deformations and displacements inducing second order effects are observed during this phase. Accordingly, the research conducted in Liege has mainly been dedicated to this phase.
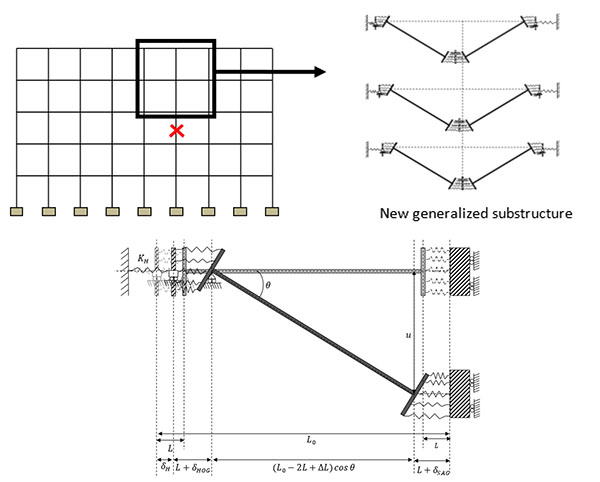
In particular, a fully analytical model has been developed to predict the response of a steel or composite frame during Phase 3 [3]. The proposed analytical model is founded on the definition of a substructure able to reflect the behaviour of the global frame (Fig. 2) and allows easily predicting the response of a 2D frame further to a column loss using the following assumptions:
- A static column loss is assumed;
- The hinges can develop in the beam cross-section or in the beam-to-column joints;
- Columns and beams are the same in all the frame;
- Column bases are assumed to be perfectly fixed;
- Only the loss of internal columns (i.e. columns which are not at the corners) is considered;
- No yielding develops in the indirectly affected part (i.e. its behaviour is assumed to be infinitely elastic).
The analytical model allowing predicting the response of the so-defined substructure is detailed in [3].
In this model, one of the main parameters affecting the response of the substructure is the behaviour of the yielded zone which appears first under bending moment and then it is submitted to bending moment and axial load while the catenary action is developing. These yielded zones are simulated by a multi-layer spring model as illustrated in Fig. (2) with elastic-perfectly plastic behaviour laws assigned to each spring.
The use of this multi-layer spring model allows considering situations for which the yielded zone is developed in beam cross-sections or at the level of beam-to-column joints.
Indeed, in case of a yielded zone developing in a cross-section, each spring represents a part of the cross-section: the resistance of the spring is obtained by multiplying the area Ai of the part of the cross section represented by this spring by the yield strength of the steel material (fy) of the considered cross-section while its stiffness is estimated as equal to EAi/L in which E is the young modulus of the steel material (= 210 000 MPa) and L is the length of the yielded zone defined according to Chen et al. [20].
In case of a yielded zone developing in a beam-to-column joint, each spring represents a bolt row as defined in Cerfontaine et al. [21] and its resistance and its stiffness are defined using the component method [21, 22] which is the design method recommended in the Eurocodes for the characterisation of joints.
Also, the effect of the indirectly affected part on the response of the directly affected part during Phase 3 is simulated through the definition of horizontal springs each side of each story characterised by a stiffness KH (as the behaviour of the indirectly affected part is assumed to be fully elastic, only stiffness is required for its characterisation). The method to predict this stiffness at each storey is presented [3, 7].
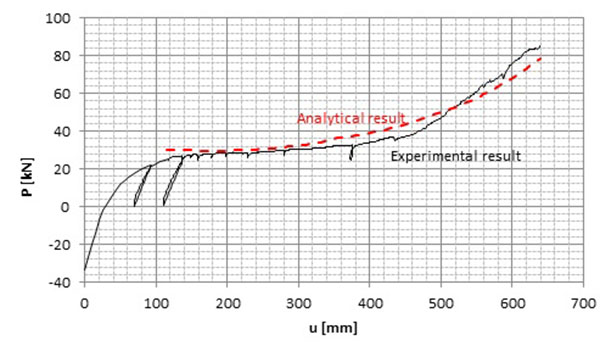
The proposed analytical model consists in solving a system of N equations with N unknowns as defined in [3]; this system of equations is easily solvable through the use of a mathematic software. In Liege, a MathLab sheet has been developed [23]. The developed procedure has been validated through comparisons (i) to numerical FEM results obtained performing full geometrical and material non-linear analyses on frames subjected to a column loss (using the homemade FEM software FINELg validated in Demonceau et al. [6]) and (ii) to experimental results from a substructure test performed at the University of Liege [5, 6]. The comparison analytical prediction vs. experimental result is given in Fig. (3) as an example; as a conclusion of the above mentioned comparisons, it can be said that a very good accuracy of the analytical model is observed.
Study of 3D Structures
Having an accurate analytical model to predict the response of 2D frame further to a column loss, it has been studied [24] how this model could be extended to 3D structures made of linear members (i.e. without accounting for the effect of the concrete slab).
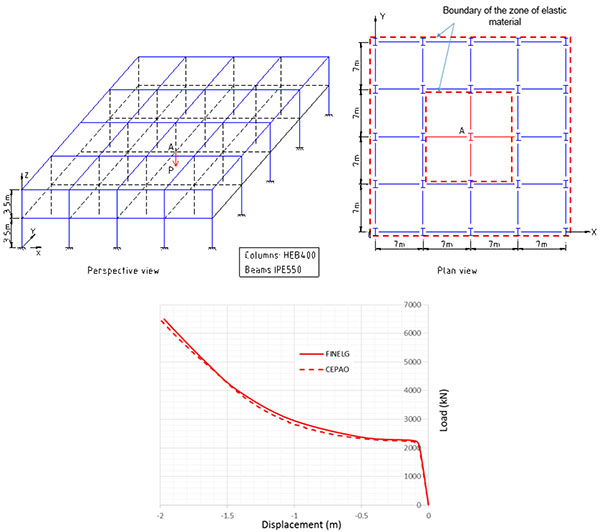
In this work, a reference 3D steel structure (Fig. 4) has been designed respecting the recommendations from the Eurocodes. This steel building is made of 2 storeys and 4 bays in each direction (Fig. 4). The beams are made of IPE550 S355 profiles while the columns are made of HE400B S355 ones; these profiles have been selected in order (i) to respect the ultimate and serviceability limit states as defined in the Eurocodes and (ii) to ensure the development of significant membrane forces when simulating the column loss in the structure. In addition to the self-weight, a permanent load of 3 kN/m2 and a live load of 2 kN/m2 have been assumed as applied to the structure.
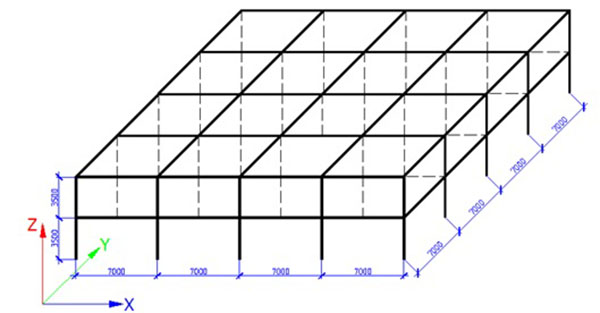
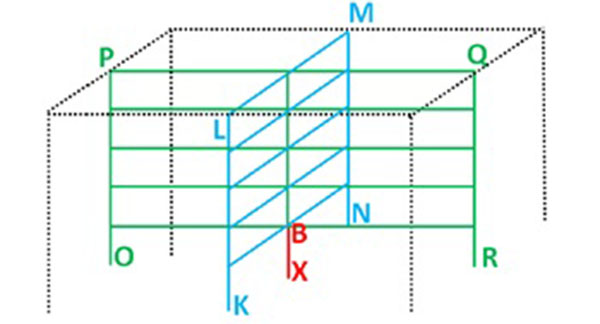
The exceptional scenario which has been considered is the loss of the column at the ground floor and at the middle of the reference structure (Fig. 4). A full geometrical and material non-linear analysis has been first performed using the homemade FEM software FINELg. Then the proposed analytical model has been extended to predict the response of the 3D structure further to the loss of a column, respecting the assumptions mentioned in the previous section. The extension of the analytical model consists in considering the response of a 3D structure as the sum of the response of two 2D frames intersecting at the level of the loss column as illustrated in Fig. (5) and expressing the compatibility of displacement at the point of column loss.
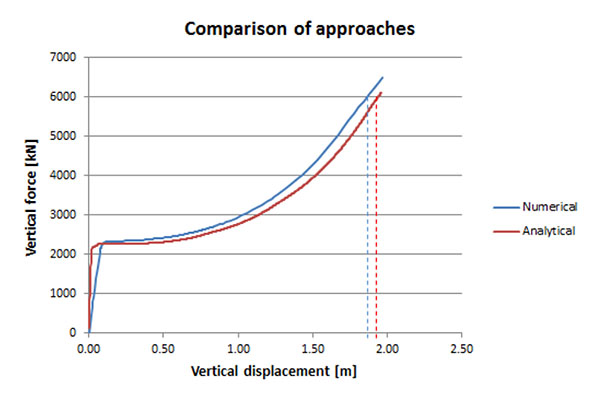
Through the comparison of the so-obtained numerical and analytical predictions (Fig. 6), it has been demonstrated that the so-extended analytical model allows predicting accurately the response of a 3D structure. Starting from the reference structure, a parametrical study has been conducted [24] varying the lateral restraints at different storeys (simulating the presence of bracing systems); through this parametrical study, the good accuracy of the proposed analytical model has also been confirmed.
The proposed analytical model has the advantage of allowing the mastering of all the parameters influencing the response of a 3D structure further to a column loss; however, the applicability of this model is conditioned by the respect of the previously mentioned assumptions which are quite restrictive.
Accordingly, to raise the limitation associated to these assumptions, it has been decided to extend an already existing homemade software named CEPAO on the basis of the knowledge gained from the development of the previously mentioned analytical model.
The CEPAO software is a unified package solving automatically the following problems for frame structures: elastic analysis, second-order elastic-plastic analysis, limit and shakedown analysis, limit and shakedown optimization.
In CEPAO, frame members are modelled by beam-column elements, taking into account different phenomena: P-δ effect, distributed plasticity, imperfections, stiffness degradation, etc. 3D plastic-hinges considering two bending moments and axial force are described by the normality rule for plasticity. The semi-rigid and partial resistance of beam-to-column joints could also be considered. The detail on the development of CEPAO can be found in Hoang and Nguyen [25-29].
The advantages of this software in comparison to more sophisticated FEM software is that the computation time is very limited in comparison to FEM software and the time required for the structure modelling is very limited due to the fact that it is not required to discretized the structural elements through several finite elements as it is the case when using FEM software.
Within the presented study, the co-rotational approach has been adapted in CEPAO in order to capture very large displacement states of structure, what is required when investigating the robustness of structures. The validation is performed through some numerical examples for the “loss of a column” scenario, comparing the results predicted by CEPAO to the ones predicted through the FEM software FINELg. Such a comparison is illustrated in Fig. (7) which shows a very good agreement between the two numerical predictions (more details can be obtained in Hoang et al. [30].
With the so-validated easy-to-use and efficient CEPAO software, it is so possible to predict easily the quasi-static response of a frame further to a column loss. It will be demonstrated in the following section that the knowledge of this quasi-static response is required to be able to apply the developed dynamic analytical model predicting the maximum displacement of a structure with account for the dynamic effects.
DYNAMIC RESPONSE OF STRUCTURES
The dynamic response of building frames further to a column loss has been investigated at the University of Liege in the last few years [4, 31].
To understand the behaviour of such frames, a basic substructure was first extracted and deeply studied for sake of simplicity. Indeed, frames losing a column proved to show many similarities in behaviour with the chosen simple system [6]. This substructure is first defined in the following section. Its dynamic response is then briefly explained before presenting the developed simplified model for the prediction of its response.
The extrapolation of this model to global frames suffering the loss of an internal column is the core topic of this section and is so finally developed.
Investigation of a Substructure as a Preliminary Study
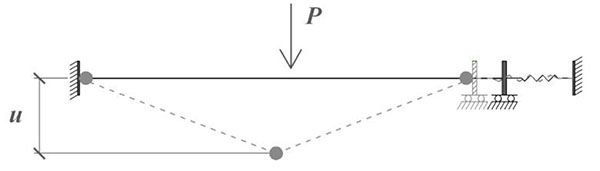
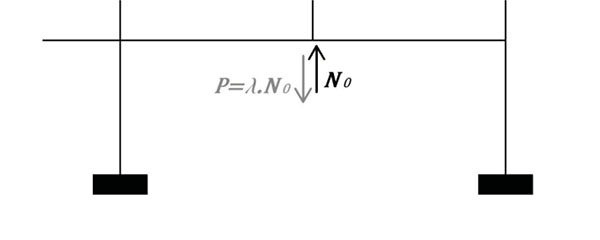
The dynamic behaviour of a basic system made of a double-beam subjected to a point load at mid-length and laterally restrained by a horizontal spring (Fig. 8) was first investigated. In this substructure, the lateral spring stands for the restraint provided by the indirectly affected part and the force P simulates the column loss (statically or dynamically applied).
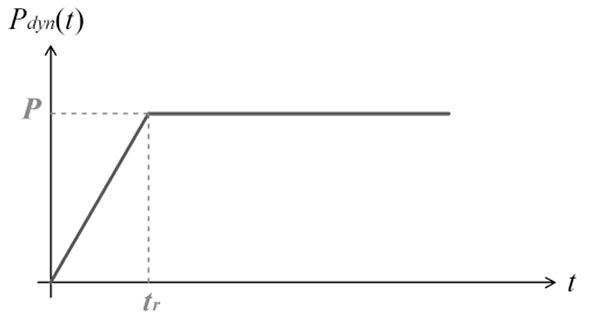
As far as dynamic loadings are concerned, the applied force Pdyn(t) is considered to linearly increase during a rise time tr and then to remain constant at a maximum value equal to P (Fig. 9). If values of P higher than Ppl are considered (Ppl being the value of the static force causing the formation of the beam plastic mechanism), two main response types can be observed depending on the loading conditions defined by P and tr. These two behaviour types can be explained comparing the dynamic curve ud(t) expressing the time evolution of the displacement induced by the application of Pdyn(t) to the static curve us(t) providing at each particular time t* the static displacement ustat(P*) associated to the value of the force P*=Pdyn(t*) (Figs. 10 and 11).
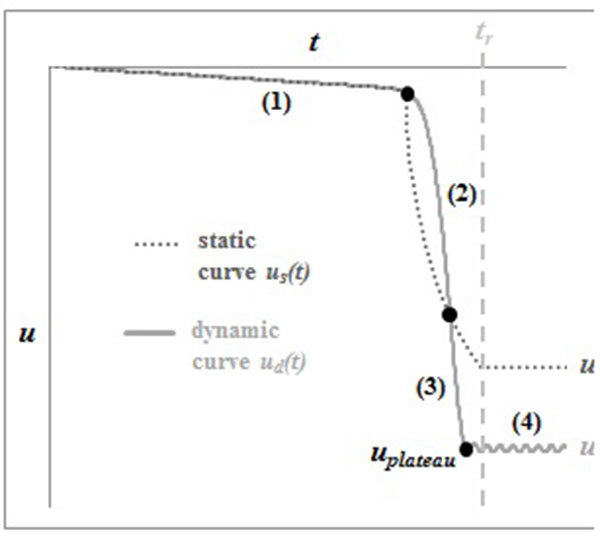
A response of type 1 can be divided in 4 steps (Fig. 10). During the first one, before the plastic mechanism is formed, the dynamic curve follows the static one. When the plastic mechanism forms, the dynamic displacement remains at first smaller than the static displacement, due to the system inertia. This is step 2, during which the system accelerates until the dynamic curve reaches the static one. The system enters step 3 when the dynamic displacement exceeds the static one and then the system decelerates until its velocity is reduced to zero: this is the end of step 3. This point is the first maximum of the dynamic curve and the corresponding displacement is called uplateau. Indeed, the last part of the dynamic curve is a horizontal plateau. The maximum dynamic displacement ud,max is equal to uplateau and higher than the static displacement ustat that would have been reached if P had been statically applied (tr → ∞).
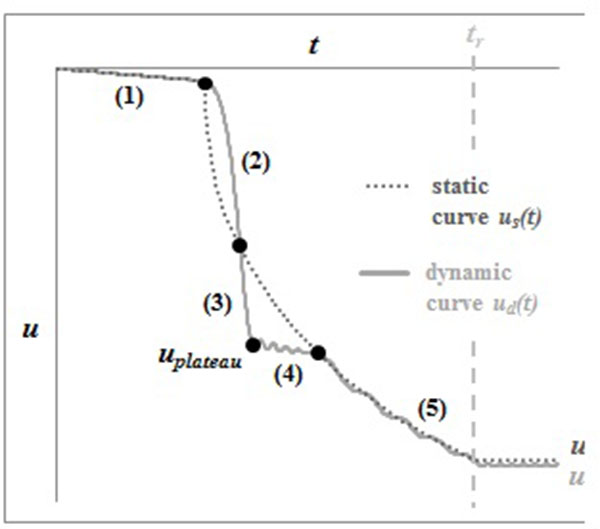
A response of type 2 can be divided in 5 steps (Fig. 11). The three first steps, until uplateau is reached, are exactly the same as for type 1. The fourth step is also very similar to what happens for a type 1 response: the dynamic curve shows a horizontal plateau. The difference is that in the present case, uplateau is smaller than ustat and the horizontal plateau is then limited by the static curve, while it was infinite in case of a type 1 behaviour. There is thus a last step during which the dynamic curve oscillates around the static curve. At the end, the maximum dynamic displacement is close to ustat.
The dynamic response of a frame losing a column is very similar to the substructure behaviour described above. In particular, the same two response types are also observed.
A simplified model was developed for the prediction of the substructure dynamic response [4]. This model is based on energy considerations and consists in writing that the work done by the external load is equal to the sum of the kinetic energy and the deformation energy. For this simple system, the deformation energy could be expressed as a function of the vertical displacement at mid-length, considering the work related to the plastic hinges rotation and the lateral spring elongation. The plastic interaction between the bending moment and the tension force in the plastic hinges had to be taken into account as well as the elongation of the beams. A differential equation governing the substructure response (time evolution of the displacement u(t)) was eventually obtained.
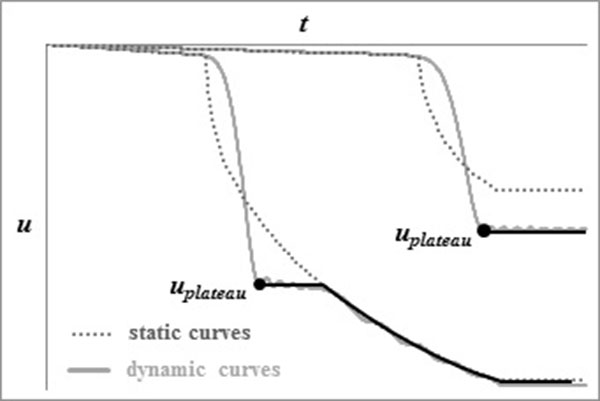
As this equation was derived considering the deformation energy corresponding to the first loading of the system and thus neglecting possible unloading, it is obviously only valid before unloading. In other words, the dynamic curve u(t) obtained from the resolution of this movement equation is only valid before its first maximum, which means this model permits the prediction of the first part of the behaviour, until uplateau is reached. After this point, the rest of the curve can be determined based on the observations mentioned previously: it consists in an infinite horizontal plateau if uplateau > ustat and in a horizontal plateau followed by the end of the static curve if uplateau < ustat (Fig. 12).
This procedure combining the observations made on the dynamic curve shape and the model based on energy considerations permits the prediction of the entire dynamic curve corresponding to given loading conditions (P and tr), provided the static response is known. It was demonstrated to give very good results (Fig. 13). However, it is not detailed herein because the model which is developed in the following section is a generalisation of this procedure that is valid for this simple substructure as well as for whole frame structures suffering the loss of a column.
Model Predicting the Dynamic Response of Structures
This section presents a simplified procedure permitting the prediction of the dynamic response of a frame losing an internal column. Thanks to this model, no dynamic numerical analysis is required any more to assess the robustness of frame structures suffering a dynamic column loss. However, the structural response assuming a static behaviour has first to be determined before the proposed model can be used to derive the dynamic response, which justifies the importance of the investigations presented in the previous sections of this paper.
The hypotheses that have been made to develop the model are first presented before detailing the development of the model equation. This model is then used as part of a global procedure permitting the establishment of the dynamic displacement curve. The input data that are required to determine the structural dynamic response using the proposed method are clearly detailed in the following section. Finally, the way the robustness of a frame structure dynamically losing a column can be assessed based on the developed simplified procedure is explained.
Hypothesis
The presented model does not take account of strain rate effects, which means it assumes that the deformation rate is sufficiently low for the material behaviour law to remain the same under dynamic loading as it is in static, which looks to be a reasonable assumption in case of impact loading.
Besides, no damping is introduced in the system, which constitutes a conservative approach. Moreover, it has been shown that damping does not induce a significant decrease of the maximum dynamic displacement [32], which is the parameter the developed procedure aims at predicting.
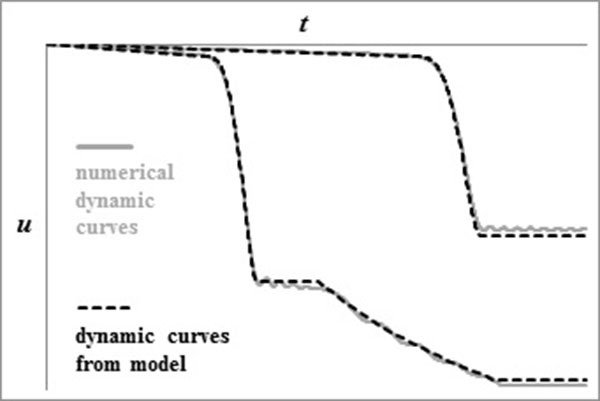
The presented model is also developed assuming that the deformation mode of the structure due to the column loss is the same if the column is statically or dynamically removed; and that the deformation energy corresponding to the reach of a given displacement u is equal in both cases. The comparison of the model predictions to results of numerical dynamic finite element analyses proved this assumption to be valid (Fig. 18).
The proposed model can be used for 3D structures as well as for 2D frames and is not dependant on the considered material or behaviour law, provided the static structural response is known. However, it has only been applied and validated for 2D steel frames so far.
Model Equation
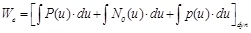
The model is based on the following energy equation (Eq. (1)), expressing that the work done by the external forces is equal to the sum of the kinetic energy and the deformation energy.
 |
(1) |
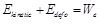
The kinetic energy is given by:
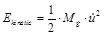 |
(2) |
where Mg is the generalised mass of the system (the procedure to obtain this generalised mass is detailed later on).
As far as the deformation energy is concerned, it basically includes the energy related to the plastic hinges rotation and the indirectly affected part deformation. To evaluate the energy dissipated in the plastic hinges, the M-N interaction should be considered. Besides, the deformation of the indirectly affected part can be fully elastic or elasto-plastic depending on the load level, and is rather complex to determine. This makes the global deformation energy very difficult to evaluate based on this approach.
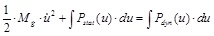
An assumption was thus made according to which the deformation energy corresponding to a given value of the displacement u is the same no matter if this displacement is reached statically or dynamically. Under this assumption, the deformation energy can be computed based on the static response only. Indeed, it is then equal to the work done by the external forces to statically reach the considered displacement:
 |
(3) |
where p represents the vertical loads applied to the structure in the initial situation, before the critical column begins to fail (for example, distributed loads on the beams); N0 is the load in the column to be lost (=NAB normal as defined in Fig. (1); P is the load simulating the column loss applied downward at the top of the lost column (varying from 0 to N0) - (Fig. 14).
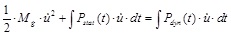
The work done by the external loads during the dynamic deformation of the system is:
 |
(4) |
The loads N0 and p remaining constant from the time zero and thus for any value of the displacement u, the work done by these forces for a given displacement is the same no matter if this displacement is reached statically or dynamically (under the assumption that the deformation mode of the structure is the same is both cases).
Finally, Eq. (1) can be written as follows:
 |
(5) |
or
 |
(6) |
Deriving according to time and dividing by
 , it comes:
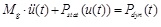 |
(7) |
This differential equation governs the movement of the system. However, an important remark has to be made concerning its domain of validity. If the system remains perfectly elastic, the deformation energy corresponding to a given value of the displacement is unique and can be computed as stated in Eq. (3). But if yielding has occurred, the deformation energy corresponding to the reach of a given value of the displacement is not the same if this displacement is reached for the first time or after unloading. Eq. (3) gives the deformation energy for the first loading. Consequently, Eq. (7) is valid:
- In the elastic range,
- Until the first maximum of the obtained curve u(t) after yielding has occurred.
Procedure to Establish the Dynamic Displacement Curve
To solve Eq. (7) governing the system movement, limit conditions have to be provided. To determine the first part of the dynamic curve, these conditions simply express that, at the time zero, the displacement of the system is the one corresponding to the initial position of the structure (before the column is removed) and its velocity is zero. It is then possible to obtain the time evolution of the displacement u(t). However, if yielding has developed in the structure, this curve is only valid until its first maximum.
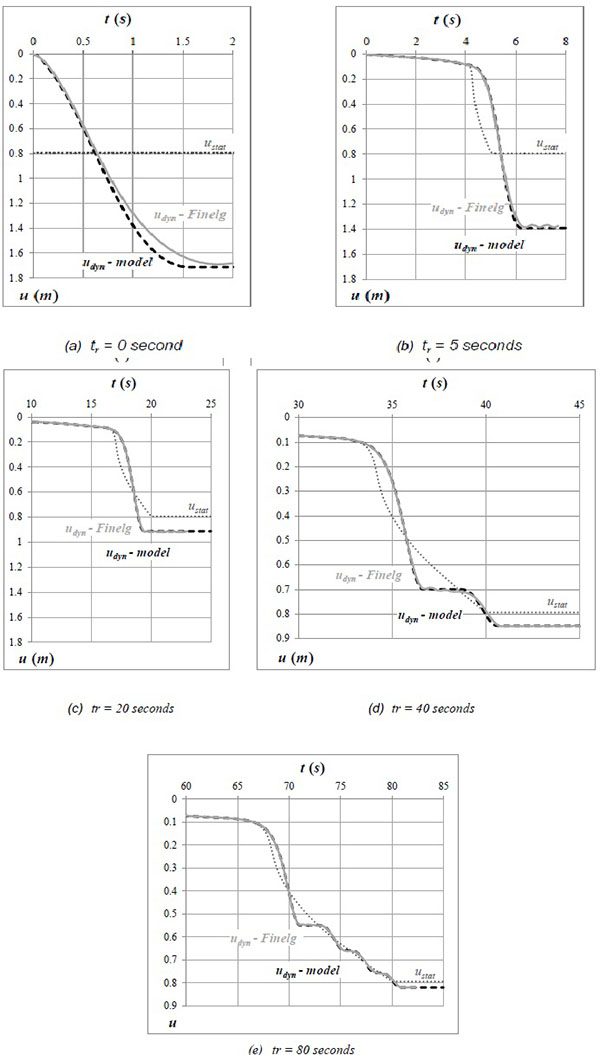
As explained previously, two different response types can be observed according to the value of this first maximum, called uplateau. If uplateau is higher than the static displacement, a response of type 1 is observed and the part of the curve after this first maximum simply consists in an infinite horizontal plateau Fig. (18a-c). The entire dynamic curve can thus be easily obtained. In this case, the maximum dynamic displacement is equal to uplateau.
If uplateau * ustat, a response of type 2 is observed. The horizontal plateau is then limited by the static curve and the last part of the dynamic curve consists in oscillations around the static curve (Fig. 18d, e). A rough approximation of the entire dynamic curve could then consist in the first part obtained by the resolution of Eq. (7) followed by a horizontal plateau and then the end of the static curve, as suggested in the section dedicated to the substructure model.
However, it has been observed that the amplitude of the dynamic curve oscillations around the static curve after the level of uplateau might be such that the maximum dynamic displacement reached is quite significantly higher than ustat (Fig. 18d) shows an example even if ud,max is not so bigger than ustat in that case, but the difference appeared to be much more significant in other cases). The procedure has thus been improved as follows. Knowing uplateau, the end of the horizontal plateau, consisting in its intersection with the static curve us(t), can be determined. Then, Eq. (7) can be solved again, with new initial conditions corresponding to this point where the displacement is uplateau and the velocity is taken equal to zero. Again, the new curve u(t) which is obtained from Eq. (7) is only valid until its first maximum. This procedure can be repeated several times (resolution of Eq. (7) with new limit conditions each time) to determine the successive parts of the dynamic curve, until the first maximum of the curve obtained from the resolution of Eq. (7) is higher than ustat. When it is the case, the maximum dynamic displacement is reached and the end of the dynamic curve can simply be approximated by an infinite horizontal plateau at the level of ud,max.
This procedure is applied to examples presented later on.
Required Input Data
To apply the developed simplified model, the static response of the frame has to be known; this can be obtained using the tools presented in the previous section. Besides, it is not sufficient to establish the static response for P statically increasing from zero to N0. Indeed, as higher displacements are likely to be reached under dynamic loading, the static response needs also to be known for values of the displacement higher than ustat. Basically, the static curve should be determined as far as possible, until a limit of resistance, stability or ductility is reached in any part of the structure.
Even though the main static data which is directly used in the model is the curve (P, u)stat, the determination of the static evolution of the internal forces when the displacement at the top of the failing column increases is also very important to assess the robustness of the structure. Besides, the location of the plastic hinges involved in the plastic mechanism of the frame directly affected part is also needed to estimate the value of generalised mass to be used in the model as explained here after.
In the developed model, the column loss is characterised by the function Pdyn(t) defining the way the critical column bearing capacity is supposed to decrease. Any function can be chosen.
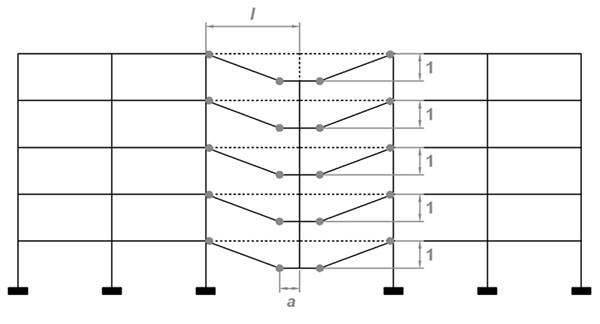
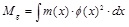
The generalised mass to be used in the model (Mg) is computed according to Eq.(8), considering the deformation mode corresponding to the formation of the global beam plastic mechanism in the structure directly affected part.
 |
(8) |
where m(x) is the distributed mass and ϕ(x) is the vertical displacement corresponding to the considered deformation mode, with ϕmax =1 (Fig. 15).
Under static conditions, if the plastic mechanism forms in the directly affected part of the structure for a value of P smaller than N0 (which is likely to occur), the plastic hinges forming at the centre of the directly affected part are not always located exactly at the beam ends but at a distance a from these extremities (Fig. 15). It is due to the fact that, while P < N0, the resultant of these two forces applied at the lost column top consists in an upward force and then the maxima of the bending moment diagram are not located at mid length of the directly affected part but at a distance a where the plastic hinges thus form.
Under dynamic loadings, two different situations can occur. If the column removal is rather slow, the plastic mechanism is the same as under static conditions. But if the column loss is quick enough, P reaches the value of N0 before the system has had the time to deform sufficiently for the plastic mechanism to develop; even if the plastic mechanism forms for P < N0 under static loading. Indeed, due to its inertia, the system deforms slowly at the beginning, in such a way the dynamic displacement is at first smaller than the static displacement corresponding to the applied load. Consequently, in such a case, P = N0 when the plastic mechanism develops; so the plastic hinges in the middle of the directly affected part form at the beam ends, where the sagging bending moment is maximum.
As the static response is supposed to be known, the generalised mass to be used in the model is computed assuming the static deformation mode. For relatively slow column losses, the dynamic deformation mode is the same as in static and the assumption is thus correct. For quicker column removals, the plastic hinges under sagging moment form at mid length of the directly affected part (a = 0). In such cases, assuming the static deformation mode leads to overestimate the value of Mg, and thus the maximum dynamic displacement, which is on the safe side. Moreover, the comparison of results obtained with this approach to dynamic finite element analyses proved the method not too conservative either (see examples given later on).
The computation of the generalised mass is made below under the following assumptions:
- The vertical displacement is the same at all storeys;
- The position of the plastic hinges is the same at all storeys;
- The beams are straight between two plastic hinges;
- The mass is uniformly distributed along the elements.
It leads to:
 |
(9) |
where:
- nb is the number of double-beams above the lost column;
- mb is the uniformly distributed mass along the beams (in kg/m), assumed to be the same for all beams in Eq. (9);
- Mc is the total mass of the columns above the lost column (if all the storeys have a height hc, nc is the number of columns above the lost column (nc = nb – 1) and mc is the uniformly distributed mass along the column (in kg/m), then) Mc = nc .hc .mc).
A last parameter which has to be known in order to be able to predict the response of a structure further to an impact loading is the value of the column loss time tr associated to the considered impact. For the moment, no analytical procedure to predict this value is available. However, in the framework of the Robustimpact European RFCS project, such an analytical model is under development in strong collaboration with RWTH (University of Aachen) and some promising results have already been obtained; such a model should be made available at the end of the project.
Robustness Assessment
Knowing the maximum dynamic displacement suffered by a frame losing a column, it is possible to assess its robustness, i.e. to determine if the structure elements are ductile and resistant enough to sustain the considered column removal.
Indeed, many finite element analyses demonstrated that the distribution of internal forces in a frame corresponding to a given value of the displacement u is the same no matter if this displacement is reached statically or dynamically (provided this displacement is reached for the first time, the unloadings and reloadings associated to the system oscillations are not considered).
Consequently, if the static response is known, the dynamic maximum displacement can be determined using the developed model; and then the corresponding distribution of internal forces can be deduced from the static response. If the structure is able to statically reach the displacement ud,max, then the dynamic robustness is ensured. Depending on the dynamic loading conditions, this maximum displacement ud,max to be sustained is close to ustat or significantly bigger.
APPLICATION OF THE PROPOSED MODEL
Considered Structure
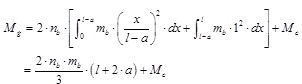
The considered example is the 2D frame of Fig. (16) suffering the loss of column 2. This frame is braced at one side. The columns are HEB300 profiles in S355 steel and the beams are IPE500 in S235; all the elements are bent about their major axis. The beam-to-column joints are rigid and full-strength ones. All storeys are 3,5 meters high and all spans are 7 meters long.
The considered loading simply consists in uniformly distributed loads p = 50 kN/m on all beams; the beam and column self-weight is also taken into account. This loading induces a compression force N0 = 1438 kN at the critical column top.
Input Data
The static response has been numerically established. The curve of the vertical displacement u at the removed column top versus the value of the static force P is represented in Fig. (17). The displacement corresponding to the complete static column loss (P = N0) is ustat = 0,79 m.
As far as dynamic column losses are concerned, a linear decrease of the compression force in the failing column has been considered (Pdyn (t) as given in Fig. (9), with P = N0).
A mass of 7850 kg/m3 has been taken into account for the steel elements (beams and columns). Besides, a uniformly distributed mass of 5096,84 kg/m has been associated to all beams (corresponding to the load p = 50 kN/m). The generalised mass has been computed accordingly, using Eq. (9) and considering a = 0,5 m (deduced from the static response):
 |
(10) |
Dynamic Response
A program has been developed using the software Matlab®, making the determination of the dynamic response according to the procedure explained previously very easy. The results obtained using the proposed model agree very well with the numerical predictions obtained from dynamic finite element analyses performed with Finelg, as shown in the following graphs (Fig. 18) for different speeds of the column removal (values of tr from 0 to 80 seconds).
CONCLUSION
The investigations presented in this paper reflect part of the research performed at the University of Liège in the field of robustness, with the final aim to provide simplified procedures to assess the robustness of frame structures suffering a column loss, for easy practical use.
In a first section, this paper summarises the performed developments assuming a quasi-static response of the structure, i.e. no dynamic effect are induced by the column loss. In particular, an analytical model has been developed and is briefly presented in the present paper. It is demonstrated that the proposed analytical model allows predicting with a very good accuracy the quasi-static response of a 2D and 3D steel structure further to a column loss if some limiting assumptions are respected. Then, to raise these assumptions, an easy-to-use and efficient numerical tool has been developed and validated through comparisons to FEM simulation results.
In a second section, it is demonstrated how the dynamic effects which could be associated to a column loss can be predicted on the basis of the knowledge of the quasi-static response of a structure. In particular, a simplified analytical model is proposed to predict the maximum deformation associated to the dynamic loss of a column. Knowing this maximum displacement, it is then possible to predict the redistribution of forces within the considered structure and so to assess the robustness of this structure. The proposed model is finally applied to a work example.
CONFLICT OF INTEREST
The authors confirm that this article content has no conflict of interest.
ACKNOWLEDGEMENTS
Part of the presented work was carried out with a financial grant from the Research Fund for Coal and Steel of the European Community, within Robustimpact project Grant N0 RFSR-CT-2012-00029.

