All published articles of this journal are available on ScienceDirect.
Evaluation of Nano-Silica Modified ECC Based on Ultrasonic Pulse Velocity and Rebound Hammer
Abstract
Introdcution:
Engineered cementitious composite (ECC) has gained attention among researchers due to its superior tensile properties. To improve its modulus elasticity, due to absence of coarse aggregate, nano-silica (NS) has been added to ECC mixture.
Method:
To facilitate the usage of the NS-ECC in the construction industry, using nondestructive tests such as rebound hammer (RH) and ultrasonic pulse velocity (UPV) to predict the compressive strength of NS-ECC is worthwhile. Twenty mixtures with two variables which are four PVA% (0.5, 1, 1.5 and 2) and five NS% (0, 1, 2, 3 and 4) have been proportioned, cast, cured and tested using RH, UPV and then crushed to determine the compressive strength at age of 28 days.
Results and Conclusion:
Response surface methodology (RSM) has been performed to develop models for predicting the compressive strength of NS-ECC utilizing results from RH and UPV. It has been established that the newly developed models are significant with values of “Prob > F” less than 0.05 and also have variance less than 0.2. Therefore, these models can be used to predict the compressive strength of NS-ECC using rebound hammer or/and ultra-pulse velocity.
1. INTRODUCTION
Engineered cementitious composite (ECC) is a special type of high performance fiber reinforced cementitious composites (HPFRCCs) concrete and based on the micromechanics theory [1]. ECC exhibits a strain-hardening under tensile loading and shows a ductility level 200 to 600 times higher than concrete. It has also the ability to control crack widths to less than 100 micron, this can be achieved by using small volume of PVA fibers up to 2% [2]. By adjusting the mix proportions, the compressive strength of ECC ranges between 30 MPa and 80 MPa; the value of tensile strength ranges from 4 MPa to 6 MPa and compression strain 0.4% to 0.65% [3].Capitalizing on its improved properties such as high ductility and energy absorption, ECC has been recommended for structural applications [4]. Several researchers have applied ECC in structural components such as: link slab for bridge decks [2], high performance composite slabs with ECC as topping materials [4, 5], reinforced ECC beams with higher ductility [6], ECC dapped-end area for reinforced concrete beams for bridge applications [7], jacketing retrofitting for RC members [1], ECC strips in tension cover zone of RC slabs [8], beam-column joint connections for less transverse reinforcement [9], reinforced ECC slabs [10], RC beams with ECC layers for fatigue enhancement [11], etc. Utilizing of nano-silica (NS) particles in making of concrete mixtures lead to reduction of cement content without compromising on quality of the concrete [12]. Mohammed et al. (2016) [13] have shown that nano-silica has the ability to improve the compressive strength and durability of concrete through chemical and physical action. Chemically, nano-silica acts an activator to Pozzolanic reaction which lead to produce more C-S-H gel. While physically, it has the ability of refining the pore system and densifying the interfacial transition zone (ITZ). Non-destructive compressive strength testing can be applied to monitor the compressive strength development, assessing the integrity of a structure, or for quality control purposes which replace the destructive testing methods like examining the core samples from the structure [14]. Rebound hammer (RH) test, to evaluate the surface hardness of concrete, and ultrasonic pulse velocity (UPV) test, to measure the sound velocity of concrete, are generally being used for measuring the compressive strength of concrete [15]. In determining the compressive strength of concrete using RH, upon pressing the RH against the hardened surface of concrete the compression wave is propagated by the plunger (
2. EXPERIMENTAL PROGRAM
2.1. Materials Properties and Mix Proportions
Twenty mixtures of self-compacting engineered cementitious composite (ECC) were prepared, cast, cured and tested at age of 28 days. The proportions of these mixtures are shown in Table 1. The main ingredients of ECC are: ordinary cement conforms to the requirements of ASTM C150, fly ash (FA), washed river sand having an average size of 450 µm, potable water, polyvinyl alcohol (PVA) fiber by volume fraction, and nano-silica (NS) in percentage of cementitious content (cement + fly ash). Two variables were considered in this study which are five levels of NS% (0%, 1%, 2%, 3% and 4%) and four levels of PVA fiber (0.5%, 1%, 1.5% and 2%). FA used in this study is class F conform to the requirements of ASTM C618 with the amount of SiO2+Al2O3+Fe2O3 is about 82.12% and less than 6 loss on ignition. While the nano-silica (NS), used in this study, contains 99.8% of SiO2 and has specific surface area of 100
| Mix ID | Cement (kg/m3) | Sand (kg/m3) | Fly ash (kg/m3) | Water (kg/m3) |
SP (HRWR) Dose (% of cementitious materials) |
PVA (%) | NS (%) |
|---|---|---|---|---|---|---|---|
| M1 | 583 | 467 | 700 | 187 | 0.74 | 0.5 | 0 |
| M2 | 583 | 467 | 700 | 187 | 0.82 | 1 | 0 |
| M3 | 583 | 467 | 700 | 187 | 0.89 | 1.5 | 0 |
| M4 | 583 | 467 | 700 | 187 | 0.99 | 2 | 0 |
| M5 | 583 | 467 | 700 | 187 | 0.93 | 0.5 | 1 |
| M6 | 583 | 467 | 700 | 187 | 1.13 | 1 | 1 |
| M7 | 583 | 467 | 700 | 187 | 1.25 | 1.5 | 1 |
| M8 | 583 | 467 | 700 | 187 | 1.29 | 2 | 1 |
| M9 | 583 | 467 | 700 | 187 | 1.41 | 0.5 | 2 |
| M10 | 583 | 467 | 700 | 187 | 1.5 | 1 | 2 |
| M11 | 583 | 467 | 700 | 187 | 1.71 | 1.5 | 2 |
| M12 | 583 | 467 | 700 | 187 | 1.95 | 2 | 2 |
| M13 | 583 | 467 | 700 | 187 | 1.7 | 0.5 | 3 |
| M14 | 583 | 467 | 700 | 187 | 2.01 | 1 | 3 |
| M15 | 583 | 467 | 700 | 187 | 2.44 | 1.5 | 3 |
| M16 | 583 | 467 | 700 | 187 | 2.55 | 2 | 3 |
| M17 | 583 | 467 | 700 | 187 | 2.61 | 0.5 | 4 |
| M18 | 583 | 467 | 700 | 187 | 2.74 | 1 | 4 |
| M19 | 583 | 467 | 700 | 187 | 2.91 | 1.5 | 4 |
| M20 | 583 | 467 | 700 | 187 | 3.19 | 2 | 4 |
2.2. Experimental Program
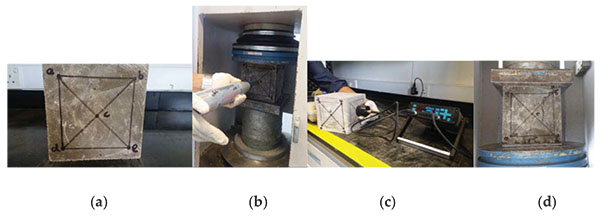
The ingredients of NS-ECC mixture have been mixed and cast into 150 mm steel cube molds and left in laboratory for curing. After 24 hours, the cubes were de-molded and placed in curing tank for the duration of the testing periods which was at age of 28 days. On the day of testing, the cubes are taken out from the water, dried with the cloths and air blower if necessary to ensure a clean dry surface. After the cubes dried, they were marked at 5 testing points on each four faces (the loading faces not marked). The testing points are located about 20 mm from the edges of the cube as shown in Fig. (1a). Then each surface of the cube (four sides) is prepared for rebound hammer (RH) test according to ASTM C850 requirements. The cube was placed in compressive testing machine and a slight load was applied to hold the sample in order to prevent its movement during RH test as shown in Fig. (1b). Nine readings of RH were recorded at each of the five point on each surface and then average of readings were obtained. The concrete cubes were then prepared for the ultra pulse velocity (UPV) test according to ASTM C597 requirements as shown in Fig. (1c). Nine readings of UPV were recorded at each of the five points at the opposite faces of the cube and the average of these reading were recorded. Lastly, The NS-ECC cube was placed in the compressive strength testing machine and the compressive strength test was carried out in accordance to the requirement of BS 1881-116 as shown in Fig. (1d). The average readings of RH, UPV and compressive strength of three cubes are tabulated in Table 2.
| Mixture | RH, Rebound Number(RN) | UPV (m/s) (MPa) | Compressive Strength |
|---|---|---|---|
| M1 | 28 | 4345 | 74 |
| M2 | 30 | 4409 | 81 |
| M3 | 31 | 4525 | 86 |
| M4 | 33 | 4688 | 98 |
| M5 | 29 | 4385 | 77 |
| M6 | 31 | 4452 | 83 |
| M7 | 32 | 4617 | 90 |
| M8 | 34 | 4765 | 101 |
| M9 | 30 | 4402 | 80 |
| M10 | 31 | 4547 | 87 |
| M11 | 32 | 4638 | 91 |
| M12 | 35 | 4798 | 103 |
| M13 | 32 | 4673 | 92 |
| M14 | 32 | 4695 | 93 |
| M15 | 33 | 4728 | 96 |
| M16 | 33 | 4703 | 95 |
| M17 | 28 | 4312 | 72 |
| M18 | 29 | 4362 | 78 |
| M19 | 31 | 4437 | 84 |
| M20 | 32 | 4689 | 93 |
3. RESULTS AND ANALYSIS
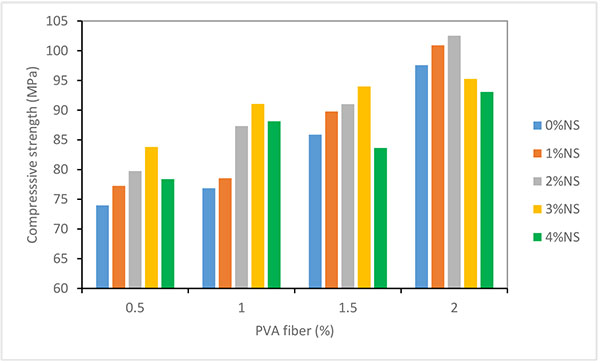
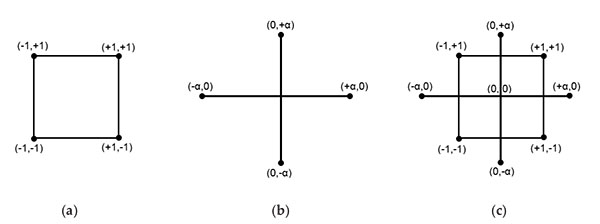
As shown in Fig. (2), at each PVA%; the compressive strength of NS-ECC mixtures increases as the NS% increasing. This increase in the compressive strength is attributed to the physicochemical effects of the NS particles. Chemically, NS consumes Ca(OH)2 to produce C-S-H gel which is responsible on the strength of concrete. While physically, the NS particles have the ability to fill up the nano voids inside the ECC mixtures which leads to dense microstructure and consequently increasing the compressive strength. However, when the NS has been increased up to 4%; the excess amount of the NS particles have been left inside the microstructure as non-aggregate leading to less dense microstructure and consequently decreasing in the compressive strength. As the amount of PVA increases to 2%, also increasing the amount of NS for 2% will lead to decrease in the compressive strength. This attributed to the high dosage of HRWR required to maintain the flow-ability of the NS-ECC. Using the laboratory results, experimental design models have been established in order to relate the obtained responses to for the variables of interest. Design Experts_10 software from Stat-Ease In, has been used to develop the models, using RSM (Response Surface Methodology) helped in exploring the relationships between several explanatory variables and one or more response variables [22]. Therefore, the key objective of this work described in this study is to apply the RSM optimization by CCD (central composite design) in modeling compression strength, rebound number and UPV .The core idea of RSM is to use a sequence of designed experiments to find an optimum response. Two variables which were (Nano-Silica and PVA fiber percentages) and three responses that are (Rebound Number, UPV and Compressive Strength) of 20 mixtures were incorporated into Design Expert software in order to interpret the interaction of the variables in producing the responses. In this experimental design the CCD consists of 20 experimental runs for variables PVA and nano-silica. As shown in Fig. (3), the typical CCD for two factors can be characterized as shown in Fig. (3): (i) in the square the design points are represented by the four corners factorial (+/- 1), (ii)central axial design points designates the (+/- alpha), (iii) +/-1 to describe the limits for the area of interest where the optimum is believed to exist, axial points will typically be outside this limit, and iv) alphas to define the area of operability, the area of interest will be within the area of operability.
3.1. Predictive Models
The polynomial equations (1) to (3), are in terms of actual factors and these can be used to make predictions about the responses compressive strength, rebound number and UPV values for given levels of each factor. Here, the levels should be specified in the original units i.e. PVA and Nano-silica are in percentage for each factor. This equations are not to be used to determine the relative impact of each factor because the coefficients are scaled to accommodate the units of each factor and the intercept is not at the center of the design space
 |
(1) |
 |
(2) |
 |
(3) |
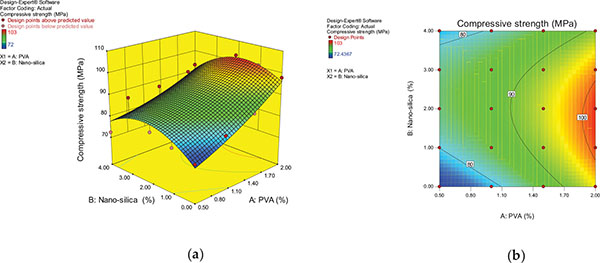
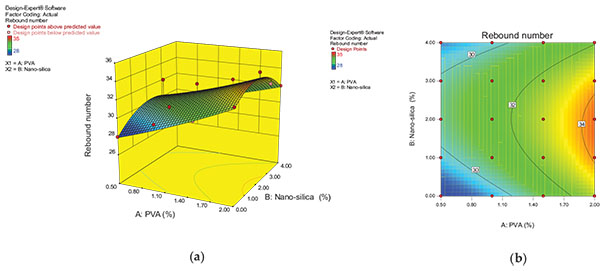
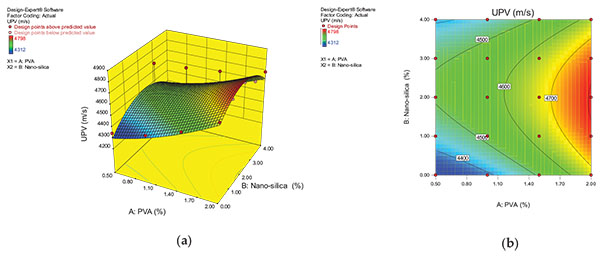
From the Fig. (4), it can be noted that the percentage of PVA is directly proportional in improving the compressive strength whereas the optimum of 2% nanosilica addition has shown the high compressive strength. In the contour diagram where the reddish color region shows that the compressive strength of 100 MPa and above can be achieved at the 2% nano-silica and 2% PVA. The greenish region indicates the 90MPa strength for PVA of 1 to 1.7% and nano-silica of 1 to 2%. In Figs. (5 and 6), it can be observed that the rebound number and UPV values were increased with the increase of PVA and up to 2% of nano-silica, beyond 2% of nano-silica rebound number and UPV values were decreased gradually. In the contour diagrams, the contour lines are oval shaped, this means that there is a good interaction between nano-silica and PVA on the responses and also from the contour diagrams it can be observed the ranges of variables NS and PVA for interval of response.
3.2. Model Validation
The model validation has been performed using the ANOVA (analysis of variance) in order get the relationship by the interaction of the two process variables PVA and nano-silica. Thus the validation for the responses (compressive strength, rebound number and UPV) can be obtained. The ANOVA validation results are tabulated in (Table 3). From the Table 3, it can be witnessed that the model is significant by observing the F-value. There is only a 0.95% chance that an F-value this large could occur due to noise. Values of “Prob > F” less than 0.0500 indicate model terms are significant
| Response | Factors | Sum of Squares | df | Mean Squares | F value | P-value | Significance |
|---|---|---|---|---|---|---|---|
| Model | 1249.851 | 5 | 249.97 | 13.59 | 5.93E-05 | Yes | |
| PVA | 955.428 | 1 | 955.428 | 51.943 | 4.5E-06 | Yes | |
| NS | 0.072 | 1 | 0.072 | 0.004 | 0.951105 | No | |
| Compressive | PVA*NS | 36.534 | 1 | 36.534 | 1.986 | 0.18056 | No |
| Strength | PVA2 | 14.484 | 1 | 14.484 | 0.787 | 0.389865 | No |
| NS2 | 243.333 | 1 | 243.333 | 13.229 | 0.002692 | Yes | |
| Residual | 257.512 | 14 | 18.394 | - | - | - | |
| CorTotal | 1507.363 | 19 | - | - | - | - | |
| Model | 50.04 | 5 | 11.81 | 18.05 | 0.0001 | Yes | |
| PVA | 43.56 | 1 | 43.56 | 66.58 | 0.0001 | No | |
| NS | 0 | 1 | 0 | 0 | 1 | No | |
| Rebound | PVA*NS | 1.28 | 1 | 1.28 | 1.96 | 0.1837 | No |
| number | PVA2 | 0.2 | 1 | 0.2 | 0.31 | 0.5891 | No |
| NS2 | 14 | 1 | 14 | 21.41 | 0.0004 | Yes | |
| Residual | 9.16 | 14 | 0.65 | - | - | - | |
| CorTotal | 68.2 | 19 | - | - | - | - | |
| Model | 3.60E+05 | 5 | 71962.61 | 8.81 | 0.0006 | Yes | |
| PVA | 2.56E+05 | 1 | 2.56E+05 | 31.32 | 0.0001 | Yes | |
| NS | 1512.9 | 1 | 1512.9 | 0.19 | 0.6735 | No | |
| UPV | PVA*NS | 5618 | 1 | 5618 | 0.69 | 0.4208 | No |
| PVA2 | 6125 | 1 | 6125 | 0.75 | 0.4011 | No | |
| NS2 | 90723.5 | 1 | 90723.5 | 11.11 | 0.0049 | Yes | |
| Residual | 1.14E+05 | 14 | 8167.57 | - | - | - | |
| CorTotal | 4.74E+05 | 19 | - | - | - | - |
The adequacy of the ANOVA model can be determined by the values of the factors prescribed in the Table 4. For all the three responses compressive strength, rebound number, and UPV, it can be observed that the “Predicted R-Squared” is in sensible agreement with the “Adjustable R-Squared”; i.e. the variance is less than 0.2. “Adeq Precision” measures the signal to noise ratio and this ratio greater than 4 is desirable. This model can be used to navigate the design space. The co-efficient of variable (CV) for all the three responses within the 5%, this indicates the residual errors are lower than the predicted values. Also, the predicted residual error sum of squares (PRESS) indicates that the model has the high predicting capacity.
| Factors | Compressive Strength | RN | UPV |
|---|---|---|---|
| Std.Dev. | 4.29 | 0.81 | 90.37 |
| Mean | 87.72 | 31.3 | 4558.5 |
| C.V % | 4.89 | 2.58 | 1.98 |
| PRESS | 559.15 | 18.84 | 2.34E+05 |
| -2 Log Likelihood | 107.86 | 41.14 | 229.78 |
| R-Squared | 0.8292 | 0.8657 | 0.7588 |
| Adj R-squared | 0.7682 | 0.8177 | 0.6727 |
| Pred R-squared | 0.6291 | 0.7237 | 0.5057 |
| Adeq precision | 12.572 | 14.536 | 10.274 |
| BIC | 125.84 | 59.11 | 247.76 |
| AICc | 126.33 | 59.6 | 248.24 |
3.3. Diagnostic Plots
The diagnostic plots are also important in validating the predicted models. The normal probability plot in the Fig. (7), from which we can observe that the residual points lying approximately on straight line and also follow the “S” shaped curve, therefore it can be said that the residuals are distributed normally and the response transformation provides the better analysis.

In the Fig. (8), of studentized residuals. More significantly in this instance, all points lie within the parameters (calculated at the 95 percent confidence level). In other words, Mark’s high game does not exhibit anything more than common-cause variability, so it should not be disqualified.
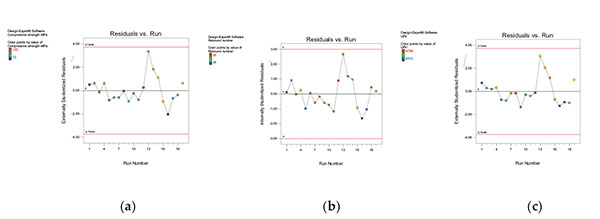
Fig. (9) shows the predicted versus actual values plot for all the three responses, and these were ranged adjacent to the straight line, thus it can be said that the predicted and actual results were in good agreement and can be fit with each in mutually. Therefore, the established RSM models are relevant and applicable in predicting compressive strength of ECC.

3.4. Evaluation of Compressive Strength Based on RN and UPV
The compressive strength based on RN and UPV can be obtained by using the equations (4) and (5). These equations are developed by using the RSM analysis model. Table 5 shows the P-values for model is less than 0.05 and thus the obtained model is significant and from the Table 6 it can be observed that the difference between adj R squared and pred R squared is less than 2, with the high efficiency of 97%, this indicates the high correlation degree between the predicted and observed values.
 |
(4) |
 |
(5) |
| Response | Factors | Sum of Squares | df | Mean Squares | F value | P-value | Significance |
|---|---|---|---|---|---|---|---|
| Model | 1475.15 | 3 | 491.72 | 244.24 | <0.0001 | Yes | |
| Compressive | RN | 637.69 | 1 | 637.69 | 316.75 | <0.0001 | Yes |
| strength | RN*RN | 12.93 | 1 | 12.93 | 6.42 | 0.0221 | No |
| Based on RN | RN*RN*RN | 14.18 | 1 | 14.18 | 7.04 | 0.0173 | No |
| Residual | 32.21 | 16 | 2.01 | - | - - | ||
| Lack of fit | 7.99 | 4 | 2 | 0.99 | 0.4502 | No | |
| Pure error | 24.23 | 12 | 2.02 | - | - - | ||
| CorTotal | 1507.363 | 19 | - | - | - - | ||
| Model | 1475.77 | 3 | 491.92 | 249.17 | 0.0001 | Yes | |
| Compressive | UPV | 212.63 | 1 | 212.633 | 107.7 | 0.0001 | No |
| strength | UPV*UPV | 11.17 | 1 | 11.17 | 5.66 | 0.0301 | No |
| based on UPV | UPV*UPV*UPV | 22.86 | 1 | 22.86 | 11.58 | 0.0036 | No |
| Residual | 31.59 | 16 | 1.97 | - | - | No | |
| Cor Total | 1507.36 | 19 | - | - | - | Yes |
| Factors | Compressive strength based on RN | Compressive Strength Based on UPV |
|---|---|---|
| Std.Dev. | 1.42 | 1.41 |
| Mean | 87.72 | 87.72 |
| C.V % | 1.62 | 1.6 |
| PRESS | 47.75 | 46.19 |
| -2 Log Likelihood | 66.29 | 65.9 |
| R-Squared | 0.9786 | 0.979 |
| Adj R-squared | 0.9746 | 0.9751 |
| Pred R-squared | 0.9683 | 0.9694 |
| Adeq precision | 46.51 | 50.302 |
| BIC | 78.27 | 77.88 |
| AICc | 76.96 | 76.57 |
3.5. Optimization
A multi-objective optimization technique has been performed by using the RSM. For the given range of variables the predicted responses can be obtained by using the optimization technique. In RSM technique all the responses have the optimal values which are localized in various regions; therefore it will be more tedious to find the circumstances which suit all the responses. The difficulty level for optimization increases as the optimal regions do not intersect and moves away from each other. In most of the cases it was observed that all the response surfaces are found to be absent in its optimum under the similar set of experimental situations. Thus, modification in the level of a factor can improve and have negative cause on another factor. Therefore, the use of multi-objective methodology is one of the approaches in solving the problem of optimization for numerous responses. In this study the multi-response optimization method has been used to optimize the UPV and RN for compressive strength of ECC. The possibility of solutions by the RSM optimization is measured by the desirability scale, which is a dimensionless function. The desirability function is the most significant criteria in obtaining the desired responses. The individual desirability scale are obtained in the range of zero to 1, where zero indicates a completely undesirable and 1 indicates fully desirable response [23, 24].
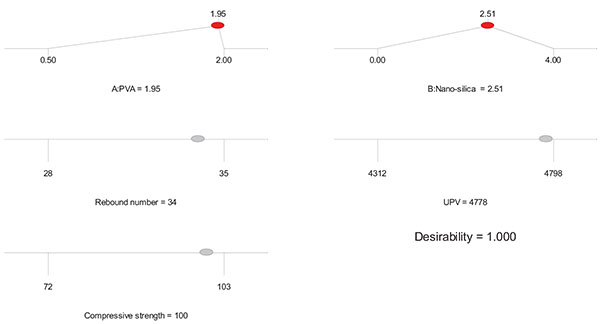
Here in this case for the compressive strength of 100MPa is optimized for the best proportions of PVA and nano-silica with the desirability factor 1, thus the other responses rebound number and UPV are found with respect to the targeted strength. The ramp diagram for optimized response has been shown in the Fig. (10). Here in this case for the compressive strength of 100MPa is optimized for the best proportions of PVA and nano-silica with the desirability factor 1, thus the other responses rebound number and UPV are found with respect to the targeted strength. The ramp diagram for optimized response has been shown in the Fig. (10).
3.6. Experimental Validation
The experimental validation for the above optimized mixture had been performed in the laboratory and it was found less than 5% of variation from the obtained results. The results for validation are tabulated in the Table 7.
| Number | PVA% | Nanosilica % | Compressive strength Mpa | RN | UPV m/s |
|---|---|---|---|---|---|
| Optimization | 100 | 34 | 4778 | ||
| 1.95 | 2.51 | ||||
| Experimental | 104 | 35 | 4648 | ||
| Variation | 4% | 2.93% | 2.80% |
CONCLUSION
The following conclusions can be drawn from this paper.
- To achieve a higher compressive strength of engineered cementitious composite, the optimum amount of nano-silica is 2%.
- RSM models to predict RN, UPV and compressive strength of NS-ECC based on the amount of PVA and NS have been developed with ANOVA of more than 95% significance level. The difference between Adjusted R2 and Predicted R2 is less than 0.2.
- RSM models to predict compressive strength of NS-ECC based on RN and UPV have been developed with ANOVA of more than 95% significance level. The difference between Adjusted R2 and Predicted R2 is less than 0.2.
- From models verification, the difference between optimized RSM output and the experimental output is less than 5% with desirability function 1.
CONSENT FOR PUBLICATION
Not applicable.
CONFLICT OF INTEREST
The authors declare no conflict of interest, financial or otherwise.
ACKNOWLEDGEMENTS
Declared none.


