All published articles of this journal are available on ScienceDirect.

A Comparative Study of Distribution Structure Cross Arms
Abstract
Background:
The structural performance of cross arms used on distribution poles is studied in this paper. Tangent and Dead End configurations involving conventional (wood) and composite (fiber glass) cross arms are analyzed. Strength-to-Stiffness and Weight-to-Stiffness ratios associated with study cases are determined and evaluated.
Results and Conclusion:
It is observed that although initial costs are higher, composite cross arms offer long-term advantages in terms of strength, stiffness, performance and durability.
1. INTRODUCTION
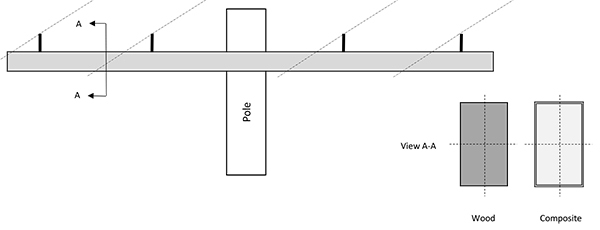
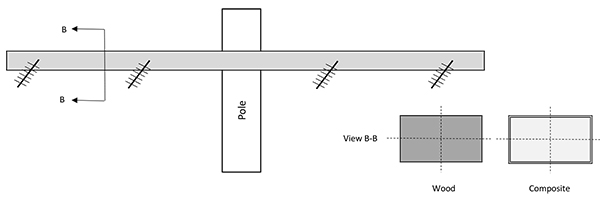
In the electrical utility industry, lines of voltages 35 kV and below are generally termed distribution lines. Cross arms are horizontal elements used on distribution line structures to support insulators and conductors of various configurations. Figs. (1a and 1b) show a typical tangent (suspension) and a dead end cross arm configuration, respectively. Wood cross arms are traditionally used by utilities, although during the past decade, composite (fiber-reinforced) poles and cross arms are increasingly becoming popular [1]. Some of the advantages of composite cross arms include lighter weight, excellent strength and stiffness, low conductivity, moisture and corrosion resistance, ease of installation, minimum maintenance and durability.
Wood distribution cross arm sizes and design are standardized by the Rural Utilities Service (RUS) of United States Department of Agriculture [2-4] on the basis of length and pattern/location of insulator attachments. RUS Bulletin 1724E-151 [5] discusses the structural loading and analysis of distribution cross arms. The design of composite utility poles and structures is governed by ASCE Manual 104 [6] and the NESC [7]; however, the Manual does not address cross arms specifically. NESC specifies load and strength factors required for design.
From strength perspectives, allowable loads per load point for wood arms are derived simply on the basis of designated ultimate bending stress and recommended strength reduction factors. For composite arms, allowable loads per load point are obtained on the basis of test loads and deflections. NESC recommends a strength factor of 1.00 for composite cross arms. Most composite materials possess high strength-to-stiffness ratios thus permitting poles to be designed to be as flexible as needed. However, there is no information available on this flexibility aspect as it refers to composite cross arms.
To the best of our knowledge, there is little information in literature regarding the relative performance of wood and composite distribution cross arms. Parameters such as strength-to-stiffness ratios and weight-to-stiffness ratios are useful for engineers in making design choices. This study is a small step in this direction.
The objectives of this paper are to:
- Derive relationship between wire loads and strength for wood cross arms based on ultimate design bending stress.
- Derive relationship between wire loads and strength for composite cross arms based on test deflections.
- Propose definitions of Strength-to-Stiffness and Weight-to-Stiffness ratios.
- Evaluate the strength and stiffness performance of various wood and composite cross arms in both tangent and dead end configurations.
- Compare Strength-to-Stiffness and Weight-to-Stiffness ratios of all study cases.
This study is limited to linear, elastic behavior of the structural elements. For tangent cross arms, only vertical or gravity loads are considered. For dead end cross arms, whose design is controlled by longitudinal loads, only wire tension loads are considered. Ice loads and transverse loads due to wind and line angles are not considered here but will be included in future studies.
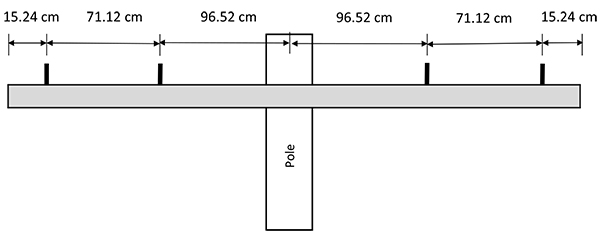
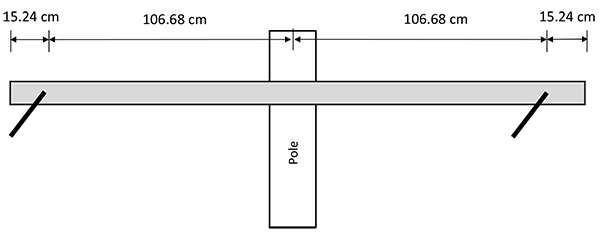
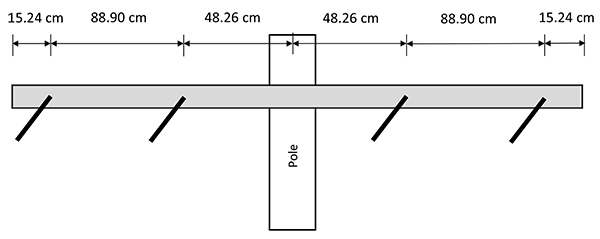
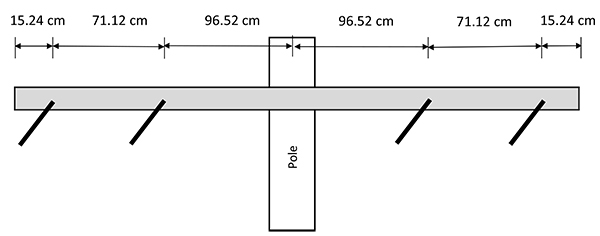
2. TANGENT AND DEAD END CROSS ARMS
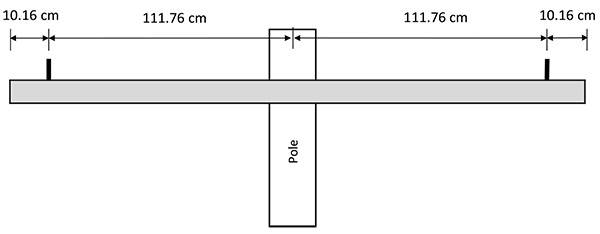
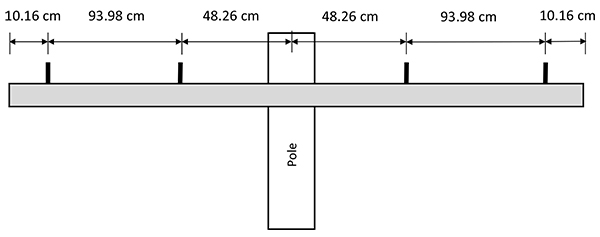
The six (6) configurations of tangent and dead end distribution cross arms studied in this paper are shown in Figs. (2 and 3). The selected configurations are standard designs which are commonly used by utilities [8]. Both Douglas Fir and Southern Yellow Pine are popular materials for wood cross arms [4]; however, Douglas Fir is selected in this study for its superior strength in terms of Modulus of Elasticity.
2.1. Connection to Pole
Composite cross arms are firmly attached to the pole with a metal mounting bracket and multiple bolts. This connection is almost a fixed joint. Wood cross arms are generally connected to the pole with a single machine bolt, washer and a lock nut. This situation is closer to a pinned joint than a fixed joint. In fact, wood cross arms often have V-braces underneath to provide additional support against bending. However, in order to have consistency and facilitate a one-on-one comparison in this study, the connection at pole in both cases is considered fixed thus enabling modeling as a simple cantilever in both.
3. MATERIAL PROPERTIES
For cross arms made of Douglas Fir material, the designated ultimate bending stress is 51 MPa (7.4 ksi). Modulus of Elasticity ‘E’ is 13.24 GPa (1920 ksi) [4]. The dressed sizes of wood cross arms used in the study are 88.9 mm x 114.3 mm (3½ in. x 4½ in.). Material dry density for calculation purposes is taken as 6.28 kN/m3 (40 pcf).
For cross arms made of composite materials, Table 1 gives the elastic properties used in the study [9]. Density of composites varies with type of manufacture but standard cross arms weigh about 0.0054 to 0.0068 kN/m (4 to 5 plf). Typical composite cross arms are similar to wood cross arms in cross sectional dimensions.
| Beam Series |
Ave. Bending Stress - Tangent (MPa) |
Ave. Bending Stress - Dead End (MPa) |
Ave. Modulus of Elasticity E (GPa) |
Section Dimensions (mm x mm) |
Wall Thickness * (mm) |
|---|---|---|---|---|---|
| (1) | (2) | (3) | (4) | (5) | (6) |
| 2200 | 257.2 | 342.0 | 33.79 | 92.08 x 117.48 | 4.57, 5.08 |
| 2000 | 344.8 | 447.5 | 24.82 | 92.08 x 117.48 | 6.10, 6.86 |
| 2500 | 462.0 | 513.7 | 35.85 | 92.08 x 117.48 | 6.10, 6.86 |
| 3000 | 648.1 | 717.1 | 37.92 | 92.08 x 117.48 | 8.13, 8.89 |
4. LOAD CAPACITY DERIVATIONS
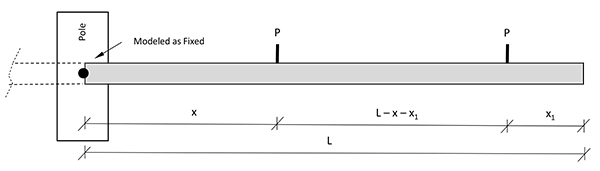
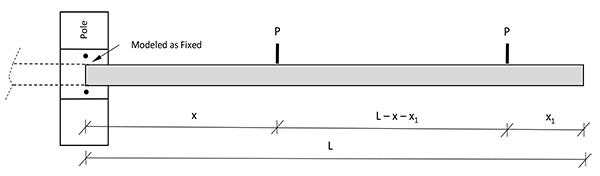
Figs. (4a and 4b) show the cantilever models of the cross arms analyzed. Since symmetry is available, only one half of the total cross arm is modeled.
4.1. Load and Strength Factors
All loads used in the analyses include appropriate load factors. Capacities include recommended strength (reduction) factors. The values used in this study are given below [4].
Load Factor γ Vertical Load 1.50
Longitudinal Load 1.65 (Wire Tension)
Strength Factor ψ Wood Cross Arm 0.65 (Applied to designated bending stress fr)
Composite Cross Arm 1.00
4.2. Wood Cross Arms
The derivation of the relationship between applied loads, insulator locations, deflections and cross arm bending strength is shown in Appendix A. The equations are applicable to both tangent and dead end cross arms.
Tables 2 and 3 show the results of application of the equations to various tangent cross arms. Three (3) wood cross arms and eleven (11) composite cross arms are studied.
| Case Id | Setup |
Model Length L # (mm) |
x (mm) |
x1 (mm) |
PU (kN) |
PALL (kN) |
Deflection at Free End Δ (mm) |
Lateral Stiffness kL (kN/m) |
Arm Weight W (N) |
Strength-to-Stiffness Ratio RSS (1/mm) |
Weight-to-Stiffness Ratio RWS (1/mm) |
Cost ($) |
|---|---|---|---|---|---|---|---|---|---|---|---|---|
| (1) | (2) | (3) | (4) | (5) | (6) | (7) | (8) | (9) | (10) | (11) | (12) | (13) |
| WT1 | Fig. (2a) | 1219.2 | 1117.6 | 101.6 | 8.81 | 5.87 | 31.8 | 969 | 78 | 9.14 | 0.0813 | 30 |
| WT2 | Fig. (2b) | 1524.0 | 482.6 | 101.6 | 5.17 | 2.24 | 43.1 | 496 | 97 | 20.83 | 0.196 | 37.5 |
| WT3 | Fig. (2c) | 1828.8 | 965.2 | 152.4 | 3.72 | 1.61 | 63.2 | 287 | 117 | 25.91 | 0.406 | 45 |
| Average | 18.63 | 0.228 |
** γ = 1.50 and ψ = 0.65.
| Case Id * | Setup |
Model Length L # (mm) |
x (mm) |
x1 (mm) |
PU (kN) |
PALL (kN) |
Deflection at Free End Δ (mm) |
Lateral Stiffness kL (kN/m) |
Arm Weight W (N) |
Strength-to-Stiffness Ratio RSS (1/mm) |
Weight-to-Stiffness Ratio RWS (1/mm) |
Cost ($) |
|---|---|---|---|---|---|---|---|---|---|---|---|---|
| (1) | (2) | (3) | (4) | (5) | (6) | (7) | (8) | (9) | (10) | (11) | (12) | (13) |
| CT1 | Fig. (2a) | 1219.2 | 1117.6 | 101.6 | 15.57 | 6.75 | 62.5 | 871.8 | 76 | 17.88 | 0.087 | 56 |
| CT2 | Fig. (2b) | 1524.0 | 482.6 | 101.6 | 12.23 | 5.30 | 113.3 | 446.4 | 89 | 54.76 | 0.199 | 68 |
| CT3 | Fig. (2a) | 1219.2 | 1117.6 | 101.6 | 28.47 | 18.97 | 121.2 | 821.7 | 93 | 34.62 | 0.114 | 56 |
| CT4 | Fig. (2b) | 1524.0 | 482.6 | 101.6 | 24.02 | 16.01 | 236.1 | 420.7 | 111 | 114.1 | 0.356 | 69 |
| CT5 | Fig. (2c) | 1828.8 | 965.2 | 152.4 | 18.68 | 12.45 | 259.1 | 351.7 | 125 | 106.2 | 0.354 | 84 |
| CT6 | Fig. (2a) | 1219.2 | 1117.6 | 101.6 | 33.36 | 22.24 | 98.3 | 1186.9 | 98 | 28.1 | 0.082 | 79 |
| CT7 | Fig. (2b) | 1524.0 | 482.6 | 102.6 | 26.69 | 17.8 | 181.6 | 607.7 | 116 | 87.8 | 0.190 | 92 |
| CT8 | Fig. (2c) | 1828.8 | 965.2 | 152.4 | 24.46 | 16.31 | 339.1 | 351.7 | 129 | 139.0 | 0.366 | 118 |
| CT9 | Fig. (2a) | 1219.2 | 1117.6 | 101.6 | 44.48 | 29.65 | 100.4 | 1549.9 | 120 | 28.68 | 0.077 | 79 |
| CT10 | Fig. (2b) | 1524.0 | 482.6 | 152.4 | 41.81 | 27.87 | 217.9 | 793.5 | 138 | 105.3 | 0.174 | 92 |
| CT11 | Fig. (2c) | 1828.8 | 965.2 | 152.4 | 35.58 | 23.72 | 377.8 | 459.2 | 160 | 154.9 | 0.345 | 118 |
| Average | 79.213 | 0.213 |
CT5 to CT8 Beam Series 2500 CT9 to CT11 Beam Series 3000.
** γ = 1.50 and ψ = 1.00.
# Corresponds to half the total length shown in setup.
4.3. Composite Cross Arms
The derivation of the relationship between test loads, insulator locations, deflections and cross arm bending strength is shown in Appendix B. The equations are applicable to both tangent and dead end cross arms.
Tables 4 and 5 show the results of application of the equations to various dead end cross arms. Three (3) wood cross arms and eight (8) composite cross arms are studied.
| Case Id | Setup |
Model Length L # (mm) |
x (mm) |
x1 (mm) |
PU (kN) |
PALL (kN) |
Deflection at Free End Δ (mm) |
Lateral Stiffness kL (kN/m) |
Arm Weight W (N) |
Strength-to-Stiffness Ratio RSS (1/mm) |
Weight-to-Stiffness Ratio RWS (1/mm) |
Cost ($) |
|---|---|---|---|---|---|---|---|---|---|---|---|---|
| (1) | (2) | (3) | (4) | (5) | (6) | (7) | (8) | (9) | (10) | (11) | (12) | (13) |
| WD1 | Fig. (3a) | 1219.2 | 1066.8 | 152.4 | 9.22 | 3.63 | 31.0 | 969 | 78 | 9.40 | 0.080 | 30 |
| WD2 | Fig. (3b) | 1524.0 | 482.6 | 152.4 | 5.34 | 2.11 | 42.1 | 496 | 97 | 21.34 | 0.196 | 37.5 |
| WD3 | Fig. (3c) | 1828.8 | 965.2 | 152.4 | 3.73 | 1.47 | 63.2 | 287 | 117 | 25.91 | 0.406 | 45 |
| Average | 18.88 | 0.227 |
** γ = 1.65 and ψ = 0.65.
All four tables also show the relative weights and costs of the cross arms modeled.
5. STIFFNESS RATIOS
We propose two (2) ratios here with reference to cross arm strength, stiffness and weight.
| Strength-to-Stiffness Ratio RSS = No. of Load Points * Ultimate P per Load Point / Lateral Flexural Stiffness = (np) (PU)/ kL | (1) |
| Weight-to-Stiffness Ratio RWS = Total Weight of the Arm / Lateral Flexural Stiffness = W / kL | (2) |
The lateral flexural stiffness kL is given by finite element method as 12 EI / L3 where EI is the flexural rigidity of the cross section and L is the length of the element.
Evaluated lateral flexural stiffness of all cases are shown in the tables. The units of both RSS and RWS are 1/mm (1/in).
6. DISCUSSION
As seen in Table 1, average bending stress capacities for composites are 5 to 14 times than those of wood. The modulus of elasticity, E, which controls stiffness and thereby deflections, is about 1.9 to 2.9 times larger for composites than for wood. These two parameters govern the behavioral differences between the two materials.
Tables 2 to 5 show the main differences between wood and composite arms. While the composite arms exhibited larger strength-to-stiffness ratios, there is little difference between the two materials with reference to weight-to-stiffness ratios. However, from deformation point of view, composite arms sustained deflections 4 to 5 times larger than wood arms.
Tables 2 to 5 also show the allowable loads on cross arms computed considering nominal NESC load and strength factors. As expected, composite cross arms showed larger load bearing capacity than wood arms of the same length and configuration.
Cost-wise, composite cross arms are about 2 to 2¼ times costlier than wood arms based on nominal market prices. But, the additional cost is offset by superior load-deflection performance and flexibility while subject to large loads.
| Case Id * | Setup |
Model Length L # (mm) |
x (mm) |
x1 (mm) |
PU (kN) |
PALL (kN) |
Deflection at Free End Δ (mm) |
Lateral Stiffness kL (kN/m) |
Arm Weight W (N) |
Strength-to-Stiffness Ratio RSS (1/mm) |
Weight-to-Stiffness Ratio RWS (1/mm) |
Cost ($) |
|---|---|---|---|---|---|---|---|---|---|---|---|---|
| (1) | (2) | (3) | (4) | (5) | (6) | (7) | (8) | (9) | (10) | (11) | (12) | (13) |
| CD1 | Fig. (3a) | 1219.2 | 1066.8 | 152.4 | 35.58 | 21.57 | 103.5 | 1118.4 | 116 | 31.80 | 0.104 | 56 |
| CD2 | Fig. (3b) | 1524.0 | 482.6 | 152.4 | 22.24 | 13.48 | 152.9 | 572.6 | 147 | 77.62 | 0.256 | 69 |
| CD3 | Fig. (3a) | 1219.2 | 1066.8 | 152.4 | 44.48 | 26.96 | 176.0 | 821.7 | 120 | 54.10 | 0.147 | 56 |
| CD4 | Fig. (3b) | 1524.0 | 482.6 | 152.4 | 26.69 | 16.17 | 249.8 | 420.7 | 151 | 126.80 | 0.358 | 69 |
| CD5 | Fig. (3c) | 1828.8 | 965.2 | 152.4 | 18.68 | 11.32 | 258.9 | 351.7 | 165 | 106.2 | 0.467 | 84 |
| CD6 | Fig. (3a) | 1219.2 | 1066.8 | 152.4 | 65.38 | 39.62 | 145.1 | 1465.3 | 142 | 44.70 | 0.096 | 79 |
| CD7 | Fig. (3b) | 1524.0 | 482.6 | 152.4 | 44.48 | 26.96 | 233.5 | 750.2 | 186.8 | 118.49 | 0.249 | 92 |
| CD8 | Fig. (3c) | 1828.8 | 965.2 | 152.4 | 31.1 | 18.9 | 349.6 | 434.2 | 214 | 143.3 | 0.490 | 118 |
| Average | 87.88 | 0.271 |
CD3, CD4 Beam Series 2000.
CD5 to CD8 Beam Series 2500.
** γ = 1.65 and ψ = 1.00.
# Corresponds to half the total length shown in setup.
CONCLUSION
A total of 25 distribution cross arms made of wood and composites are analyzed. Both tangent and dead end configurations are studied using specially derived load-deflection relationships. Though the study comprised only of a small set of data, the following main conclusions can be drawn.
- Composite arms consistently showed large strength-to-stiffness ratios relative to wood arms. On an average, the RSS ratios of composite arms are over 4 times than those of wood.
- Composite arms sustained deflections 4 to 5 times larger than wood arms at ultimate load levels.
- Composite arms showed larger load carrying capacity than wood arms of similar configurations.
- However, composite arms are more than twice as expensive as wood arms. This additional expense is however offset by their superior performance and flexibility at higher load levels.
LIST OF NOTATIONS
| a | = Diameter of Bolt Hole |
| b | = Width of Cross Section |
| d | = Depth of Cross Section |
| E | = Modulus of Elasticity |
| fr | = Designated Bending Stress for Wood (MOR) |
| I | = Moment of Inertia |
| kL | = Lateral Flexural Stiffness of Beam |
| L | = Length of Cross Arm as Shown |
| Ma | = Applied Moment |
| Ms | = Moment Capacity Based on Designated Bending Stress fr |
| np | = Number of Load Points |
| P | = Load |
| PU | = Ultimate or Maximum Load |
| PALL | = Allowable Load = ψ PU / γ |
| PT | = Test Load |
| RSS | = Strength-to-Stiffness Ratio |
| RWS | = Weight-to-Stiffness Ratio |
| W | = Weight of Cross Arm |
| x, x1 | = Load Point Locations as shown in Figure 4 |
| y | = Distance to Extreme Fiber of Wood Cross Section |
| ∆1-wire | = Deflection of Cross Arm at Free End for One Load Point |
| ∆2-wire | = Deflection of Cross Arm at Free End for Two Load Points |
| ∆T1 | = Test Deflection of Cross Arm at Free End for One Load Point |
| ∆T2 | = Test Deflection of Cross Arm at Free End for Two Load Points |
| γ | = Load Factor for Given Load |
| Ψ | = Strength Reduction Factor for Cross Arm Material |
| η1, η2 | = Parameters as Defined |
CONSENT FOR PUBLICATION
Not applicable.
CONFLICT OF INTEREST
The authors declare no conflict of interest, financial or otherwise.
ACKNOWLEDGEMENTS
The authors wish to acknowledge the assistance of Geotek Inc., of Stewartville, Minnesota during work on this article.
APPENDIX A
Wood Cross Arms - Correlation between Strength and Applied Loads
Referring to Fig. (4a):
Moment at fixed end due to applied loads P = PU:
| Ma = PU * x + PU * (L-x1) = PU * (L+ x - x1) | (A-1) |
Moment capacity based on designated bending stress, fr [9]:
| Ms = fr * (b * d3) / (12 * y) | (A-2) |
Modifying depth ‘d’ to account of bolt hole ‘a’ at the pole-arm connection [6]:
| Ms = fr * b * (d3 – a3) / 6 * d | (A-3) |
Equating the applied moment and ultimate capacity:
| PU * (L+ x - x1) = fr * b * (d3 – a3) / 6 * d | (A-4) |
or
| PU = fr * b * (d3 – a3) / (6 * d)*(L+ x - x1) for 2 wires | (A-5) |
| PU = fr * b * (d3 – a3) / (6 * d)*(L - x1) for 1 wire | (A-6) |
For the single-wire case, only the load at the far end of the cantilever beam is considered.
Deflections
From basic statics, we have deflection at the arm free end as [10]:
| ∆1-wire = PU * (L – x1) 2 * (2L + x1) / (6 * E * I) | (A-7) |
| ∆2-wire = PU * (L – x1) 2 * (2L + x1) / (6 * E * I) + PU * x2 * (3L - x) / (6 * E * I) | (A-8) |
Allowable Load PALL
Recommended strength reduction factor = ψ
| PALL = ψ * PU / Load Factor γ | (A-9) |
Note: Standard bolts used on wood cross arms are 15.88 mm (5/8 in.) in diameter and the corresponding bolt holes are 17.46 mm (11/16 in.).
APPENDIX B
Composite Cross Arms - Correlation between Test Results and Applied Loads
Referring to Fig. (4b) and Appendix A, the deflections at the arm free end in general are:
| ∆1-wire = P * (L – x1) 2 * (2L + x1) / (6 * E * I) | (B-1) |
| ∆2-wire = P * (L – x1) 2 * (2L + x1) / (6 * E * I) + P * x2 * (3L - x) / (6 * E * I) | (B-2) |
Evaluating these deflections with load values PT determined in tests:
| ∆T1 = PT * (L – x1) 2* (2L + x1) / (6 * E * I) | (B-3) |
| ∆T2 = PT * (L – x1) 2* (2L + x1) / (6 * E * I) + PT * x2 * (3L - x) / (6 * E * I) | (B-4) |
or
| ∆T1 = PT * η1 / (6 * E * I) 1-wire | (B-5) |
| ∆T2 = PT * η2 / (6 * E * I) 2-wire | (B-6) |
where:
| η1 = (L – x1) 2 * (2L + x1) | (B-7a) |
| η2 = [(L – x1) 2 * (2L + x1) + x2 * (3L - x)] | (B-7b) |
For the single-wire case, only the load at the far end of the cantilever beam is considered.
Allowable load
Recommended strength reduction factor = ψ
| Allowable Load PALL = ψ * PT / Load Factor γ | (B-8) |

