All published articles of this journal are available on ScienceDirect.
Performance of Cantilever Beam in Fire
Abstract
Introduction:
This paper presents results from an experimental study on the temperature effect of reinforced concrete cantilever beam.
Methods:
Three cantilever beams with fixed end were tested in fire furnace, the distribution of temperature field, the deformation law and the fire resistance of the cantilever beam were obtained.
Results:
Results from these tests indicate that the horizontal section of the temperature curve is about 100 degrees centigrade. The bending capacity of the beam is weaken at high temperature and the failure mode of beam is bending failure. Data from tests also indicates that the plastic hinge of the end of beam moves outward about 240 mm.
1. INTRODUCTION
The reinforced concrete structure is widely used in buildings for its excellent mechanical properties, and buildings are prone to catching fire to some extent. Because of the mechanical properties of cantilever beam, the fire in cantilever structure can cause the collapse of local building and even the collapse of whole building. Therefore, it is essential to study the fire performance on cantilever beam in this paper.
There are limited studies in the literature on the fire performance of the reinforced concrete and current design standard do not have any reference to fire resistance of this type of structure. Some of notable studies relating to fire performance of reinforced concrete structure are reviewed here.
Khoury [1] carried out fire tests on simply supported reinforced concrete beam. The variation of cracks and the deformation law were obtained. Shi Xudong [2] carried out fire tests on 13 reinforced concrete beams. Different loading paths were considered in the test (constant load at high temperature and increasing load at a certain temperature). Data indicates that the variation of fire limit and relationships between strength and curvature are effected by the different loading paths. Wang Chunhua [3] carried out test on mechanical properties of reinforced concrete beamafter being exposed to fire. The bearing capacity is drawn based on different reinforcement ratio in the test.
Sun Jinfeng [4] carried out fire test and mechanical properties test on the reinforced concrete beam. The tested beams were categorized by the time that being exposed to fire (being exposed to fire and after exposure to fire).
The mechanical properties and deformation law are obtained from the test.
The literature review above indicates that there is limited information on the fire response of concrete beam. Most of the previous studies involved undertaking standard fire test on concrete beams to check satisfy fire resistance. This paper is aimed at studying the response of cantilever beam in fire.
2. EXPERIMENTAL PROGRAM
The experimental program comprised of tests on three reinforced concrete beams in fire. The parameters that were tested including reinforcement ratio, load ratio, and the ratio of column pressure.
2.1. Test Specimens
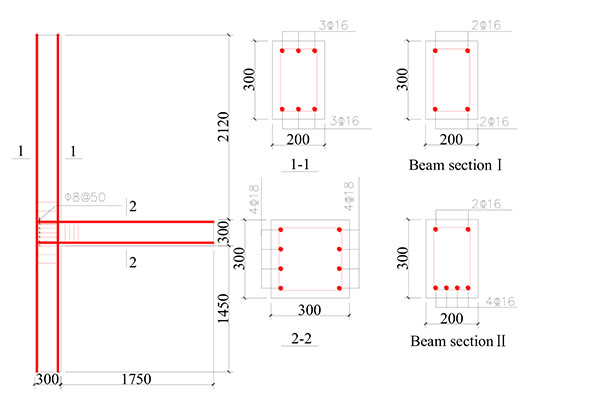
Three cantilever beams were cast from gravel aggregate concrete, named as A1, A2, and A3. These specimens were tested under a constant axial load and were controlled following the ISO-834 heating curve. A summary of specimen characteristic and loading condition is tabulated in Table 1. The design of cantilever beam was as per the Chinese code [5, 6].
| Serial number | Column cross section | Beam section |
Beam Reinforcement |
Column Reinforcement |
Column load N/kN |
Beam load N/kN |
Column Axial compression ratio n |
||||
|---|---|---|---|---|---|---|---|---|---|---|---|
|
B×H (mm×mm) |
H (mm) |
B×H (mm×mm) |
H (mm) |
||||||||
| A1 | 300×300 | 3850 | 190×300 | 3800 | Beam SectionI | Column sectionI | 400 | 28 | 0.3 | ||
| A2 | 300×300 | 3850 | 190×300 | 3800 | Beam sectionII | Column sectionI | 400 | 28 | 0.3 | ||
| A3 | 300×300 | 3850 | 190×300 | 3800 | Beam sectionII | Column sectionI | 666.7 | 28 | 0.5 | ||
2.2. Mechanical Properties
Mechanical properties of all materials were tested in the Structure and Disaster Prevention Laboratory at Shandong Jianzhu University.
A number of 150mm size cube were cast from concrete batch mixtures in order to measure the strength of concrete at day 28 and on the day of test (Table 2). The reinforcement was tabulated in Table 3, as provided by manufacturer, including longitudinal reinforcement and stirrup reinforcement.
2.3. Specimen Casting and Thermocouple Arrangement
In the test, the method of horizontal pouring was applied according to actual situation. The reinforcement bars of the specimens are shown in Fig. (1).
| Item | Block 1 | Block 2 | Block 3 | Mean value |
|---|---|---|---|---|
| Elastic modulus /MPa | 31000 | 32000 | 36000 | 33000 |
| Compressive strength /MPa | 28.5 | 34.9 | 32.3 | 31.9 |
All the specimens were cast in horizontal position using steel mould formwork. The concrete batch mixture was put into the mould in layers and was compacted by an internal poker vibrator. All the specimens were then cured in wet gunny bags and covered with a plastic sheet for 7 days. After 7 days, the specimens were air-cured at room temperature in the laboratory environment until being tested.
| Reinforcement category /mm | Elastic modulus /MPa | Yield strength /MPa |
|---|---|---|
| 22 | 1.99×10⁵ | 484 |
| 16 | 2.05×10⁵ | 452.5 |
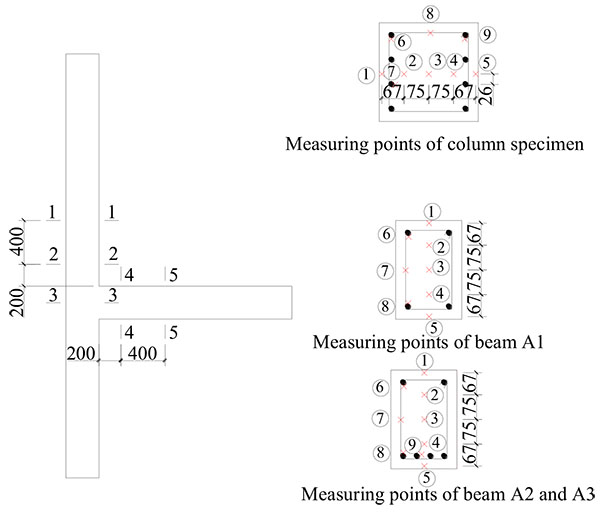
In order to investigate the temperature field distribution of the specimen, the thermocouple was connected with the specimens in advance as shown in Fig. (2). Among all the thermocouples, points 1, 2, 3, 4 and 5 are used to measure concrete temperature; points 6, 7, 8 and 9 are used to measure steel temperature. The electric thermocouples are K-type thermocouples.
2.4. Loading Principle and Failure Criterion
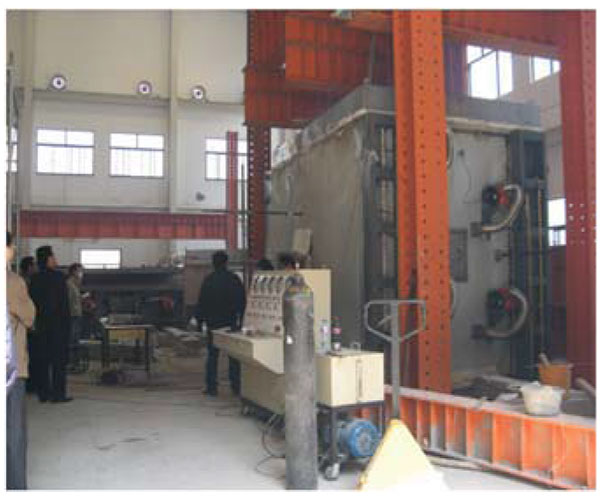
The fire test furnace consists of a steel framework supported by four steel columns and the furnace chamber inside. The test furnace is designed to produce all the needed conditions. The columns were confined with a rigid reinforced groove at the bottom and a rigid angle steel frame at the top. A constant vertical load was applied on the top of the column. The load of A1 and A2 is 400 KN, which is equal to 30% of the ultimate capacity. The load of A3 is 667 KN, which is equal to 50% of the ultimate capacity. The beam end was free and the vertical load (120 KN) is applied in the beam end.
For there is no evaluation criterion of fire resistance test, the test is completed when reached to conditions as following:
- The ultimate bearing capacity of the beam in fire: The maximum deflection of the beam is less than L/10 (L is the beam length of cantilever beam).
- The ultimate bearing capacity of the column in fire: The axial compression reached 0.01H (H is column length) or the axial compression ratio exceed 0.03H (mm/min).
When Column or cantilever beam of specimens A1, A2 and A3 meets one of the criteria above respectively, the test is completed.
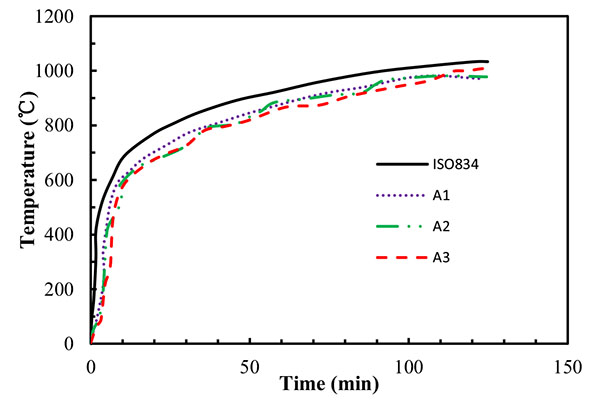
2.5. Temperature Curve in Furnace
The specimens were heated in furnace following the ISO-834 heating curve. The measured curve conforms to the ISO-834 heating curve in Fig. (3).
3. TEST SET-UP
The process of the fire test is as follows:
- The specimen was set into furnace by crane. The upper end of column was fixed by the steel frame, and the lower end of column was fixed by a rigid reinforced groove. They served as simulation hinges of the specimen.
- The specimen was connected with data acquisition instrument by original thermocouple wire outside of the fire furnace. The thermocouple wire in the fire furnace is daubed with a layer of refractory outside, and then wrapped with rock wool about 30mm .The thermocouple was fixed by temporary support to ensure its function in fire.
- The wall and roof of furnace were lifted. And the rock wool was put into furnace.
- In order to eliminate the influence of high temperature on the jack, 100mm rock wool was set on the top of column.
- Displacement meter was set on the top of the column and beam.
- The jack was set on the end of beam and pre-load was done. Firstly the pre-load was done on the top of column and then the pre-load was done on the beam end.
- The temperature in furnace was increased following the ISO-834 heating curve (as shown in Fig. (4)).
- When the deformation of the specimen was reached to the standard of the failure criterion. The test was stopped.

4. RESULTS AND DISCUSSION
4.1. Test Observation and Failure Modes
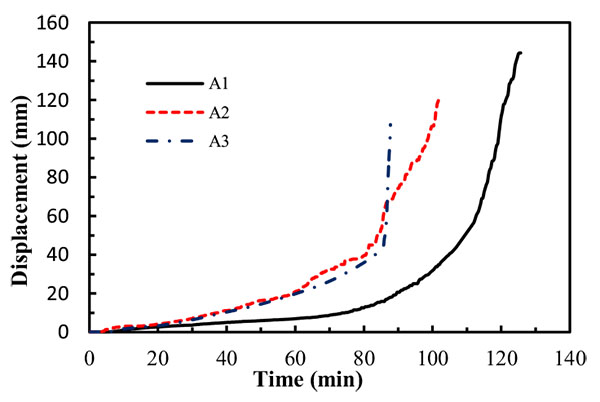
The displacement of the beam end increased slowly at beginning of the test, and the displacement increased rapidly when the specimens were close to the fire resistance limit.
The test observation does not obtain from heating process for the furnace is closed. When the furnace is switched off, the specimens are then allowed to cool down naturally in the furnace. The test observation is shown in Fig. (5).
As shown in Fig. (5) that the bending cracks appear at the bottom of the beam. The cracks are slight different, most of them are bending cracks and a little are shearing cracks.
The longitudinal reinforcement is pulled out and the deformation is obvious.
Fig. (5) shows that the plastic hinge is not produced at the maximum bending moment. It occurs in a certain distance form the edge of the column. The distance of A1, A2 and A3 is 220 mm, 240 mm, 310 mm respectively.
4.2. Temperature Field Distribution of Test-piece Section
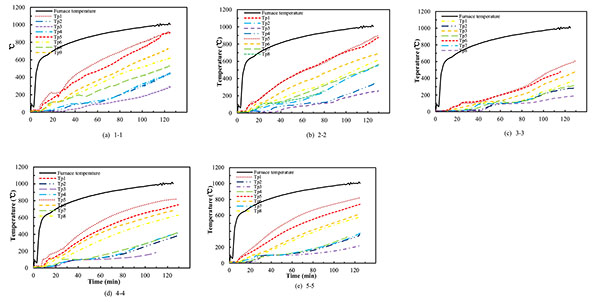
The temperature variation curves of the different point are shown in Fig. (6). The temperature of the measuring points decreases obviously from the lateral section of the cross section to inward direction, which indicates that the thermal conductivity of concrete is poor. The temperature difference between point 1 and point 5 is obvious at the beginning of the heating, and then becomes smaller in the later period, which shows the temperature and heating of the concrete section has hysteresis. The temperature of the 3-3 section is much lower than the other sections. The difference may be caused by the enclosure of the beam and column near the core. Fig. (6) also shows that the temperature of measuring points reaches a plateau near 100 degrees centigrade, because of heat absorption when vapor appears for the moisture in concrete is heated constantly. The temperature of concrete will further increase after the process of water evaporation. The closer to the measuring point of the inside section, the longer the duration of the plateau. Plateau of some measuring points lasts for 30 min, because moisture evaporation of the internal section is relatively slower. The temperature field distribution law of specimen A1 is very similar to the others, so only the specimen A1 is listed in Fig. (7).
5. BEAM END DISPLACEMENT
The displacement-time curve of the specimen is illustrated in Fig. (7). The displacement of the beam increases slowly on the early period of the heating process, and the displacement increases obviously when the test lasts for more than 80 min. The displacement loses load bearing capacity in a relatively short period of time. The destruction of specimen occurs with a sudden.
Fig. (7) shows that the beam end displacement of specimen A2 is almost equal to A3 under the same test condition, and is much larger than that of A1. The displacement of A2 and A3 keeps steady when the test lasts for no more than 60 min, 60 min later it decreases rapidly. And 80 min later, the displacement of A1 decreases rapidly. It can be seen the fire resistant limit of specimen A1, A2 and A3 is 125 min, 102 min and 113 min respectively. For the difference of beam reinforced ratio (A1>A2=A3), the displacement of A1 is larger than that of A2 and A3. Data above indicates that beam displacement of specimen is obviously influenced by beam reinforced ratio.
CONCLUSION
Based on the results presented in this test, the following conclusions can be drawn:
- The section temperature variation has a plateau near 100 centigrade degree. For the relatively slower evaporation of water vapor in the cross section, the plateau of the section temperature variation in the internal cross section is longer than that of the edge section.
- The displacement of the beam end grows slowly in the early stage of the fire. The displacement of the beam increases obviously when the beam is close to the fire limit. The destruction happens with a sudden.
- The bending cracks appear at the bottom of the beam. Most of cracks are bending cracks and a little are shearing cracks.
- The plastic hinge is not produced at the maximum bending moment, and it occurs in a certain distance form the edge of column.
CONSENT FOR PUBLICATION
Not applicable.
CONFLICT OF INTEREST
The authors declare no conflict of interest, financial or otherwise.
ACKNOWLEDGEMENTS
The authors would like to acknowledge the National Science Foundation of China (Grant No: 51378302), the Science and Technology Development of Shandong Province, China (Grant No: 2013GSF12005), the Science and Technology Development Plan of Jinan city, China (the Innovation Plan of Universities and research institutes. Grant No: 201303085), the Research and development program of Shandong Province’s university (Grant No: J11LE06), the Science and Technology project of Housing and Urban Construction Ministry (Grant No: 2013-K2-39).


