All published articles of this journal are available on ScienceDirect.

Numerical Models to Predict the Collapse Behavior of RC Columns and Frames
Abstract
Introduction:
Blind analysis contests for predicting the results of several collapse tests on RC frame structure, were carried out by the Collapse Prevention Committee of Architectural Society of China in 2011. This paper presents the adopted numerical models for the collapse simulations of four RC column tests and one RC frame test.
Methods:
The columns and beams in the RC frame were modeled by beam elements using the fiber model of THUFIBER program. The confined effect of the stirrups in the square RC column was taken into account by using the backbone curve of confined concrete. The methods to determine the key parameters of the adopted model were introduced.
Results and Conclusion:
The prediction results were compared with the test results, and the adopted models exhibited good predictions for the general behavior of both the RC columns and frame. The model was proposed for investigating the collapse mechanism of RC frames.
1. INTRODUCTION
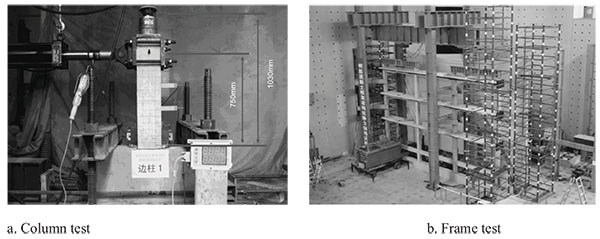
Three blind analysis contests (organized by Collapse Prevention Committee of Architectural Society of China) were carried out in 2011 for predicating the results of several large-scale collapse experiments, including four RC column tests, two beam-to-column connection tests and one three-story three-bay RC frame test [1]. The photos for the column test and frame test are shown in Fig. (1). Reduced-scale specimens are used in these tests. The column in Fig. (1a) had a section of 200 mm by 200 mm, and a length of 850 mm. The first author from Institute of Engineering Mechanics participated in these blind analysis contests, and achieved reasonable predictions for the RC column tests (Ranked No.1 out of 22 teams) and RC frame test (Ranked No.4 out of 30 teams) by using the fiber model provided by THUFIBER program [2]. In this paper, the details of the adopted model and the methods to determine the key parameters are introduced, and the performance of the model is evaluated by comparing the results from the simulations and laboratory tests.
2. NUMERICAL MODELS
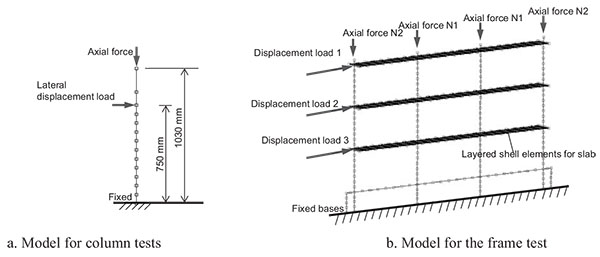
Fig. (2) shows the models for the simulations of the column test Fig. (1a) and frame test Fig. (1b), respectively. For the column test, the column was modeled by beam elements using a fiber model provided by THUFIBER program [2]. The bottom of the column was assumed to be completely fixed, and P-delta effect due to large deformation was taken into account. Four column specimens, two side columns and two middle columns, were simulated. For the frame test, the same column model was used for the columns and beams in the frame, and layered shell elements was used to simulate the slab. The slab was divided into ten layers. The second and the ninth layers were steel layers with a section area that was equivalent to the total area of the steel reinforcements in the slab. The axial forces were exerted on the top ends of the columns, and the lateral displacement loads were set to the slab of each story. All the models were run through the platform of the finite element software MSC.Marc 2005. The details of the tests can be obtained from the official website of Collapse Prevention Committee of Architectural Society of China (http://www.collapse-prevention.net). The details of the fiber model in THUFIBER program and its material properties will be introduced as follows.
2.1. Fiber Model in THUFIBER
The THUFIBER program consists of a series of user subroutines to realise a fiber model for RC members, and is implemented by integrating the user subroutines into the finite element software MSC.Marc 2005. Fig. (3) shows the standard section for the fiber model used in the simulation. The standard section is built up of eight steel reinforcement fibers and sixty-four concrete fibers, among which twenty-eight fibers are for the cover concrete and thirty-six fibers are for the confined concrete in the center area. To generalize the section to various types of reinforcement arrangements, the cross-sectional area of each reinforcement fiber can be either an equivalent area of several reinforcements or zero.
2.2. Material Model
Fiber model can simulate the column behavior subjected to combined bending and compression by assuming that plane sections remain plane, and giving uniaxial material properties to each fiber in the section. The performance of the model mainly depends on the uniaxial stress-strain relationship adopted for the fibers. Fig. (4) shows the uniaxial stress-strain relationship for the steel reinforcement in THUFIBER program. The model was developed by Wang et al. [2] based on Légeron model [3], and is able to simulate the behavior of yielding, hardening, softening and Bauschinger’s effect of the steel. The model matches well with the results from the material tests [3].
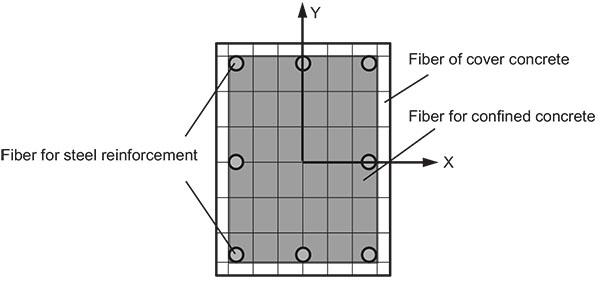
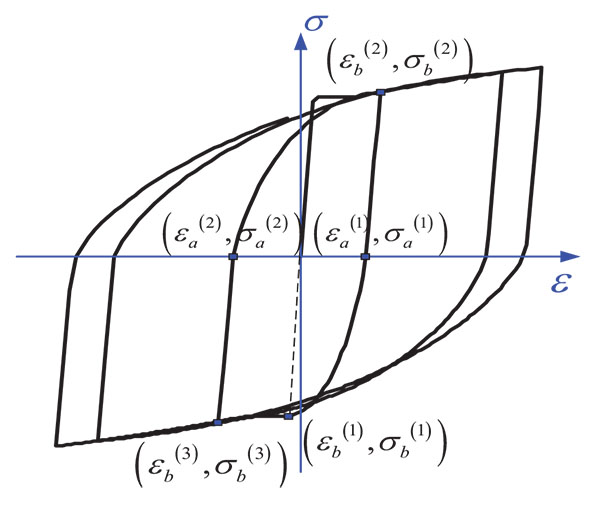
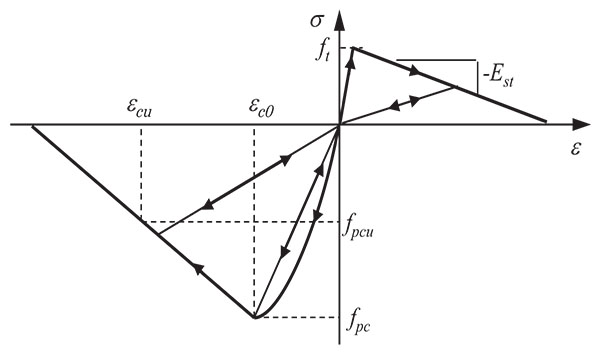
Fig. (5) shows the stress-strain relationship for the concrete fibers. The compressive backbone curve consists of two portions, a parabolic curve to the peak compressive stress of the concrete and a straight line with negative stiffness after the peak stress. The tensile backbone curve is a bilinear curve. One line uses initial stiffness of the material, and the other line uses a negative stiffness with an absolute value equalling to one tenth of the initial stiffness. To keep the model as simple as possible, the reversed origin-oriented model, which is the simplest cyclic concrete model in THUFIBER, was adopted for all the concrete fibers, cover concrete or confined concrete. In this origin-oriented model, the unloading is always on a straight line from the unloading point to the origin, while the loading is first on a straight line to the maximum experienced point, and then on the backbone curve. The peak tensile stress ft is simply set to one tenth of the compressive peak stress fpc.
2.3. Parameters for Material Model
The compressive stress of the concrete, and the yield stress, yield strain, maximum stress and rupture elongation of steel reinforcements with various diameters can be obtained from the official website. The backbone curve of the longitudinal reinforcement can be established from the material test results directly, while that of the confined concrete cannot. Since the cover concrete can be regarded as a special case of the confined concrete, only the parameters for confined concrete are introduced. To take the confinement effect of stirrups into account, the compressive backbone curve of confined concrete, which was proposed by Guo & Shi [1], was used for determining the parameters of the concrete model in Fig. (5). The confinement effect of stirrups for square RC column is expressed by the confinement factor,
 |
(1) |
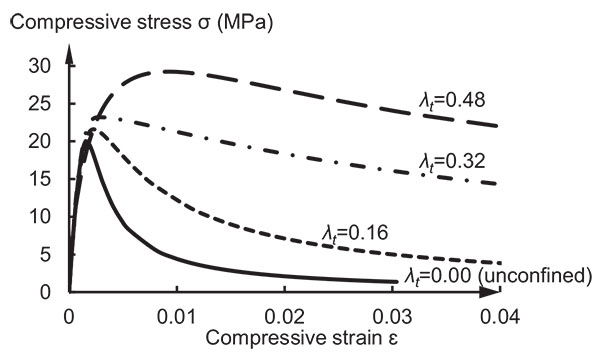
where μt is the volume ratio of stirrups, fyt is the yield stress of the stirrups, and fc is the compressive strength of the concrete. The peak stress and its corresponding strain become larger as the confinement factor increases, and the details of the backbone curve taking account of confinement effect are shown in Table 1. εp, εpc are the strains at peak compressive stress of the unconfined concrete and confined concrete, respectively, and fc,c is the peak stress (or called as compressive strength) of the confined concrete. αa,c, αa,d are shape coefficients of the curve functions for confined concrete, and can be computed by αa,c= (1+1.8λt) αa and αd,c= (1-1.75λt0.55) αd. αa,c, αa,d are shape coefficients of the curve functions for unconfined concrete, and their values vary with the strength of concrete and are listed in the reference [4]. As an illustration, the compressive stress-strain relationships for concrete under various confinement factors are shown in Fig. (6).
| Confinement Factor | λt≤0.32 | λt>0.32 |
|---|---|---|
| Peak stress | fc,c=(1+0.5λt)fc | fc,c=(0.55+1.9λt)fc |
| Strain at peak stress | εpc=(1+2.5λt)εp | εpc=(-6.2+25λt)εp |
| Curve functions x=ε/εpc y=σ/fc,c |
y=αa,cx+(3-2αa,c)x2+(αa,c-2)x3(x≤1.0)y=x/(αd,c(x-1)2+x)(x>1.0) | 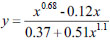 |
The effect of confinement on the compressive strength and ductility of concrete can be very significant, and has to be well estimated in the simulation as shown in Fig. (6)
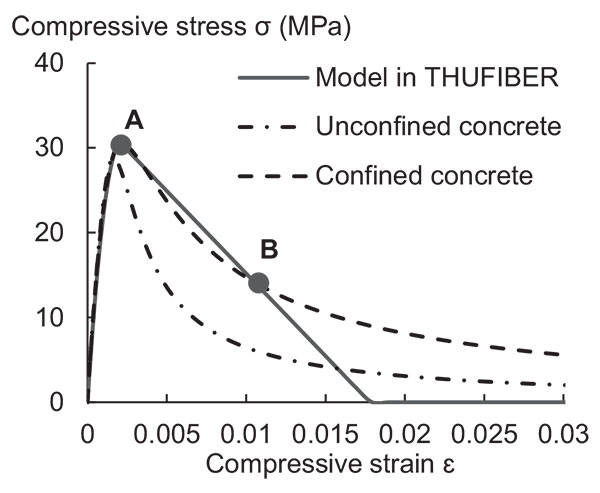
Although Guo’s backbone curve of confined concrete cannot be used directly in the model, two points on the curve, one at the peak stress of the curve and the other at the 50% stress reduction from the peak stress, were adopted to determine the entire stress-strain relationship of the concrete fibers in Fig. (5). Fig. (7) shows the backbone curves for the side column in the second floor of the tested frame. The dashed and dot-dashed lines indicate the Guo’s backbone curves for confined concrete and unconfined concrete, respectively, and the solid line indicates the backbone curve for the confined concrete fibers in the model, which was determined by Points A and B. Although the backbone curve used in THUFIBER is simple, it represents Guo’s curve reasonably well up to Point B.
3. SIMULATION RESULTS
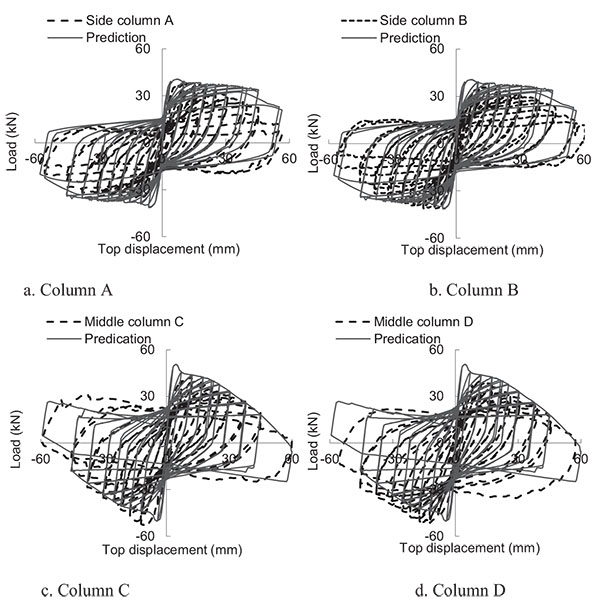
Four column specimens were tested, denoted as Columns A, B, C and D. Columns B and D were backup specimens used to repeat tests for Columns A and C. Column A is the side column in the prototype frame, sustaining an axial load of 149.8 kN, while Column C is the middle column sustaining a much large axial load of 256.3 kN. The load-displacement relationships for all the specimens from both the simulations and experiments are shown in Fig. (8). The solid lines denoted as Prediction indicate the simulation results, and the dashed lines indicate the corresponding test results. The general behavior from the prediction matched well with the test results throughout the entire cyclic loading. The model well traced the details of the unloading-reloading process and the deterioration of the strength as the loading displacement increases. The middle columns sustained a much larger axial force, and its strength decreased much faster than the side columns under large cycles due to P-delta effect, which was also well simulated by the model. Two limitations can be found from the comparisons. First, the simulation exhibited larger stiffness before reaching the maximum load than the experimental results. Second, the model cannot represent the strength deterioration when the same loading cycle was repeated.
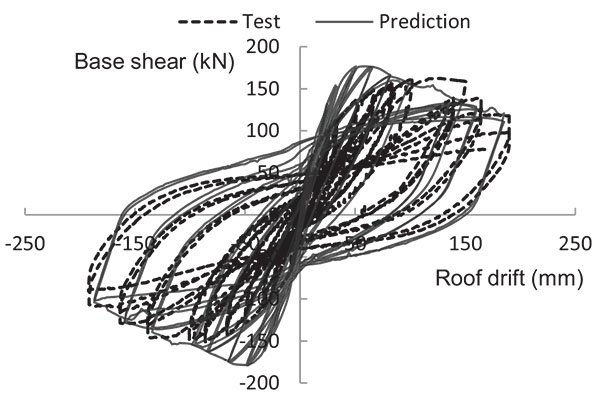
The same fiber model was applied to simulate the frame test. Fig. (9) shows the base shear-roof drift relationships for both the test and simulation. Although the two limitations mentioned in the column simulation can be observed in the frame model to some extent, the simulation results predicted the frame behavior under cyclic loading reasonably well. The adopted model provided reasonable and reliable simulations for both columns with different axial forces and the entire RC frame, and therefore was proposed as a numerical tool for investigating the collapse mechanism of RC frames.
CONCLUSION
The paper presents the numerical prediction models and their simulation results for the collapse tests of four RC columns and one RC frame. The models were constructed using the fiber model in THUFIBER program, and the details of the material behavior were introduced. The confined effect of the stirrups in the square RC column was taken into account by using Guo’s backbone curve of confined concrete. The comparison between the predictions and test results showed that the adopted fiber model exhibited reasonable and reliable predictions for both the columns with different axial forces and the entire RC frame. The model can be used for investigating the collapse mechanism of RC frames.
CONSENT FOR PUBLICATION
Not applicable.
CONFLICT OF INTEREST
The author(s) confirm that this article content has no conflicts of interest.
ACKNOWLEDGEMENTS
The research is supported by China Earthquake Administration (Grant No. 201508023), National Natural Science Foundation of China (Grant No. 51408562) and Natural Science Foundation of Heilongjiang (Grant No.E2015067).
The authors gratefully acknowledge the experimental data provided by Collapse Prevention Committee of Architectural Society of China.

