All published articles of this journal are available on ScienceDirect.
Fastener Scaffold Stability Analysis and Experimental Research Under Non-Uniform Distributed Load
Abstract
Introduction:
An experiment was carried out on the basis of material nonlinearity, geometry nonlinearity and semi rigid fasteners for the internal force distribution and transfer rules of the scaffold.
Methods:
This paper presents results from a set of numerical studies on the influence of the random imperfection method, the interaction of various imperfections and the most disadvantageous stability limit load.
Result and Conclusion:
Data from numerical studies indicate that stress at the top of the vertical bar was larger within the scope of load; and the horizontal bar and brace participated in the work of the scaffold. The internal force that came through the two types of bars enabled us to realize the redistribution in every vertical bar in order to decrease the stress from the top to the bottom of the vertical bars and involve them in the work of the scaffold. Data from numerical studies also indicates that these imperfections all interact with each other and the load distribution also influences the scaffold’s stability.
1. INTRODUCTION
A fastener scaffold is a type of supporting system with convenient installation and easy transportation. With the increase of Chinese urbanization strategies, the use of this type of scaffold has increased dramatically; however, its collapse also occurs frequently during the construction stage. Scaffold collapse accidents belong to the major hazards to the project builders [1], so this accident should carry great importance.
A fastener scaffold is a framed structure sensitive to imperfections as a result of deformation, wear and the corrosion of steel tubes and fasteners [2]. There are currently many studies regarding its stability, both in China and abroad, but most of the achievements have focused on the influence of shelf stability regarding semi-rigid fasteners and the space between steel tubes [3-5]. There were fewer studies on imperfect scaffold stability, and they focused largely on uniform distributed loads and the single imperfection effects on the stability of the frame [6-8]. There are fewer studies that examine the scaffold with the interaction of various imperfections under non-uniform distributed loads. Fastener scaffold imperfections include early bending, differing diameters and steel tube thickness, fastener tightening torque and the erection deviation. These imperfections are randomly distributed in actual applications [9].

Therefore, according to the above scenarios, the following research was performed.
- An experiment was developed to examine fastener scaffolds under non-uniform distributed loads; the internal force transmission and the distribution rules about scaffold were studied and the finite element software ANSYS was used to simulate the experiment.
- According to the specifications [10], using ANSYS, we established an 8×8×6 full hall scaffold; the internal force transmission and distribution rules for the scaffold were studied under different non-uniform distributed loads.
- The scaffold stability of three different erection deviations was studied using the Monte Carlo random sampling method (i.e. random imperfection method); the most unfavorable erection deviation form was found.
- On the basis of the above research, using the consistent imperfection method combined with the actual sizes and various interacting imperfections, the stable limit load was analyzed, and using the random imperfection method, the reliability of this load for minimum stable limit load was found.
2. SCAFFOLD EXPERIMENT
2.1. Experiment Program
2.1.1. Scaffold Build-up Program:
The scaffold build-up form is as shown in Fig. (1). The total size was 2850 mm×2850 mm×4000 mm; The space between the vertical bars was 950 mm; the space between the horizontal bars was 1300 mm; the braces were set on both directions of the scaffold, and the horizontal space between the bottom bar and the ground was 100 mm.
The scaffold was made up of 50 steel tubes; the measurement of the outside diameter of an average steel tube was R = 24.159 mm and the inner diameter average was r = 20.855 mm; the yield strength average was fy=235MPa, the Poisson ratio was µ = 0.3. All fasteners used torque wrench fastening with a tightening torque of 40 N·m.
2.2. Testing Load
2.2.1. Loading Equipment:
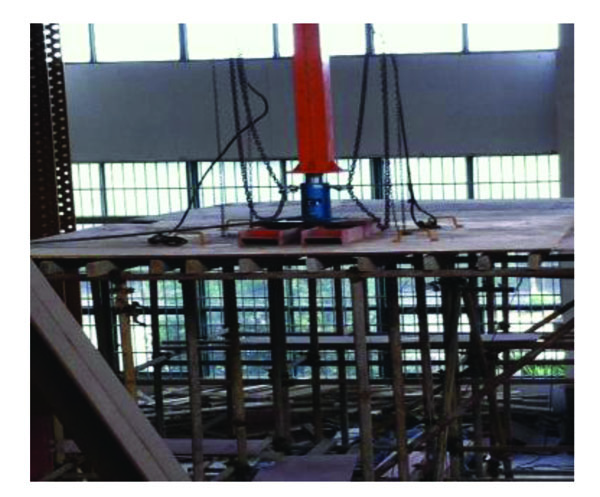
In order to achieve the non-uniform distributed load, the test load was performed as shown in Fig. (2). Methods of force transmission: hydraulic jack→ flanged beam→ steel plate→ wood template→ batten→ horizontal bar, and hydraulic jack were located in the loading surface center of the scaffold.
2.2.2. Loading Program:
The loading program for the test is shown in Table 1.
| Serial Number |
Each Stage Load (KN) |
Cumulative Load By Jack(KN) |
|---|---|---|
| 1 | 8.732 | 8.732 |
| 2 | 4.061 | 12.793 |
| 3 | 8.123 | 20.916 |
| 4 | 8.123 | 29.039 |
| 5 | 8.123 | 37.162 |
| 6 | 8.123 | 45.285 |
| 7 | 8.123 | 53.408 |
| 8 | 8.123 | 61.531 |
| 9 | 8.123 | 69.654 |
| 10 | 8.123 | 77.777 |
| 11 | 8.123 | 85.9 |
| 12 | 8.123 | 94.023 |
| 13 | 8.123 | 102.146 |
| 14 | 8.123 | 110.269 |
| 15 | 8.123 | 118.392 |
| 16 | 8.123 | 126.515 |
| 17 | 8.123 | 134.638 |
The test steps were divided into a preload step and a formal load step. The aim of the preload was to determine whether the measuring instrument would work normally. After the preload the formal load commenced. The load was divided into several levels and every level was sustained 15 min in order to maintain the scaffold’s mechanical stability.
2.3. Measuring Equipment and Arrangement of Measuring Points
2.3.1. Measuring equipment:
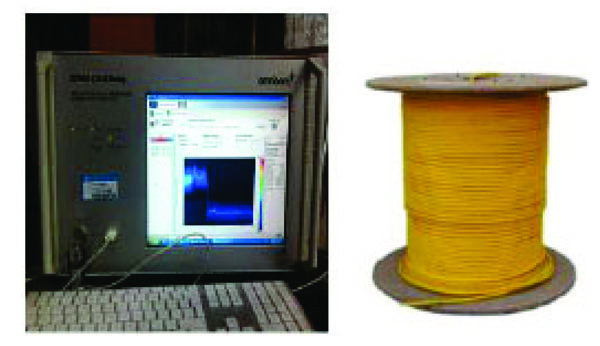
The experiment’s method of stress measurement used a distributed optical fiber (BOTDA) system in order to accurately find the data for force transmission and distribution. The instruments were ordinary single mode optical fibers and an optical fiber data acquisition device, as shown in Fig. (3). Using this equipment, we obtained the data for the area covered by optical fibers. The displacement measurement of the scaffold used the HYD-200 displacement meter.
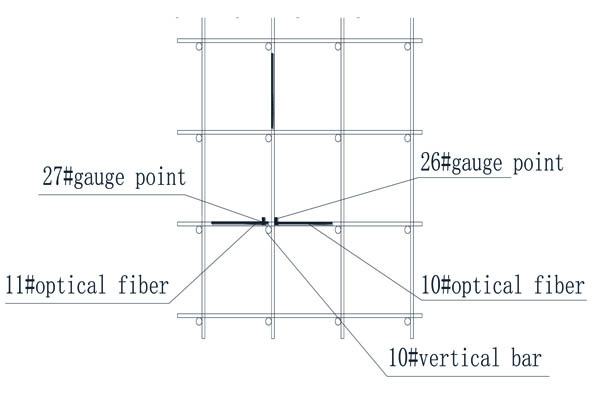
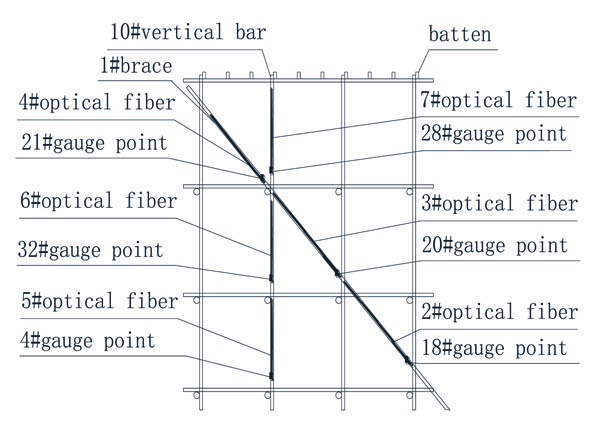
Optical fiber laying and monitoring point arrangement: Optical fiber lying as shown in Figs. (4 and 5).
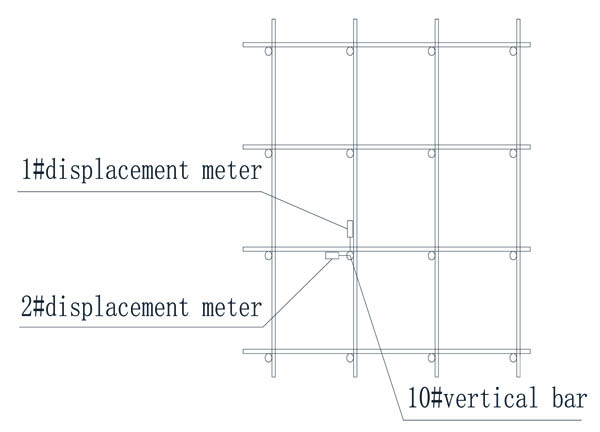
The displacement meter was placed on top of the 10th vertical bar in the third layer. Arrangement is shown in Fig. (6).
2.4. Fasteners Torsion Test
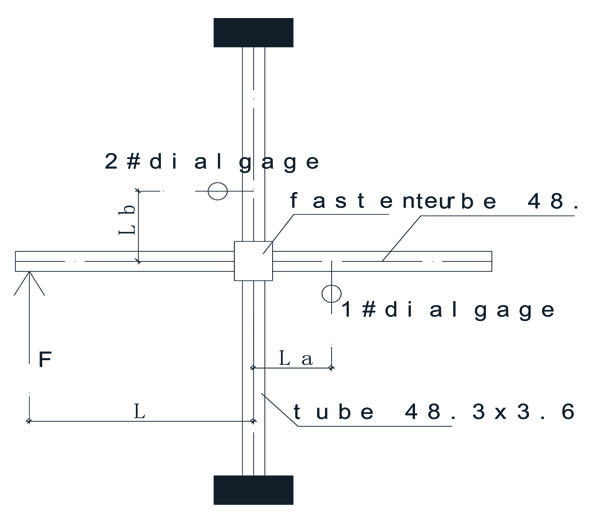
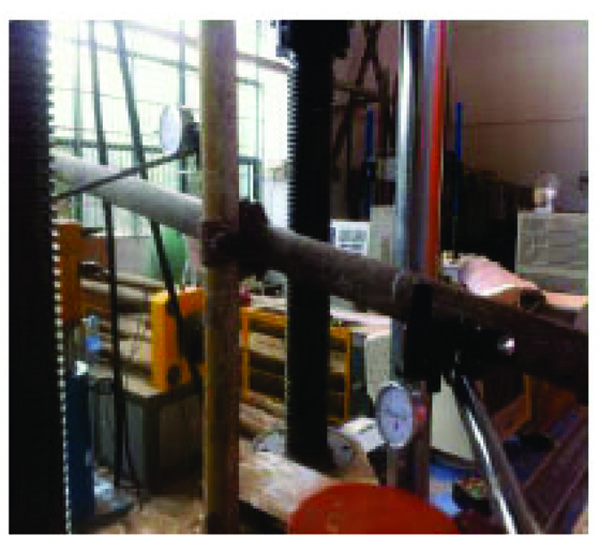
In essence, the fastener is a type of semi-rigid connection [8]. Therefore, it was important that we confirmed its M vs θ. relation curve. The test for the fastener with torsion 40 N·m was performed, using a hydraulic universal testing machine to fix the vertical bar and a hydraulic jack to load the horizon bar. Every load step was 0.1 KN. The displacement meter was placed on the horizon and vertical bars, as shown in Figs. (7 and 8) where L = 1000 mm, La = Lb = 200 mm. In this paper, four groups of tests were carried out; the average test data can be found in Table 2.
| Fastener Tightening Torque Values 40N·m | |||
|---|---|---|---|
| Bending Moment(kN·m) | Sa(mm) | Sb(mm) | θ(rad) |
| 0.1 | 1.370 | 0.732 | 0.003 |
| 0.2 | 2.297 | 0.874 | 0.007 |
| 0.3 | 2.988 | 1.011 | 0.010 |
| 0.4 | 4.147 | 1.246 | 0.015 |
| 0.5 | 6.106 | 1.484 | 0.023 |
| 0.6 | 7.797 | 1.592 | 0.031 |
| 0.7 | 10.297 | 1.632 | 0.043 |
| 0.8 | 15.297 | 1.832 | 0.067 |
| 0.90 | 21.297 | 2.732 | 0.093 |
2.5. Experimental Result and Simulation Analysis
2.5.1. Experimental Results:
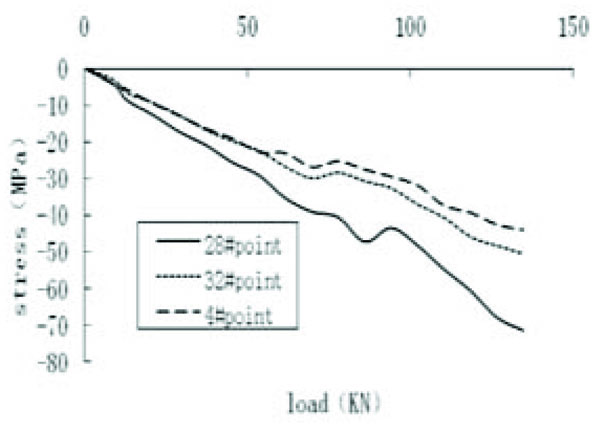
As seen in Fig. (9), we found a rough linear relation curve of load vs. the stress on the upper, middle, and lower parts of 10th vertical bar. The stress decreased from the top to the bottom of the 10th vertical bar. The reason for this phenomenon was that the horizontal bars and the brace transferred force in the 10th vertical bar to the other vertical bars to result in a stress decrease from top to bottom in 10th vertical bar.
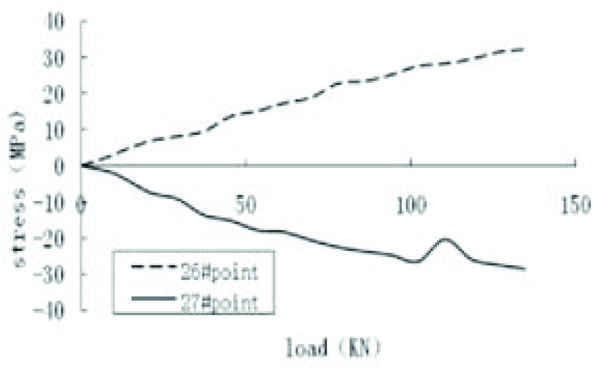
The 26 gauge point and the 27 gauge point belonged to the same horizontal bar but were located on opposite sides of 10th vertical bar, as shown Fig. (4). Given Fig. (10), we can see the relationship between stress and external load was a somewhat linear one. Meanwhile, the stress was roughly equal to the size, but in the opposite direction. This was due to bending deformation caused by the force on the 10th vertical bar.
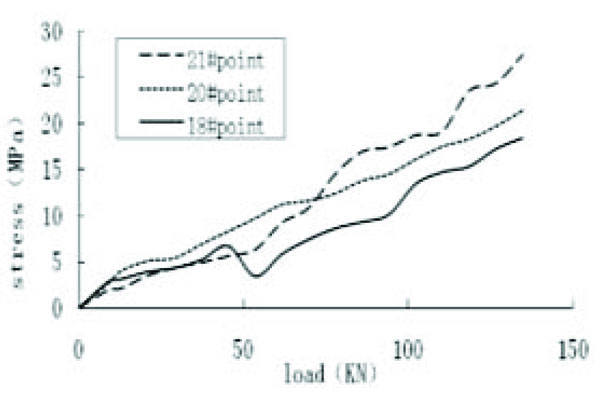
As seen in Fig. (11), the relationship between the stress of the brace and the external load was roughly linear, and the stress on the top, middle, and bottom of the brace were approximately equal. Therefore, it was feasible that the brace was the axial force bar.
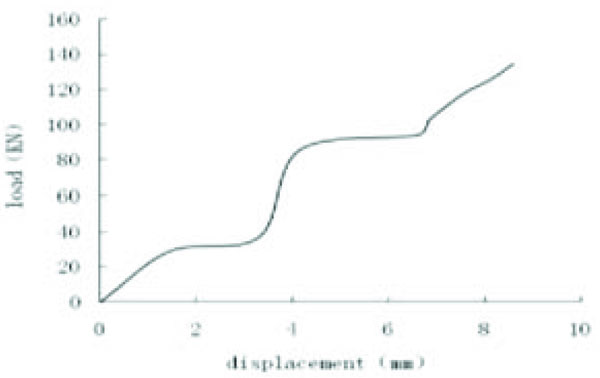
Total displacement is the sum of the displacement from the first and second displacement meters. As shown in Fig. (12), although the load-displacement curve fluctuated, the trend of curve presented a linear change.
To summarize, the rules of internal force transmission and the distribution of the scaffold under a non-uniform distributed load: the stress on the top of the vertical bar was larger within the scope of the load; the horizontal bar and brace participated in the work of the scaffold; the internal force went through the two types of bars to realize redistribution in every vertical bar in order to decrease the stress from the top to the bottom of the vertical bar and involve them in the stress of the scaffold.
2.5.2. Numerical Simulation Comparison:
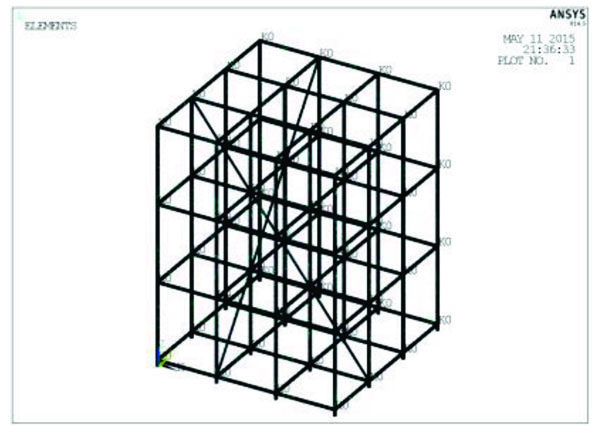
In this paper, the finite element software ANSYS was used to simulate the experiment. We used BEAM188 to simulate the vertical and horizontal bars, LINK8 to simulate the brace and COMBIN39 to simulate the semi-rigid fastener, while considering the material nonlinear and geometric nonlinear characteristics of the scaffold. The finite element model is shown in Fig. (13).
In Fig. (14), it is evident the numerical simulation stress and test stress were much the same.
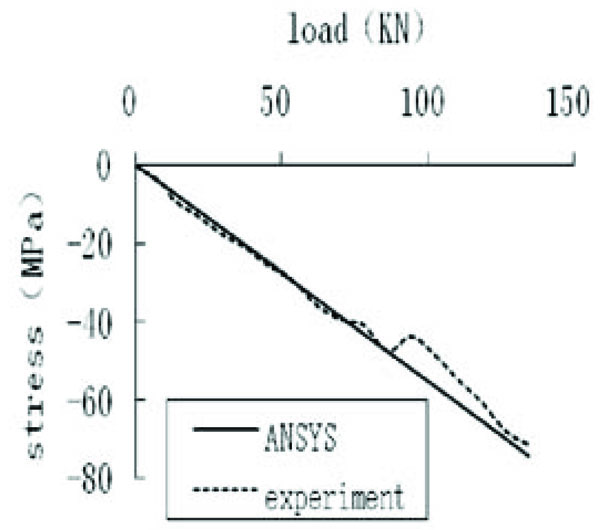
In Fig. (15) we can see the numerical simulation displacement and test displacement are the same overall.
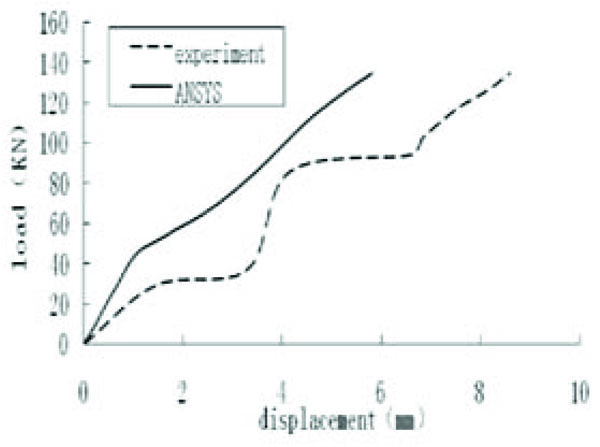
The finite element software ANSYS could be used to accurately simulate the scaffold’s mechanical properties. It proved that the finite element analysis method and strategy in this paper are feasible.
3. IMPERFECT STABILITY ANALYSIS
3.1. Numerical Models
In order to more fully reflect the scaffold’s imperfect stability, a numerical model by ANSYS was established as follows: the model style was 8×8×6, the space between the vertical bars was 1200 mm, the space between the horizontal bars was 1700 mm, the space from the bottom horizontal bar to the ground was 200 mm, the layout of the brace by specifications found in [10], the steel tube size was 48×3.5 mm, the elastic modulus was 2.06 ×10⁵ MPa, the yield strength was 205 MPa, the Poisson ratio was 0.3, the ideal elastic-plastic material, was in accordance with the experiment in this paper and the literature [11], the M-θ formula of the fastener:
| M=0.85×(-1.7816×exp(-θ/(0.0257-0.112T))+1.7529) | (1) |
where:
T: Fastener tightening torque (N·m), 40 N·m in this paper.
M: Bending moment of fastener (KN·m).
θ : Corner of fastener (rad)
We used BEAM188 to simulate the vertical and horizontal bars, LINK8 to simulate the brace and COMBIN39 to simulate the semi-rigid fastener, while we considered the material nonlinear and geometric nonlinear qualities of the scaffold. The finite element model is as shown in Fig. (16).
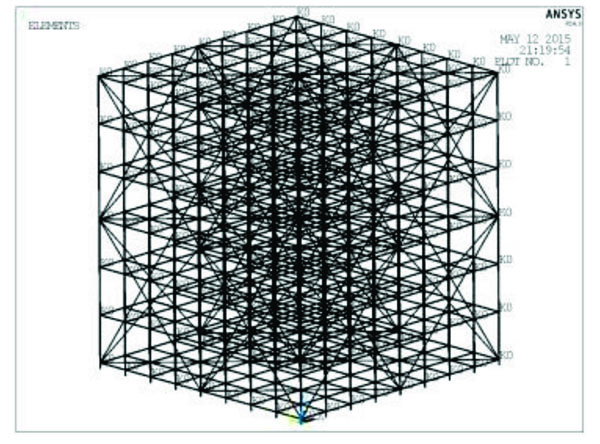
3.2. Stability of Scaffold Under Non-Uniform Load
3.2.1. Non-uniform load:
In practical engineering, due to different methods of pouring concrete, the scaffold supported a non-uniform distributed load in many cases. Four types of non-uniform distributed loads were adopted in the paper, as shown in Fig. (17).
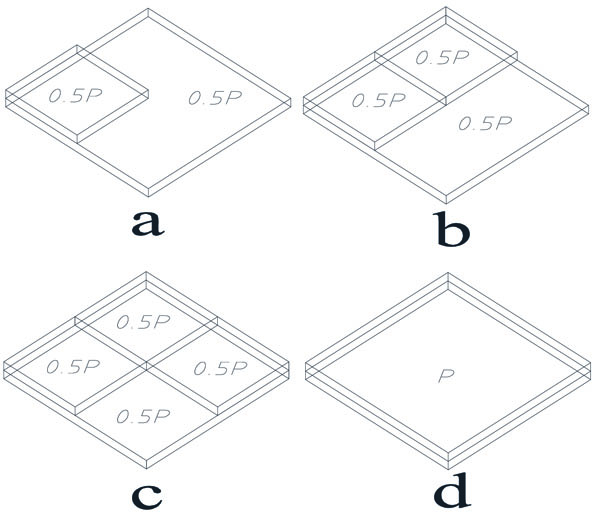
3.2.2. Load >vs. displacement curve under different non-uniform distributed loads:
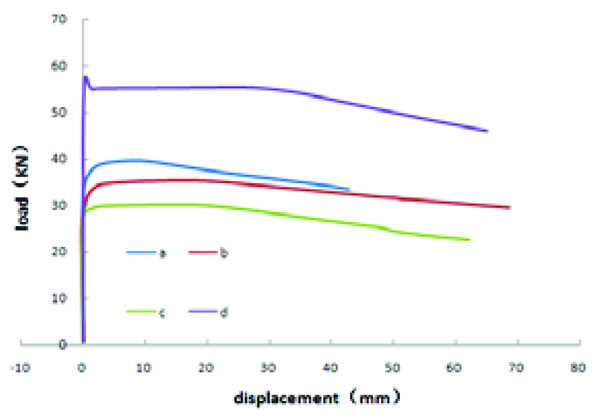
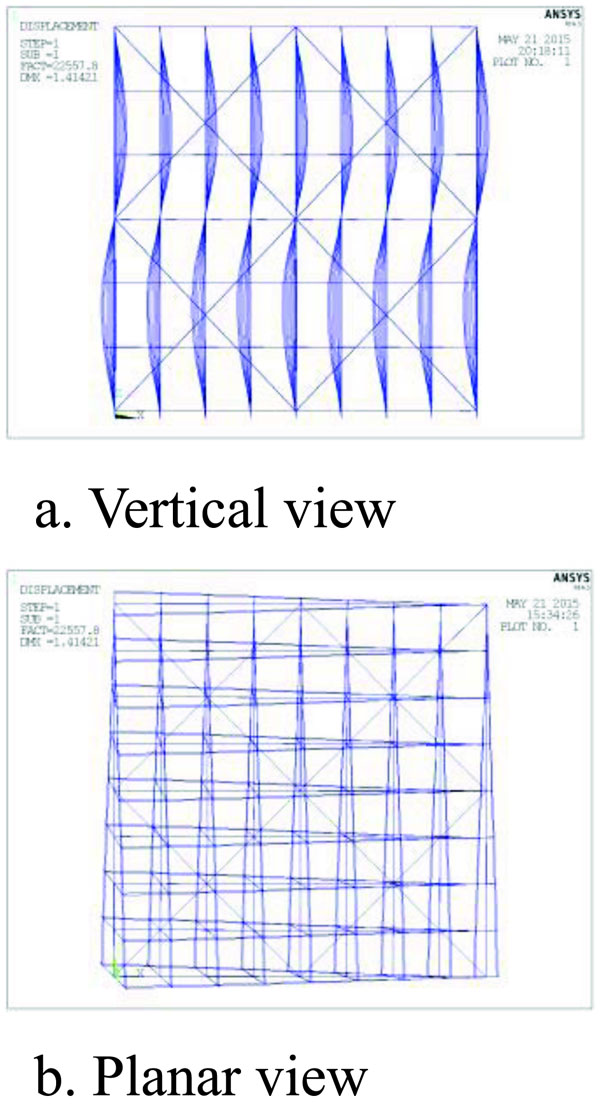
Fig. (18) showed the load-displacement curves of the maximum displacement node in the scaffold under four types of non-uniform loads. In the early load stages scaffold deformation was small; along with an increase in load, the deformation showed no obvious increase until the scaffold was already unstable. After this instability the deformation quickly increased. As far as the four types of loads were concerned, the ultimate load order from big to small was d, a, b and c. Compared with d, the ultimate load for c decreased about 45%. Thus it can be seen that non-uniform distributed loads influenced the stability of the scaffold. The unstable deformation under c is shown in Fig. (19).
3.2.3. The most unfavorable erection deviation form of node:
Based on the applied characteristics (repeatability, manual setting, etc.), the scaffold inevitably had erection deviations in the node. In this paper, according to the consistent imperfection method, three types of erection deviation were adopted to find the ultimate stable load. By comparing them we obtained the most unfavorable erection deviation form and compared it with the random imperfection method to find a reliable minimum limit load.
The numerical model was shown in section 3.1 and the non-uniform distributed load was shown in Fig. (17c). Based on the literature [12], three types of erection deviation forms are: 1. The first Eigenvalue buckling mode; 2. The precise buckling mode; 3. The nonlinear buckling mode, shown in Fig. (19). Maximum deviation of node was 20 mm [10].
From Figs. (19 to 21), in all three erection deviation forms, the vertical bars presented wavy deformations and the frame had varying torsion deformation. Of them all, the deformation form of the precise buckling mode and the nonlinear buckling form were similar when the torsion deformation of the Eigenvalue buckling form was more obvious than others.
The load-displacement curve of three types of deviation is shown in Fig. (22).
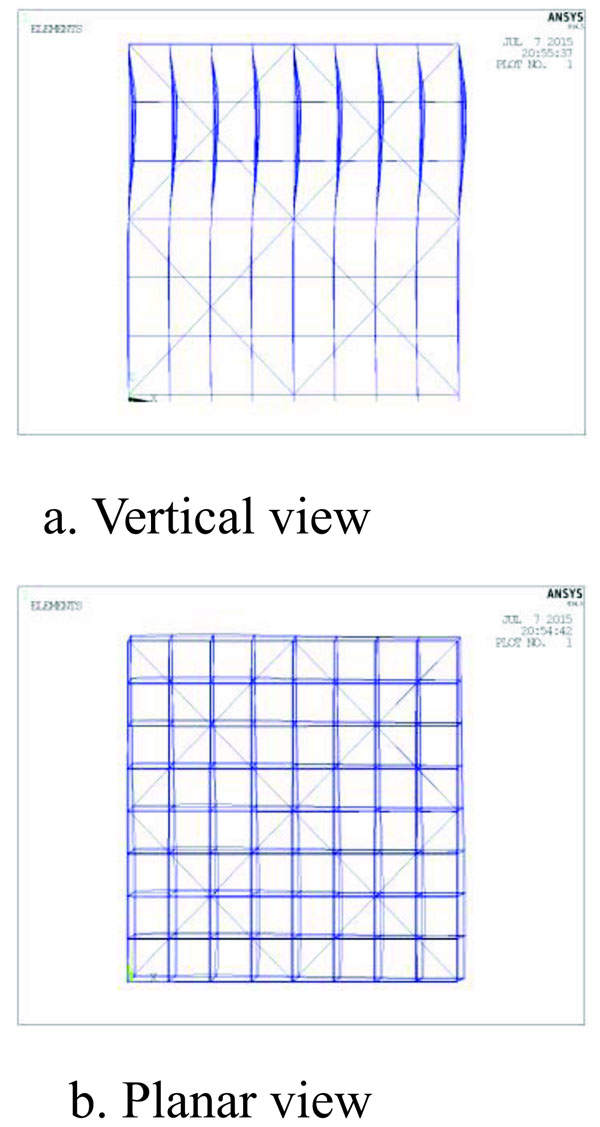
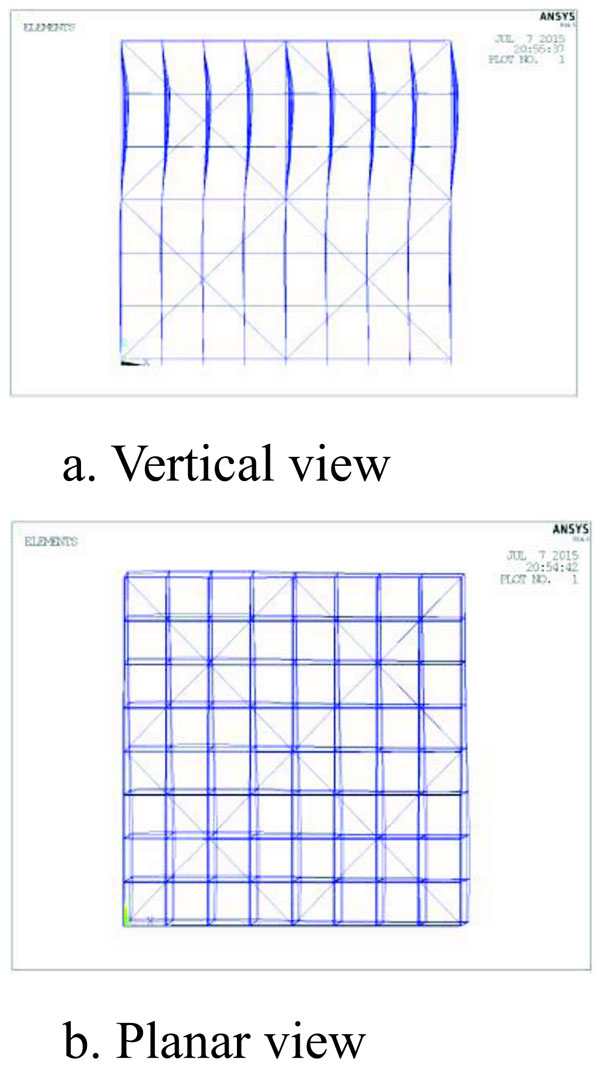
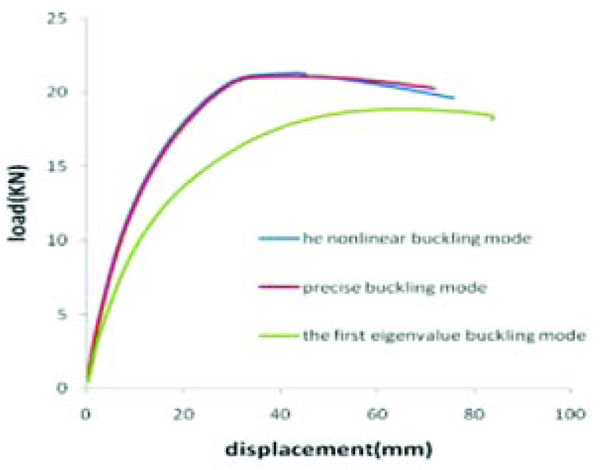
From Figs. (19 to 22), the load-displacement of the precise buckling mode and the nonlinear buckling mode were similar. When using the first Eigenvalue buckling mode as the erection deviation, the stable capacity of the scaffold was its minimum. The reason for this phenomenon is that the torsion deformation of the Eigenvalue buckling form was greater than the other two modes.
In order to further verify the idea that the stable capacity was at its minimum when using the first Eigenvalue buckling mode as a deviation, the random imperfection method was adopted to analyze the stable capacity of the scaffold. The erection deviation of the node was assumed to be a normal distribution [9] and its value was 20mm [10]. The sample number was 200.
Fig. (23) shows the use of the first Eigenvalue buckling mode to simulate the erection deviation; the probability reliability for the minimum capacity was 100%.
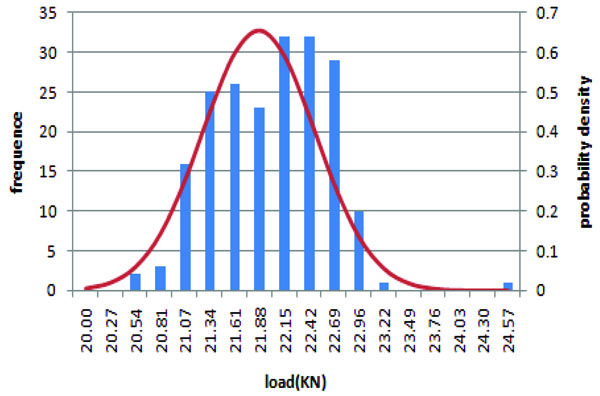
To summarize, when comparing Figs. (18 with 22), we can conclude that the existence of the erection deviation reduced the stiffness of scaffold; additionally, if the scaffold had its initial torsion, given the initial bending of the steel tube, its stability would be more unfavorable, and if the erection deviation was similar to the first Eigenvalue buckling mode, the capacity would be at its minimum.
3.3. Stability of various interacting imperfection
In practical engineering, the scaffold has all kinds of imperfections, such as erection deviation, initial tube bending, tube diameter deviations, tube thickness deviations and deviations in the tightening torque of the fasteners. These imperfections are random and interact.
Therefore, based on the research in section 3.2, we considered all of these imperfections to analyze the scaffold’s stability and compare the results with those from the random imperfection method.
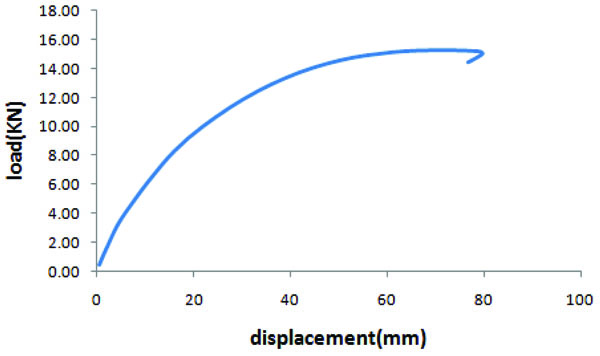
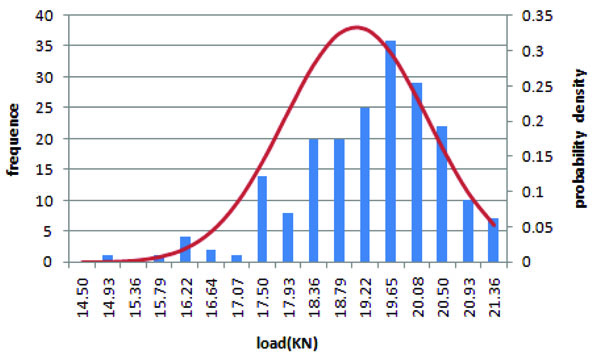
The numerical model was same as in section 3.1; all kinds of imperfections accorded with the normal distribution [9, 13]. The sample number was 200, and the loading method was as shown in Fig. (17c). Combined with the experiment data and the related literature in this paper [2, 13], the actual imperfections data are as shown in Table 3.
With consideration to the various interacting imperfections in order to find the minimum value for Table 3 and using the consistent imperfection method, the load-displacement curve is as shown in Fig. (24), with a stable capacity of 15.2 KN. Compared with the random imperfection method as shown Fig. (25), the probability of minimum stable capacity was 99.35%, which is very high.
| Variable | Distribution | Mean Value | Standard Deviation | Minimum | Maximum |
|---|---|---|---|---|---|
| diameter(mm) | Normal | 47.84 | 0.25 | 47.46 | 48.4 |
| thickness(mm) | Normal | 3.29 | 0.13 | 2.98 | 3.44 |
| Fastener tightening torque(N.m) | Normal | 37 | 15 | 20 | 60 |
| Erection deviation(mm) | Normal | 0 | 16.77 | -33.55 | 33.55 |
CONCLUSION
In this paper, scaffold stability, with regard to all kinds of imperfections, was systematically studied under non-uniform distributed loads and a related experiment was performed.
The following conclusions were obtained.
- The stress on the top of the vertical bar was greater within the scope of load, while the horizontal bar and brace participated in the work of the scaffold. The internal force came through the two types of bars to realize redistribution in every vertical bar in order to decrease the stress from the top to the bottom of the vertical bar and involve them in the stress of the scaffold.
- Non-uniform distributed loads decreased the stable capacity of the scaffold compared with that of the scaffold under a uniform distributed load. When the frame buckled, the vertical bars presented wavy deformation; additionally, the frame also had torsion deformation.
- The most unfavorable erection deviation form was the first Eigenvalue buckling mode.
- When using the first Eigenvalue buckling mode to simulate erection deviation, the consistent imperfection method could obtain the minimum stable capacity while considering all kinds of interacting imperfections
CONSENT FOR PUBLICATION
Not applicable.
CONFLICT OF INTEREST
The authors confirm that this article content has no conflicts of interests.
ACKNOWLEDGEMENTS
This research was supported by the Anhui Universities Natural Science Research Project (grant number KJ2015A046) and the Nature Science Research Project of Anhui province (Research Project No.1408085QE96) for the financial support.


