All published articles of this journal are available on ScienceDirect.
Effect of Unreinforced Masonry Infill Walls on Seismic Performance of Reinforced Concrete Framed Structures
Abstract
Introduction:
Unreinforced Masonry infill walls (URM) are commonly used in the Reinforced Concrete (RC) framed structures as interiors and exteriors partition walls. Although they usually are not considered in the structural analysis and design, their influence on the seismic performance of the framed structures is significant. A common practice in the modern and old RC buildings is to remove the URM walls in the lower stories for commercial reasons; garages, storages, shops etc.
Methods:
In the present work, the effect of the URM walls on seismic performance of the RC framed structure will be studied. For that, three groups of 2-D three-bay framed structures, which are fully and partially infilled with the URM walls, will be studied. These groups are classified as three stories, six stories, and nine stories RC framed structures representing low, medium and, high rise buildings; respectively. In each group, different infill panels' configuration will be studied in order to simulate the cases of ignoring or considering the stiffness and strength of the URM. Double-strut nonlinear cyclic model for masonry panels has been utilized in order to account for the structural action of the URM walls. Pushover analysis is adopted for the evaluation of the seismic response of the frames considering the material inelasticity and the geometric nonlinearity in the analysis.
Results and Conclusion:
Some selected numerical simulation results in terms of base shear forces, lateral deflections, and inter-story drift ratios are obtained for all the considered configurations and presented in comparative way. The regular distribution of the infill walls can improve the framed structure performance. However, omitting the infill from the ground story leads to soft story phenomena as the columns in this story are more vulnerable due to the shear forces acting on them.
1. INTRODUCTION
Infill walls can be frequently found as interior and exterior partitions for architectural purposes in RC structures. Common practice has always been to ignore the infills during the design and the analysis of the reinforced concrete framed structures due to its highly non-linear nature which is difficult to be simulated. In addition, the simulation of such non-structural infill walls is a tedious and complicated issue and requires larger solving time and complex computational techniques. However, they may interact with the surrounding frame when the structure is subjected to lateral loads induced by earthquake ground motions. Although their presence often leads to increasing the lateral load resistance of the RC structures, which were not originally designed for the seismic loading, they have been, sometimes, thought to be the reason for structural failures such as short-column phenomena, soft story effect, and torsion. In Egypt, the URM infill walls are used in the majority of the RC building structures. A common practice in the modern and old RC buildings in Egypt is to remove these walls in the lower stories for commercial reasons; garages, storages, shops, etc. Definitely, this configuration of the URM walls all over the building affects its behavior during earthquakes. However, the Egyptian national building code neglects their effect based on the assumption that this may lead to more conservative results.
The interaction between RC framed structures and infill wall panels was investigated and large numbers of experimental and analytical researches were conducted on this topic. The first published experimental research on infilled RC frames subjected to racking load was by Polyakov [1] who performed a number of large scale tests in order to determine the racking strength of infilled frames. A significant number of studies showed experimentally [2-12] that the presence of the infill walls increases the stiffness and the strength of the framed building.
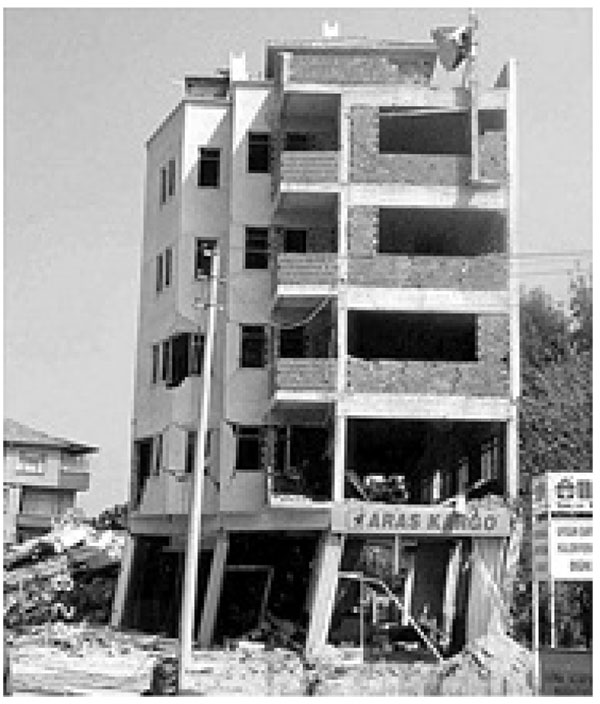
Because of the common use of the masonry infilled frames throughout the world, many lessons can be learned by studying their damage patterns after the occurrence of earthquakes. The infill walls may have a negative impact on the integrity of some building. The common practice of use, the ground-floor of the buildings for commercial purposes, leads to vertical stiffness irregularities and may cause soft story mechanism as shown in Fig. (1).
This current work aims to study the effect of the URM infill walls on the behavior of RC framed structures under seismic loads. In order to achieve this goal, a numerical study will be conducted using SeismoStruct software taking into account the material inelasticity and the geometric nonlinearity. Static pushover will be carried out during this research in order to achieve a comprehensive understanding about the performance of such structures.
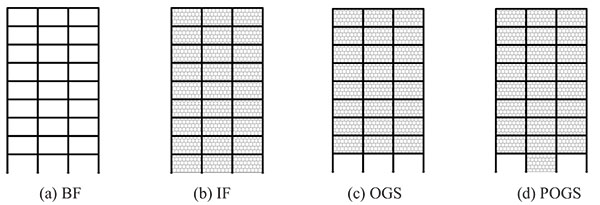
Three groups of 2-D three-bay framed structures will be used in this study. Only gravity loads will be considered in the design of these frames to simulate the case of old existing building in which no seismic design was followed. The design will be carried out according to the Egyptian code regulations. The three building groups are classified as three stories, six stories and, nine stories RC framed structures representing low, medium and, high rise buildings; respectively. In each group, a set of different infill panels’ configuration has been adopted in order to perform the analysis as 1- Bare Frame (BF) which represents the most used common practice of not including the stiffness and strength of URM infill walls in the analysis and design procedure, 2- fully Infilled Frame (IF) in which the stiffness and the strength of the masonry walls is considered, 3- infilled frame with open ground story (OGS) in which the infill walls are omitted from the ground story to represent the common practice of removing the walls for commercial reasons, 4- infilled frame with partially open ground story (POGS) in which only two panels are removed.
2. INFILLED FRAMES MODELING
Several methods have been developed to model the infill walls. They may be classified into two groups, micro-models and macro-models. Micro-models focus on detailed behavior of each individual infill panel (i.e., stiffness, capacity, etc.) while the macro-models study the overall structural system response. The main advantage of the macro-models is its computational simplicity as it is based on equivalent strut model as firstly described by Polyakov [14] who suggested replacing the infill wall by a diagonal compression strut. In other words, the infilled frame system is equivalent to a braced frame.
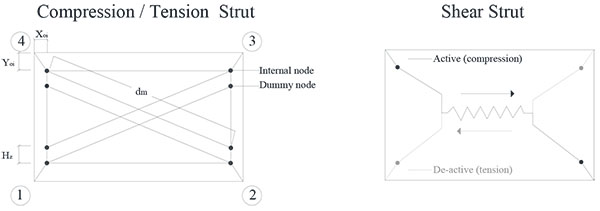
In this work, the masonry infill walls were modeled through the simplified macro-model proposed by Crisafulli [15], which consider two pairs of compression-tension diagonal struts to carry axial loads across two opposite diagonal corners and two pairs of shear struts with a shear spring to carry the shear from the top to the bottom of the panel as illustrated in Fig. (2).
3. MODELING VERIFICATION
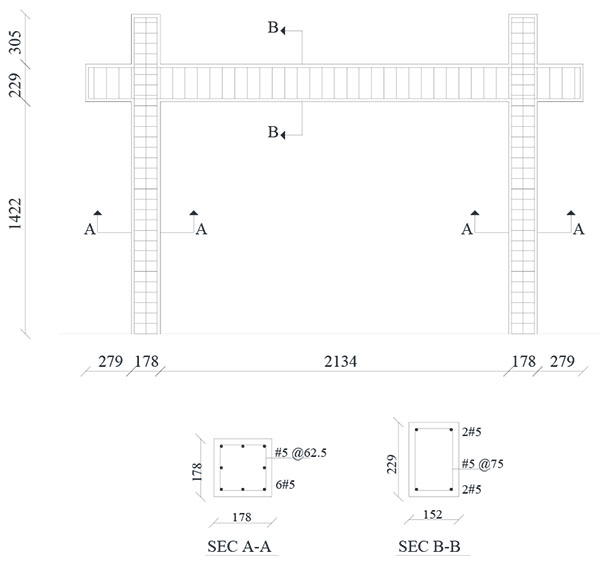
In order to be certain that the modeling successfully predicts the approximate true behavior of the structure, a verification model using experimental data has been done. The specimen tested by Mehrabi et al. [4] and used in this analytical model is a half-scale frame model representing the interior bay at the bottom story of a prototype frame. A selective specimen (test No. 1) has been chosen from Mehrabi collection. Geometry and reinforcement details of the selected specimen are shown in Fig. (3). Further information on the test can be found in Mehrabi et al. [4]. Material properties of the reinforced concrete frame have been the same as laboratory testing. The frame has been modeled in SeismoStruct software [16]. Inelastic displacement-based frame elements divided in 200 fibers have been used for modeling beams and columns. The structure has been subjected to constant vertical loading of 146.8 kN and monotonically increasing lateral loading.
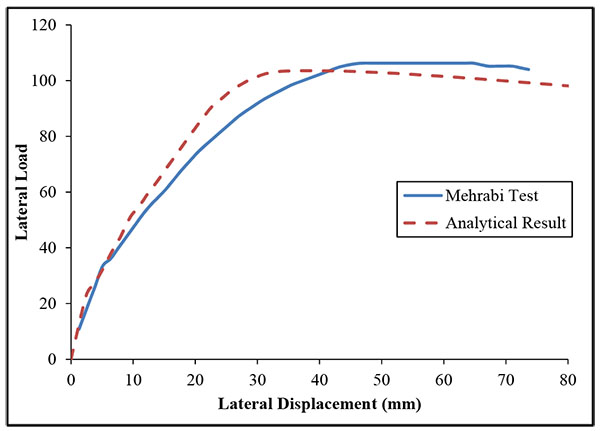
Analysis results are plotted together with the test data as in Fig. (4). A first overall observation is that the analytical results demonstrate a good match with those of the experiment. Small differences are identified. However, the model succeeds in describing the response of the frame under pushover analysis. The graphs indicate that the model predicts the behavior with acceptable accuracy.
The implementation of the double-strut nonlinear cyclic model for URM walls was carried out by Smyrou et al. [17].
4. PARAMETRIC STUDY
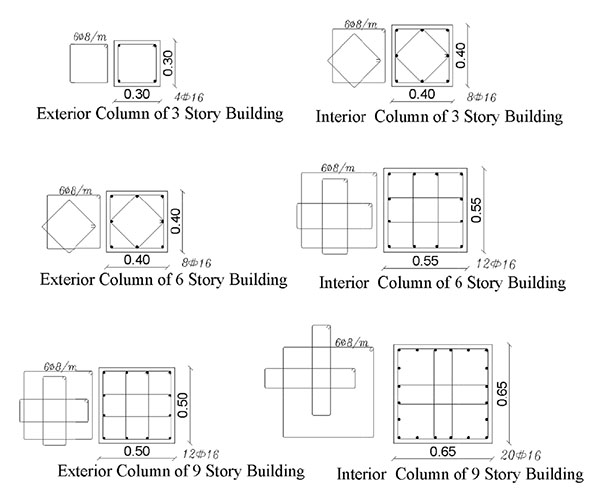
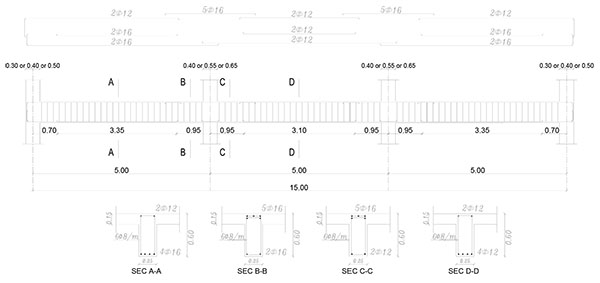
In order to investigate the seismic performance of the framed buildings infilled with URM walls as well as framed buildings with open soft stories, three groups of 2-dimensional framed structures have been employed. The three groups are nine stories, six stories and, three stories framed structures representing High Rise Building (HRB), Medium Rise Building (MRB) and, Low Rise Buildings (LRB), respectively. They are RC framed structures with three bays of 5.0m span composed of moment resisting frames (no shear walls are utilized) spaced at 5.0m with a constant floor height of 3.0m. The typical layout plan for the three buildings is shown in Fig. (5). For all investigated models, slabs have been taken to be 0.15m in thickness. In each group, different infill panels’ configuration (e.g. bare frame (BF), infilled frame (IF), open ground story (OGS) in which the infill walls have been omitted from the ground story to represent the common practice of removing the walls for commercial reasons, and partially open ground story (POGS in which the infill panels have been located in all stories and in all bays except the two exterior bays in the ground story) have been studied as shown in Figs. (6, 7, and 8) for HRB, MRB, and LRB; respectively. The columns have the same geometrical characteristics along the height as illustrated in Fig. (9). All beams have the same dimensions (0.25m width x 0.60m depth) in all floors. Fig. (10) shows the reinforcement details of a typical beam.
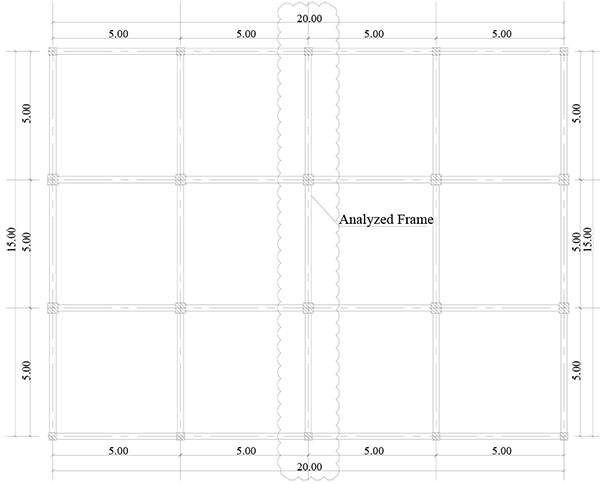


Only the gravity loads have been considered in the design of these frames, and therefore the frames have not been expected to meet the seismic design requirements. The design has been carried out according to the Egyptian regulations [18, 19]. Vertical distributed loads on beams and concentrated loads on the columns have been considered in order to simulate the self-weight of the frame, the live load, the finishings, other self-loads and certainly the infill walls. For the infill walls, a specific weight of 14kN/m3 is considered in the calculations.
4.1. Material Properties
The materials were chosen to have properties close to those used in the construction in Egypt. The concrete used corresponds to a normal weight with cubic compressive strength of 25Mpa. The steel used is high grade steel of class 36/52 according to the Egyptian standard with nominal values of yield strength, ultimate strength and ultimate strain equal to 360Mpa, 520Mpa and 12%, respectively.
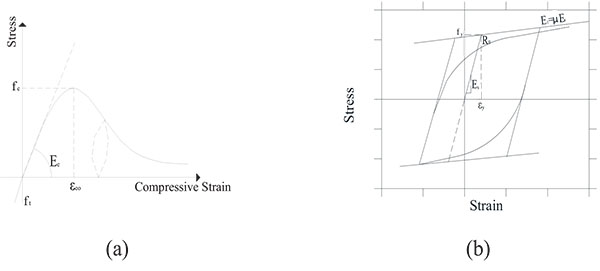
Nonlinear concrete model proposed by Mander et al. [20] is employed for defining the concrete material while the Menegotto-Pinto steel model proposed by Menegotto and Pinto [21] is employed for defining the steel material as presented in Table 1 and Fig. (11).
| Concrete model | Steel Model | ||||
|---|---|---|---|---|---|
| Modulus of elasticity (Ec) | Mean compressive strength (fC) | Mean tensile strength (ft) | Modulus of elasticity (ES) | Yield strength (fy) | Strain hardening parameter (μ) |
| 21.4GPa | 20.8MPa | 2 MPa | 200GPa | 360MPa | 0.00677 |
The non-load bearing infill walls of hollow bricks were assumed to be used in the modeling with dimensions 0.12x0.25x0.06m. Plaster of 15mm was applied on both sides of the wall. Material properties adopted for masonry infill walls are presented in Table 2.
The width (w) of the infill diagonal strut is computed using the expression by Paulay and Preistley [22]; given in Equation 1.
 |
(1) |
where dinf = the diagonal length of infill.
| Infill panel model | ||||
|---|---|---|---|---|
| Compressive strength | Young’s modulus | Tensile strength | Wall thickness with plaster | Strut diagonal width |
| 5MPa | 5GPa | 0.575 MPa | 0.15 m | 1.25 m |
5. NUMERICAL MODELING
The frames have been modeled in SeismoStruct software [16] which is a Finite Element package capable of predicting the large displacement behavior of space frames under static or dynamic loading. Inelastic displacement-based frame elements divided in 200 fibers have been used for modeling beams and columns. Beams and columns have been modeled as extending from the center of one beam-column joint to the center of the next. Each structural member has been subdivided into inelastic four beam-column elements with smaller length at the member ends so as to ensure the accurate modeling of expected plastic hinge zones. In order to accurately model the reinforcement of the several regions of the concrete members, number of beam sections has been increased corresponding to beams ends and the beam mid-spans, with different reinforcement distribution. The effective width of slab has been taken to be 0.95m for each span according to the Egyptian code provisions. In order to represent the strong foundation, fixed supports have been used for the ground columns. The rest of the nodes have been restrained in the out of plane degree of freedoms in order to perform two-dimensional analysis.
6. STATIC PUSHOVER ANALYSIS
Pushover analysis is a nonlinear static analysis method used to predict and evaluate the seismic performance of the old existing, as well as, the new structures. In this type of analysis, the structure is subjected to gravity loading and monotonically increasing inverted triangular lateral load pattern through elastic and inelastic behavior until ultimate condition is reached. The used loading strategy is force-based pushover with displacement controlled. At the end, the relationship between the base shear and the lateral deflection (roof displacement), that is called capacity curve, is determined [23].
7. NUMERICAL RESULTS AND DISCUSSION
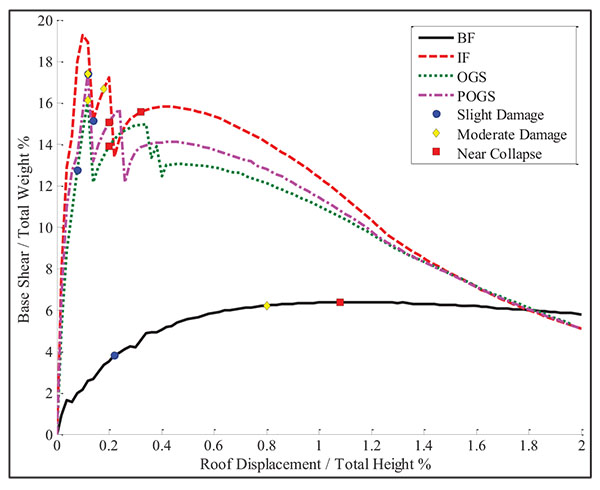
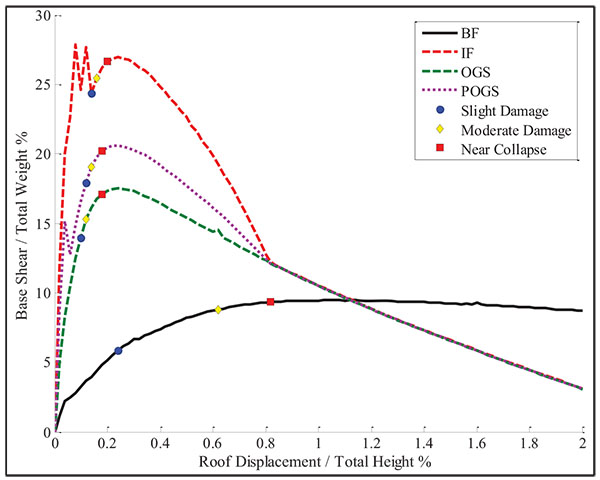
The resulting capacity curves of the HRB, MRB, and LRB with and without the infill panels are presented in Figs. (12, 14, and 16) where the x-axis represents the roof drift ratio (The ratio of the roof displacement to the total height (Δ/H) (while the y-axis represents the ratio of the base shear to the total weight (P/W). In the figures, three damage states are defined; first steel yielding at columns and beams representing slight damage, first cover spalling at columns and beams representing the moderate damage, and first crushing in column representing the near collapse state.
7.1. High Rise Buildings
In order to demonstrate the behavior of each high rise building, a comparison of the resulting capacity curves for the BF, IF, OGS, and POGS is shown in Fig. (12). The BF has shown linear behavior up to a base shear of about 1.7% of the total weight at a roof displacement corresponding to 0.04% of the total height. The base shear capacity has been found to be around 6.4% of the total weight when the roof drift has reached to 1.14%.
The IF has shown linear behavior up to a base shear of about 14.4% of the total weight at a roof displacement corresponding to 0.06% of the total height. The base shear has reached its peak value of 19.3% of the total weight at a roof drift ratio of 0.1%. Beyond this point, the cracking of the infill panels has taken place resulting in reducing the base shear ratio to 13.4%. The base shear has started to increase again till reaching its capacity of about 15.8% of the total weight at roof drift ratio of 0.42%. Although failure of infills has occurred in the early stages of the lateral loading, their presence has increased the initial stiffness by about 7.8 times that of the BF and the shear capacity by about 2.5 times that of the BF. The capacity of the IF has shown higher degradation when compared to the BF. The IF has tended to act as a BF at later stages after the failure of the infill panels.
The OGS has shown linear behavior up to a base shear of about 8.8% of the total weight at a roof displacement corresponding to 0.04% of the total height. The base shear ratio has reached its peak value of 16% at a roof drift ratio of 0.12%. Due to the cracking of the infilles, the base shear ratio has dropped to 12.2% and increased again till reaching its capacity which has been found to be around 14.9% of the total weight when the roof drift ratio has reached 0.34%. Similar to the IF, the capacity of the OGS has shown higher degradation than the BF. It is observed that the capacity curve of the OGS has degraded till that of the BF, which means that the infill panels have collapsed. It can be seen that the initial stiffness of the OGS frame is more than the stiffness of the BF by about 5 times and the shear capacity is more by about 2.3 times.
The partial removal of the infill panels in the ground story as in the case of POGS has provided higher stiffness and lateral capacity comparing to OGS. The frame has behaved linearly up to a base shear ratio of about 11% at a roof displacement corresponding to 0.04% drift ratio. The base shear ratio has reached its peak capacity at 17.4%. The cracking of the infills has resulted in reducing the base shear ratio to 13.2%. The shear capacity has been found to be around 15.7% of the total weight when the roof drift ratio has reached 0.24%. Similar to the IF and OGS, the capacity of the POGS has shown higher degradation than the BF. Also, the capacity curve of the POGS has degraded till that of the BF. It is notorious that the initial stiffness is more than the BF’s stiffness by 6.7 times while the lateral capacity is more by 2.5 times.
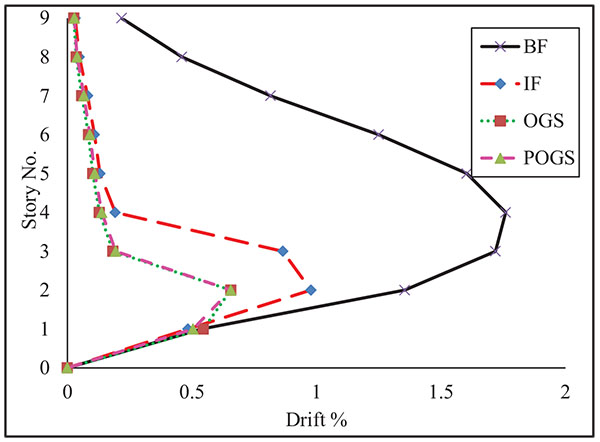
Inter-story drift profiles of the H.R.B under pushover analysis are presented in Fig. (13). It should be noted that these drift profiles represent the envelopes of the peak drift ratios beyond the collapse state. In other words, they do not represent drift profiles at a given load increment. It can be seen that there are differences among the drift profiles of the building structure modeled as BF, IF, OGS, and POGS. The figure indicates that, the maximum value of inter-story drift for the BF has occurred around the middle stories. However, the maximum drift ratios for the IF, OGS, and POGS have occurred at the second story. This can be due to the early cracking of the infill panels at the lower stories. The maximum inter-story drift ratios at the ground story are rather equal for the four structures. It is worth to mention that the drift profiles of the OGS and POGS are almost identical in all stories except in the ground story.
7.2. Medium Rise Buildings
The comparison of the resulting capacity curves for each configuration of infill panels of the medium rise buildings is shown in Fig. (14). The BF has shown linear behavior up to a base shear of about 2.2% of the total weight at a roof displacement corresponding to 0.04% drift ratio. The lateral shear capacity has been found to be around 9.5% of the total weight when the roof drift ratio has reached to 1.06%.
The IF has shown linear behavior up to a base shear of about 20% of the total weight at a roof displacement corresponding to 0.04% drift ratio. The frame has reached its peak value at a base shear of 27.9% of the total weight. As the HRB, the base shear ratio has dropped to 24.3% due to the infill cracking. The curve has increased again till reaching its lateral capacity which is about 26.9% of the total weight when the roof drift ratio has reached 0.24%. The presence of the infill panels has increased the initial stiffness by about 9 times that of the BF and the shear capacity by about 2.8 times. At the later stages after the failure of the infill panels, as the HRB, the infilled frame has tended to act as a bare frame.
The OGS has shown linear behavior up to a base shear of about 8.3% of the total weight at a roof displacement corresponding to 0.04% drift ratio. The shear capacity has been found to be about 17.5% of the total weight when the roof drift ratio has reached 0.24%. It can be seen that the initial stiffness of the OGS frame is more than the stiffness of the BF by about 3.8 times and the lateral capacity is more by about 1.8 times.
The POGS has higher stiffness and lateral capacity comparing to OGS. The frame has behaved linearly up to a base shear ratio of about 15.1% at a roof displacement corresponding to 0.084% drift ratio. Then, it has dropped to 12.7% due to the cracking of the ground infill panel and started to act as an OGS frame. The shear capacity has been found to be about 20.6% of the total weight when the roof drift ratio has reached 0.24%. The initial stiffness is more than the BF’s initial stiffness by 7 times and the lateral capacity is more by 2.2 times.
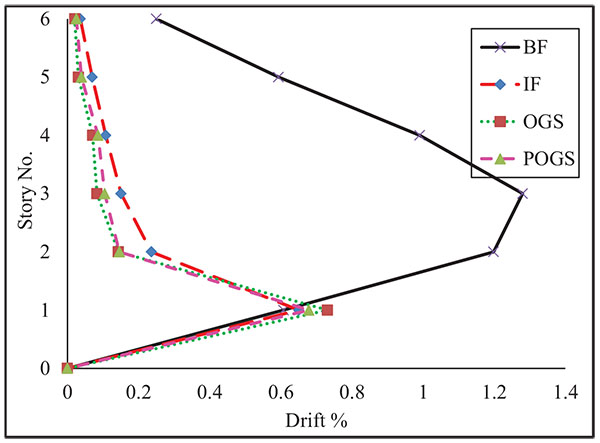
Plots for the maximum inter-story drift of the MRB under pushover analysis are presented in Fig. (15). These obtained plots illustrate the differences among the drift profiles of the building structure modeled as BF, IF, OGS, and POGS. As the HRB, the maximum value of inter-story drift for the BF has occurred around the middle stories. However, the maximum drift ratio for the IF, OGS, and POGS has occurred at the ground story. This can be due to the formation of the soft story mechanism in the OGS and the early cracking of the infill panels at the ground story for IF and POGS. As the HRB, the drift profiles of the OGS and POGS are almost identical. However, a slight difference has been observed with the drift profile of the IF.
7.2.3. Low Rise Buildings
The comparison of the resulting capacity curves for each low rise building is shown in Fig. (16). The BF has behaved linearly up to a base shear of about 4.4% of the total weight when the top floor has reached a roof displacement corresponding to 0.08% of the total height. The shear capacity has been found to be about 13.9% of the total weight when the roof drift ratio has reached to 0.96%.
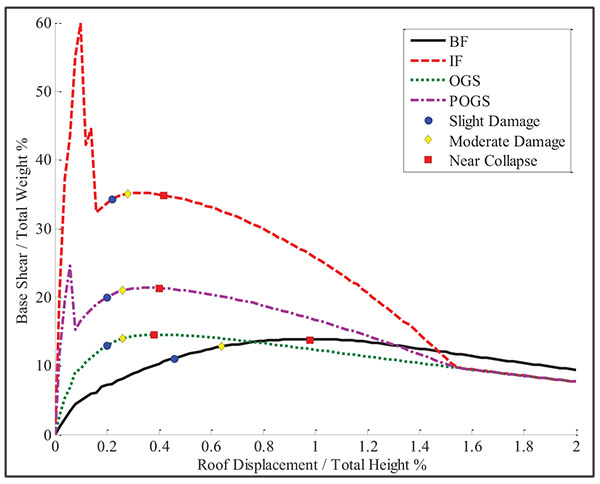
The IF has shown linear behavior up to a base shear of about 37.3% of the total weight at a roof displacement corresponding to 0.04% drift ratio. The frame has reached its peak value at 59.8% of the total weight. As the HRB and the MRB, the base shear ratio has dropped to 32.3% because of the infill cracking. The base shear has increased again till reaching its lateral capacity of about 35.2% of the total weight when the roof drift ratio has reached 0.32%. The initial stiffness of the IF has been found to be much more than the stiffness of the BF by about 17 times while the shear capacity has been found to be more by about 2.5 times.
The OGS has behaved linearly up to a base shear of about 9.1% of the total weight when the roof has reached a drift ratio of about 0.08%. The shear capacity has been found to be around 14.5% of the total weight when the roof drift ratio has reached 0. 4%. The initial stiffness of the OGS frame has found to be more than the stiffness of the bare frame by about 2.1 times. However, the OGS base shear has degraded to be less than the BF base shear. It can be seen that the shear capacity of the OGS is rather equal to the BF shear capacity but with low drift ratio.
The existence of the infill panel in only one bay has provided the OGS more stiffness and lateral capacity. The POGS frame has behaved linearly up to a base shear ratio of about 24.6% at a roof displacement corresponding to 0.06% drift ratio. Then, the frame has started to act as an OGS frame and the base shear ratio has dropped to 15.3% due to the cracking of the ground infill panel. The shear capacity has been found to be around 13.4% of the total weight when the roof drift ratio has reached 0.36%. The initial stiffness has been found to be more than the BF’s stiffness by 7.5 times and the lateral capacity has found to be more by 1.5 times.
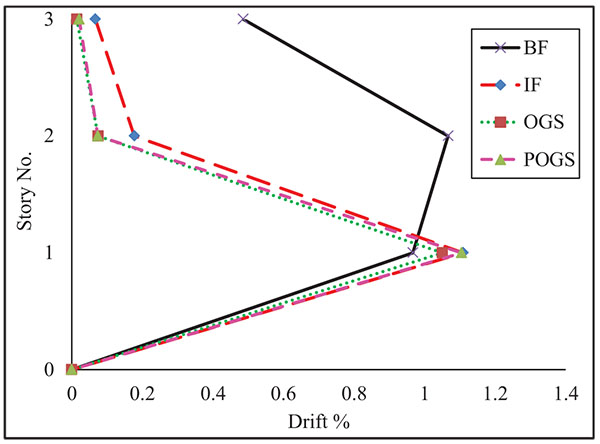
The maximum inter-story drift profiles of the LRB under pushover analysis are presented in Fig. (17). The differences among the drift profiles of the building structure modeled as BF, IF, OGS, and POGS can be observed. The maximum value of inter-story drift for the BF has occurred at the second story. However, the maximum drift ratio for the IF, OGS, and POGS has occurred at the ground story due to the formation of the soft story mechanism in the OGS and the early cracking of the infill panels at the ground story for IF and POGS. As the HRB and the MRB, slight difference has been observed between the drift profiles of the IF, OGS, and POGS frames.
CONCLUSION
This current work aims to study the performance of RC framed structures which are fully or partially infilled with URM walls under seismic loads. In order to attain this goal, a numerical study of three groups of 2-D three-bays RC framed structures was conducted using Pushover analysis. The three building groups are classified as nine, six and three stories representing high, medium, and low rise building; respectively. Different infill panels’ configurations were studied for each group. For those cases, the following conclusions may be drawn:
- The interaction between the masonry infill walls and the frame strongly influence the global performance of the framed structures. The performance of the bare frame does significantly vary from the other various infill panels’ configuration (i.e. partially or fully infilled) under lateral loading.
- Partially or fully infilled framed structures have higher stiffness than the bare framed structure. This was observed clearly in the natural periods of the structures and capacity curves. The lateral capacity of the infilled is much more than that of the bare frame. Also, partially infilled frames such as OGS and POGS have more lateral capacity. However, the resulting P - Δ effect may lead to instability of the building structure and in turn the structure collapses provided that the lateral deflections due to the existence of soft story become too large.
- The existence of soft story in the ground level due to omitting the infills led to making the columns in this story more vulnerable as the shear forces acting on columns are considerably higher than those associated with the bare frame.
- Differences were observed among the drift profiles of the structures. Taking the masonry infill panels into consideration decreases the values of story drift as compared to the bare frame.
- The national Egyptian building codes should consider the soft story irregularity due to omitting the infill panels in the ground story. Furthermore, a magnification factor for the shear forces and a reduction factor for the fundamental period and the story displacement can be provided in case of using infills regularly along the total height.
CONSENT FOR PUBLICATION
Not applicable.
CONFLICT OF INTEREST
The authors declare no conflict of interest, financial or otherwise.
ACKNOWLEDGEMENTS
Declared none.


