All published articles of this journal are available on ScienceDirect.

Performance of a Fly Ash Geopolymeric Based Binder with Calcium Hydroxide, Portland Cement and Metakaolin as Additives
Abstract
Background:
Geopolymeric binders are especially indicated when reusing a wide diversity of wastes. This is an important feature, especially in the European context, in which a circular economy and future zero waste are targeted. Still, the cost of these materials, due to the use of high purity activators, prevents their commercialization as they are simply not competitive enough.
Objective:
The reduction in the amount of activators could be a cost-efficient solution if the associated decrease in the mechanical properties turned not to be excessive. This means that it is important to investigate the manner in which these additives can be used on their composition in order to compensate that mechanical reduction.
Results and Conclusion:
This paper discloses results concerning the mixed design of fly ash based geopolymeric mixtures using metakaolin, Portland cement (OPC) and calcium hydroxide as additives. Their influence on the mechanical properties, microstructure and cost-efficiency was studied. The results showed that the use of Portland cement as an additive leads to lower compressive strength. Results also show that geopolymers with different additives have different optimum Na2SiO3/NaOH ratios.
1. INTRODUCTION
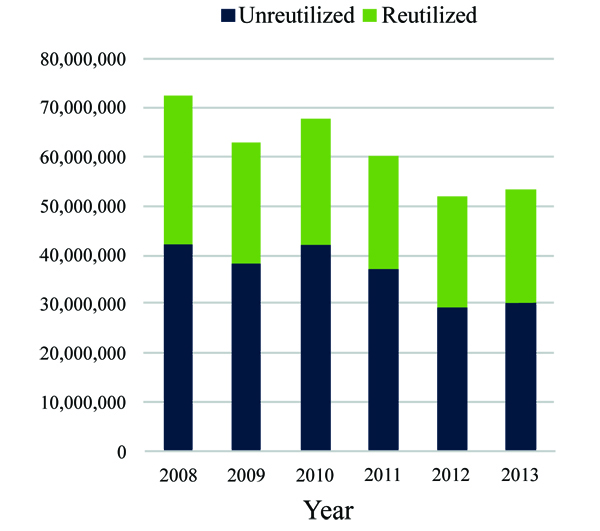
Portland cement is the main binder used by the construction industry with an annual production of almost 3 Gt [1]. Additionally, the projections show that in the next 40 years it will have a twofold increase, reaching 6 Gt/year. In the last decades, alternative binders meant to replace Portland cement were studied, with geopolymers being the most less significant of the group [2, 3]. These materials are based on aluminosilicates activated with alkali activators, thus leading to the formation of an amorphous aluminosilicate gel. The activation of precursors possessing higher calcium content, which are not classified as geopolymers, generates C-A-S-H gel which can coexist with minor secondary N-A-S-H gel [4]. Research works carried out so far in the development of these materials showed that much has already been investigated. However, geopolymers still show some shortcomings that need to be addressed so they can effectively compete against Portland cement [5-7]. Cost is one of those shortcomings. The research conducted by Habert et al. [8] and Ouellet-Plamondon and Habert [9] confirmed that the cost of geopolymers is one of the main disadvantages when comparing these materials against Portland cement. McLellan et al. [10] also suggested that the use of less expensive waste feedstocks may reduce geopolymer cost. Abdollahnejad et al. [11] recently studied foam fly ash based two-part (NaOH, NaSiO3) mixtures having confirmed that geopolymeric mixtures were not cost-efficient at all. This issue was also confirmed by Provis et al. et al. [12] who recognized that new activators that allow for cost-efficient geopolymers constitute a key aspect that should be further investigated. Since the current activators based on sodium hydroxide and sodium silicate represent the higher percentage of the geopolymer cost, a reduction in its amount would be a cost-efficient solution. However, as was already confirmed by previous studies [13], such reduction will lead to a lower compressive strength ]. This means that it is important to investigate how additives such as calcium hydroxide, OPC or metakaolin can be used to compensate that mechanical reduction. On the positive side, geopolymers have the ability for waste reuse [14-19]. This is important for a zero waste target [20, 21]. Fly ash is a material with potential to be reused as it possesses a high discard rate (Fig. 1) [22]. Also, recent studies [19] concerning waste geopolymerization reported fly ash utilization rates below 20%. Other recent works confirm the importance of further studies regarding the development of geopolymers based on fly ash precursors [23]. In this context, this paper evaluates how the mixed design of fly ash based geopolymeric mixtures with partial replacement of fly ash by metakaolin, Portland cement and calcium hydroxide influences their mechanical properties and cost-efficiency.
2. Experimental Program
2.1. Materials
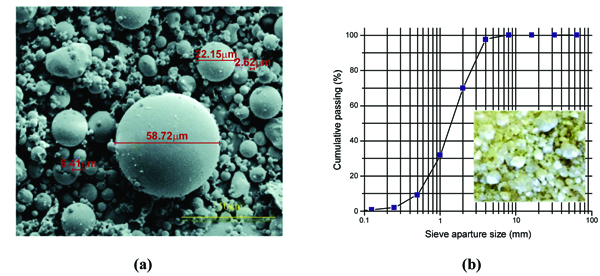
The raw materials used for the preparation of the mortars were fly ash, calcium hydroxide, metakaolin, cement type I 42.5R, sand, sodium silicate, sodium hydroxide and superplasticizer. Solid sodium hydroxide was supplied by ERCROS, S.A., Spain [24], and was used to prepare a 12M NaOH solution. Distilled water was used to dissolve the sodium hydroxide flakes to avoid the effect of unknown contaminants in the mixing water. The NaOH mix was made 24 h prior to use in order to have a homogenous solution at room temperature. The sodium silicate solution was supplied by MARCANDE, Portugal [25]. The chemical composition of the sodium silicate was 13.5% Na2O, 58.7% SiO2 and 45.2% H2O. The fly ash was obtained from The PEGO Thermal Power Plant in Portugal [26] and it was classified as class F according to the ASTM-C618 [27] standard. The chemical composition of the fly ash’s main oxides is presented in Table 1. The microstructure of the fly ash revealed a large variation in particle size (Fig. 2a). The smallest median size of fly ash particles was of around 2µm in diameter and the largest reached approximately 59µm. Portland cement type I class 42.5R from SECIL, Portugal [28] and calcium hydroxide from LUSICAL H10 [29] were used as additives. In terms of chemical components, OPC contains 63.3% CaO, 21.4% SiO2, 4.0% Fe2O, 3.3% Al2O3, 2.4% MgO and other minor oxides. The calcium hydroxide used in this study contains more than 99% CaO. The sand was supplied by MIBAL, Minas de Barqueiros, S.A. Portugal. Sieving operation was carried out to remove dust particles. The dimension of the sieves was 4.75mm and 0.6mm. The sand has a fineness modulus of 3.885. The detailed grain size distribution of the sand is presented in Fig. (2b). The sand was dried at 105 ºC during 24 hours before their use in the mixtures. Metakaolin was also used as an additive. It was produced through the calcination of commercial kaolin that was provided from MIBAL, Minas de Barqueiros, S.A. Portugal [30]. Kaolin was heat treated at 650˚C in a static furnace during 140 min in order to obtain reactive metakaolin (MK). Table 1 shows the chemical composition of metakaolin. The superplasticizer used in mortar production was a polyacrylate from Acronal, with a density of 1050 kg/m3 and supplied by BASF [31].
| Material | Oxides (wt.%) | |||||||
|---|---|---|---|---|---|---|---|---|
| SiO2 | Al2O3 | Fe2O3 | CaO | MgO | Na2O | K2O | TiO2 | |
| Fly Ash | 60.81 | 22.68 | 7.64 | 1.01 | 2.24 | 1.45 | 2.7 | 1.46 |
| Metakaolin | 56.22 | 37.62 | 2.45 | - | - | 0.3 | 2.53 | 0.87 |
2.2. Mortar Production
Table 2 shows the composition of the mortars. These were prepared according to the following steps: (i) homogenization of sodium silicate and NaOH solution (12M) for 1 min; (ii) mixing all the solid materials together by using a speed of 65rpm for 3 min; (iii) addition of the activator and remixture for 1 min with a speed of 65rpm with subsequent mixing during 1 min at 90rpm. The mixture was then transferred to metallic molds with 50mm×50mm×50mm. The specimens were cured in laboratory conditions (25˚C and 65% RH). After nearly 4hr the specimens were demoulded and kept sealed with the plastic and then left in the same curing conditions until the date of testing.
| Formulations | Materials (kg/m3)* | ||||||||
|---|---|---|---|---|---|---|---|---|---|
| PC | MK | FA | CH | SA | SS | SH | SP | W | |
| 90FA_10CH_12M_2.5S/H_0.8A/B | 0 | 0 | 438.5 | 48,7 | 1461.5 | 278 | 111.7 | 0 | 0 |
| 90FA_10PC_12M_2.5S/H_0.8A/B | 49 | 0 | 441.5 | 0 | 1471.3 | 280 | 112.5 | 0 | 0 |
| 90FA_5PC_12M_2.5S/H_0.8A/B | 25.8 | 0 | 464 | 0 | 1469.5 | 280 | 111.1 | 0 | 0 |
| 90FA_10CH_12M_2.5S/H_1.0A/B | 0 | 0 | 415.8 | 46.2 | 1385.9 | 330 | 132.4 | 0 | 0 |
| 90FA_10PC_12M_2.5S/H_1.0A/B | 46.5 | 0 | 418.4 | 0 | 1394.8 | 331.6 | 133.3 | 0 | 0 |
| 90FA_5PC_12M_2.5S/H_1.0A/B | 24.4 | 0 | 439 | 0 | 1390.8 | 332.4 | 132.8 | 0 | 0 |
| 90FA_10CH_12M_2.0S/H_0.8A/B | 0 | 0 | 435 | 48.3 | 1449.5 | 257.7 | 128.8 | 0 | 0 |
| 90FA_10PC_12M_2.0S/H_0.8A/B | 48.6 | 0 | 437.7 | 0 | 1459.2 | 259.4 | 129.7 | 0 | 0 |
| 90FA_5PC_12M_2.0S/H_0.8A/B | 25.5 | 0 | 460 | 0 | 1456.6 | 258.4 | 129.2 | 0 | 0 |
| 90FA_10CH_12M_2.0S/H_1.0A/B | 0 | 0 | 411.2 | 45.8 | 1372.3 | 304.9 | 152.5 | 0 | 0 |
| 90FA_10PC_12M_2.0S/H_1.0A/B | 46 | 0 | 414.3 | 0 | 1381 | 306.9 | 153.4 | 0 | 0 |
| 90FA_5PC_12M_2.0S/H_1.0A/B | 24.1 | 0 | 435.2 | 0 | 1378.2 | 306.3 | 153.1 | 0 | 0 |
| 90FA_10CH_12M_1.5S/H_0.8A/B_0.5SP | 0 | 0 | 428.8 | 47.6 | 1429.3 | 228.7 | 152.4 | 2.4 | 0 |
| 90FA_10PC_12M_1.5S/H_0.8A/B_0.5SP | 48 | 0 | 431.6 | 0 | 1438.7 | 230.2 | 153.4 | 2.4 | 0 |
| 90FA_5PC_12M_1.5S/H_0.8A/B_0.5SP | 25.1 | 0 | 453 | 0 | 434.5 | 230.4 | 153.2 | 2.5 | 0 |
| 90FA_10CH_12M_1.5S/H_1.0A/B_0.5SP | 0 | 0 | 405.2 | 45 | 1350.5 | 270.1 | 180.1 | 2.3 | 0 |
| 90FA_10PC_12M_1.5S/H_1.0A/B_0.5SP | 45.3 | 0 | 407.6 | 0 | 1358.9 | 271.8 | 181.2 | 2.3 | 0 |
| 90FA_5PC_12M_1.5S/H_1.0A/B_0.5SP | 23.8 | 0 | 428.2 | 0 | 1359 | 269.5 | 180.2 | 2.4 | 0 |
| 90FA_10CH_12M_2.5S/H_0.7A/B_1.0SP | 0 | 0 | 448.4 | 49.9 | 1495.6 | 249.1 | 99.7 | 5.5 | 0 |
| 90FA_10CH_12M_2.0S/H_0.7A/B_1.0SP | 0 | 0 | 445 | 49.5 | 1483.4 | 230.8 | 115.4 | 5.5 | 0 |
| 90FA_10CH_12M_1.5S/H_0.7A/B_1.0SP | 0 | 0 | 439.8 | 48.9 | 1465.8 | 206.3 | 137.9 | 5.4 | 0 |
| 80FA_10CH_10MK_12M_2.5S/H_0.7A/B_0.5SP_4.0W | 0 | 48.8 | 390.6 | 48.9 | 1464.9 | 244.1 | 97.7 | 2.4 | 22 |
| 70FA_10CH_20MK_12M_2.5S/H_0.7A/B_0.5SP_4.0W | 0 | 97.6 | 341.7 | 48.9 | 1464.3 | 244.1 | 97.6 | 2.4 | 22 |
| 80FA_10CH_10MK_12M_2.5S/H_0.8A/B_0.5SP_4.0W | 0 | 47.5 | 380.2 | 47.5 | 1425.9 | 271.4 | 108.8 | 2.4 | 21 |
| 70FA_10CH_20MK_12M_2.5S/H_0.8A/B_0.5SP_4.0W | 0 | 95 | 332.5 | 47.5 | 1425.3 | 271.3 | 108.7 | 2.4 | 21 |
| 80FA_10CH_10MK_12M_2.5S/H_1.0A/B | 0 | 46.2 | 369.5 | 46.2 | 1385.7 | 330 | 131.9 | 0 | 0 |
| 70FA_10CH_20MK_12M_2.5S/H_1.0A/B | 0 | 92.3 | 323.2 | 46.2 | 1385.1 | 329.8 | 131.8 | 0 | 0 |
| 80FA_10CH_10MK_12M_2.0S/H_0.7A/B_0.5SP_4.0W | 0 | 48.5 | 387.8 | 48.5 | 1454.1 | 226.2 | 113.1 | 2.4 | 22 |
| 70FA_10CH_20MK_12M_2.0S/H_0.7A/B_0.5SP_4.0W | 0 | 96.9 | 339.1 | 48.5 | 1453.5 | 226.1 | 113 | 2.4 | 22 |
| 80FA_10CH_10MK_12M_2.0S/H_0.8A/B_0.5SP_4.0W | 0 | 47.2 | 377.1 | 47.1 | 1414.3 | 251.4 | 125.7 | 2.4 | 21 |
| 70FA_10CH_20MK_12M_2.0S/H_0.8A/B_0.5SP_4.0W | 0 | 94.2 | 329.8 | 47.1 | 1413.7 | 251.3 | 125.6 | 2.4 | 21 |
| 80FA_10CH_10MK_12M_2.0S/H_1.0A/B | 0 | 45.7 | 365.8 | 45.7 | 1371.8 | 304.8 | 152.4 | 0 | 0 |
| 70FA_10CH_20MK_12M_2.0S/H_1.0A/B | 0 | 91.4 | 319.9 | 45.7 | 1371.3 | 304.7 | 152.3 | 0 | 0 |
| 80FA_10CH_10MK_12M_1.5S/H_0.7A/B_0.5SP_4.0W | 0 | 47.9 | 383.2 | 47.9 | 1437.2 | 202.3 | 135.2 | 2.4 | 22 |
| 70FA_10CH_20MK_12M_1.5S/H_0.7A/B_0.5SP_4.0W | 0 | 95.8 | 335.2 | 47.9 | 1436.6 | 202.2 | 135.1 | 2.4 | 22 |
| 80FA_10CH_10MK_12M_1.5S/H_0.8A/B_0.5SP_4.0W | 0 | 46.6 | 372.9 | 46.6 | 1398.2 | 223.7 | 149.1 | 2.4 | 21 |
| 70FA_10CH_20MK_12M_1.5S/H_0.8A/B_0.5SP_4.0W | 0 | 93.2 | 326.1 | 46.6 | 1397.6 | 223.6 | 149 | 2.4 | 21 |
| 80FA_10CH_10MK_12M_1.5S/H_1.0A/B | 0 | 45.1 | 360.8 | 45.1 | 1352.9 | 270.6 | 180.4 | 0 | 0 |
| 70FA_10CH_20MK_12M_1.5S/H_1.0A/B | 0 | 90.2 | 315.6 | 45.1 | 1352.4 | 270.5 | 180.3 | 0 | 0 |
| 80FA_10CH_10MK_12M_1.0S/H_0.7A/B_0.5SP_4.0W | 0 | 47.2 | 378 | 47.2 | 1417.5 | 165.4 | 165.4 | 2.4 | 21 |
| 70FA_10CH_20MK_12M_1.0S/H_0.7A/B_0.5SP_4.0W | 0 | 94.5 | 331 | 47.2 | 1416.9 | 165.3 | 165.3 | 2.4 | 21 |
| 80FA_10CH_10MK_12M_1.0S/H_0.8A/B_0.5SP_4.0W | 0 | 45.9 | 366.6 | 45.8 | 1374.8 | 183.3 | 183.3 | 2.3 | 21 |
| 70FA_10CH_20MK_12M_1.0S/H_0.8A/B_0.5SP_4.0W | 0 | 91.7 | 320.7 | 45.8 | 1374.2 | 183.2 | 183.2 | 2.3 | 21 |
| 80FA_10CH_10MK_12M_1.0S/H_1.0A/B | 0 | 44.2 | 353.5 | 44.2 | 1325.7 | 220.1 | 220.9 | 0 | 0 |
| 70FA_10CH_20MK_12M_1.0S/H_1.0A/B | 0 | 88.3 | 309.2 | 44.2 | 1325.1 | 220.1 | 220.8 | 0 | 0 |
2.3. Compressive Strength
The testing recommendations of EN1015-11 [32] were followed. After casting, the specimens were kept sealed with a plastic under at laboratory conditions until the testing date at 7days, 14 days and 28 days. The compressive strength measurements were carried out through a compressive strength apparatus model LLOYD-LR50K_PLUS with a capacity of 50KN.
2.4. Microstructure
Small samples with 1cm diameter and 1cm height were extracted for SEM/EDS testing. The microstructural observation for different geopolymer mortar mixtures was carried out using standard SEM/EDS microscopy (NOVA 200 Nano SEM). Micrographs and chemical compositions were collected at an accelerating voltage of 10kV and 15kV, respectively, and variable working distance from 6 mm to 8 mm. The cylindrical sub samples from zones 1 to 3 were coated with a 30nm thick layer of Gold-Palladium (60%Gold and 40%Palladium). Finally, the SEM/EDS examination for all the specimens was conducted.
2.5. FTIR
The specimens resulting from SEM/EDS tests were also tested for Fourier Transform Infrared Spectroscopy (FTIR). The analysis of infrared transmission spectra was carried out through attenuated total reflectance mode (ATR) using a Perkin Elmer FTIR Spectrum BX with an ATR PIKE MIRacle. Specimens for FTIR study were prepared by mixing 1mg of sample in 100 mg of KBr as suggested by Zhang et al. [33]. The IR spectra were recorded over a range of 4000cm-1 and 400cm-1 at a resolution 4cm-1.
2.6. Cost of Geopolymeric Mortars
The prices of the materials that were used to calculate the cost of the mortars are shown in Table 3.
| Sand | Cement | Calcium Hydroxide | Fly Ash | Sodium Hydroxide | Water | SP | Sodium Silicate | Metakaolin |
|---|---|---|---|---|---|---|---|---|
| 0.02 | 0.1 | 0.3 | 0.03 | 0.85 | 0.1 | 0.82 | 0.53 | 0.08 |
3. RESULTS AND DISCUSSION
3.1. Influence of Mix Design on Compressive Strength
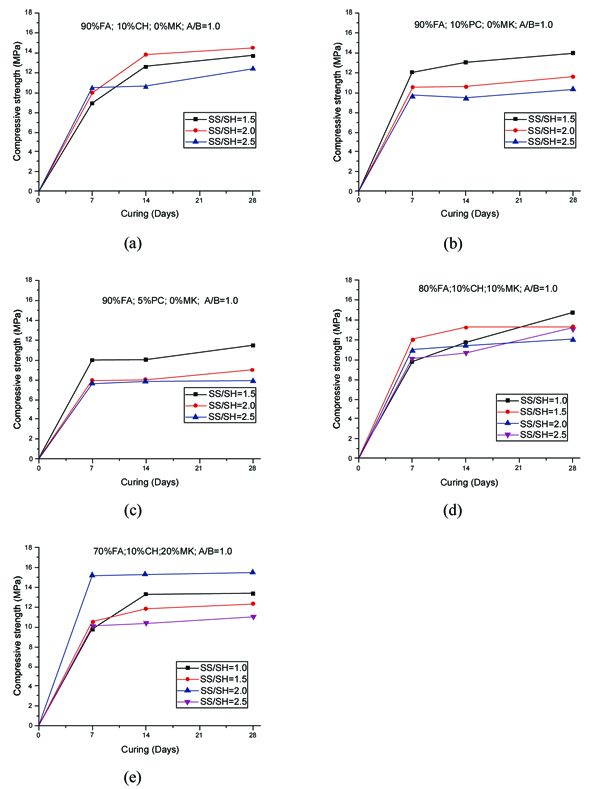
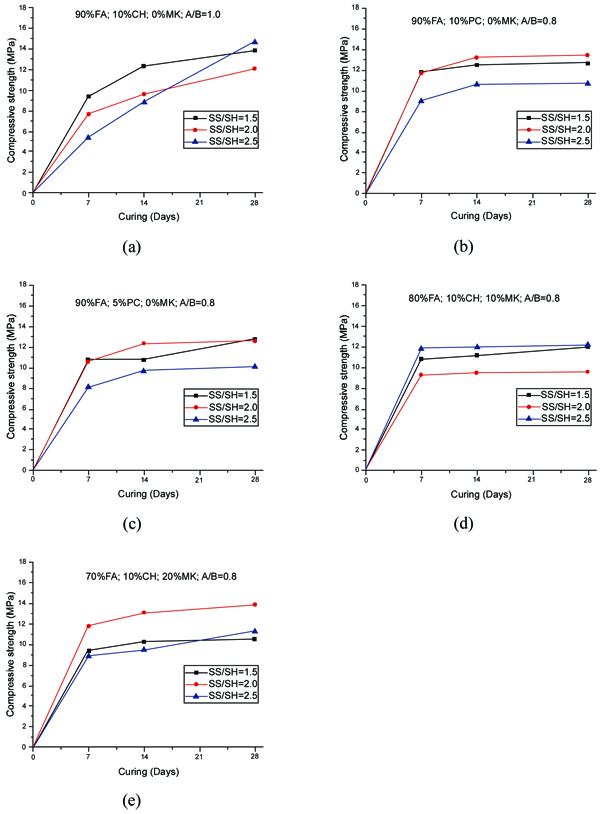
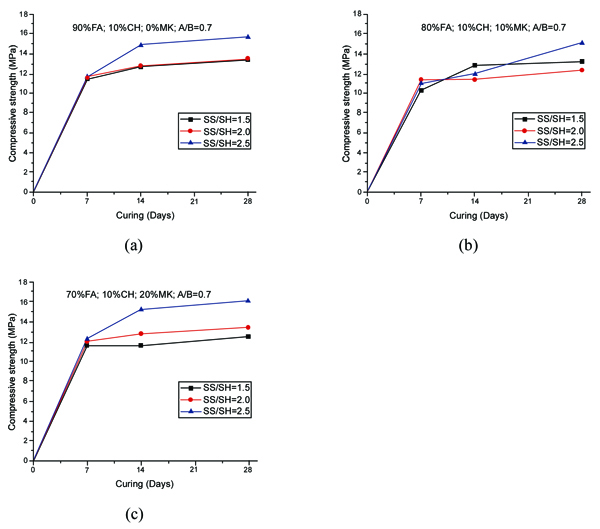
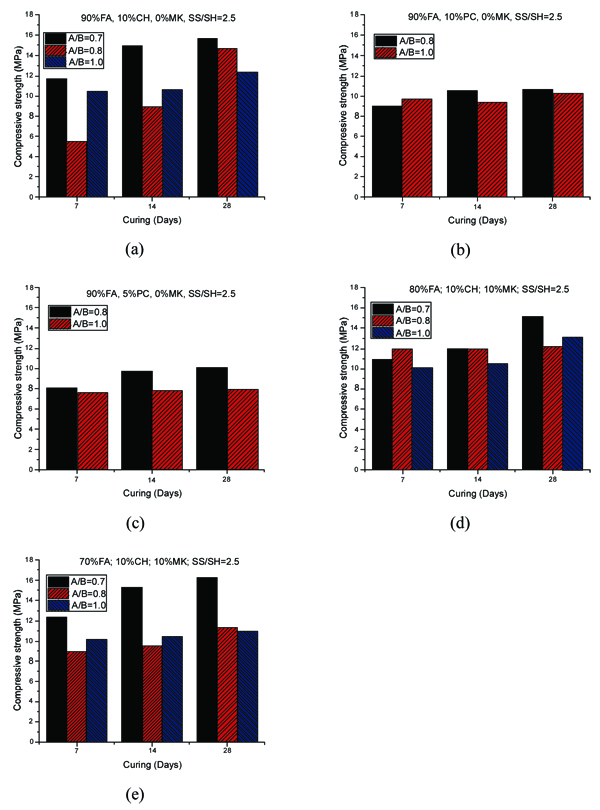
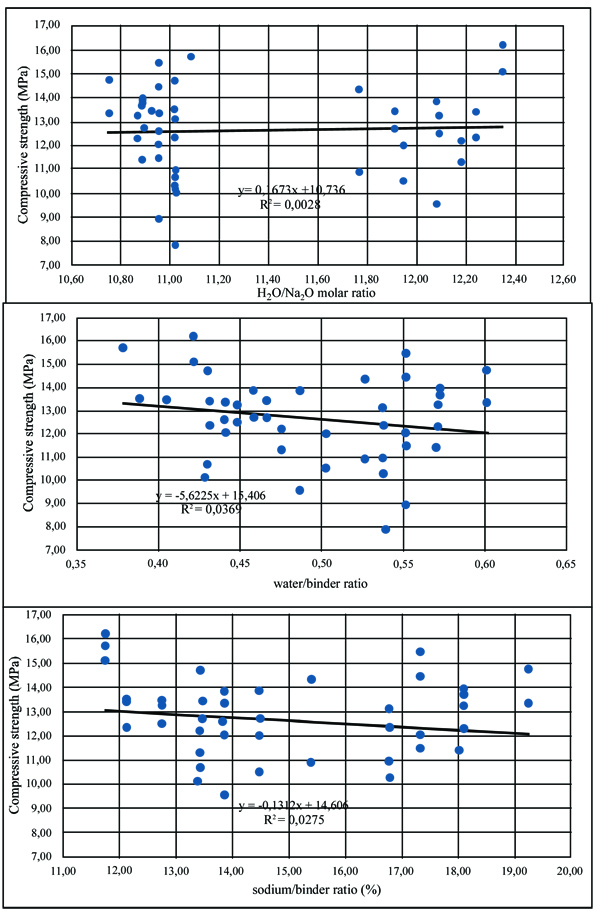
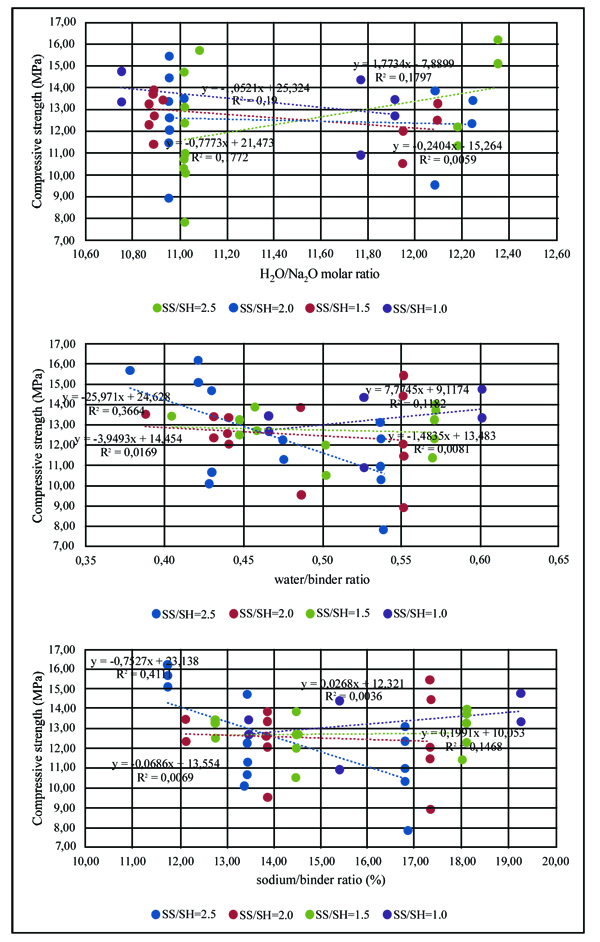
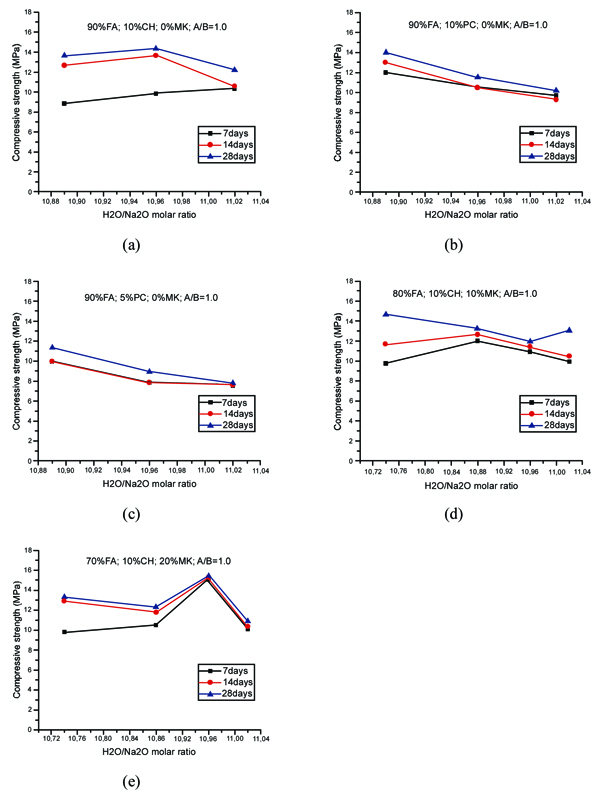
The compressive strength of geopolymer mortars for the mixtures with A/B=1 is shown in Fig. (3). After 14 curing days, all mixtures have reached the majority of their compressive strength. This is independent of the partial replacement of fly ash by metakaolin, OPC or calcium hydroxide. Mixture 70FA_10CH_20MK_2.0SS/SH_1.0A/B showed a high compressive strength after 7 days of curing of almost 16 MPa, remaining unaltered for longer curing periods. The explanation may lie in the use of a high content of metakaolin, which is a very reactive aluminosilicate. All mixtures showed a compressive strength below 16 MPa. This value is lower than the typical compressive strength of geopolymers that can attain a compressive strength around 40-60 MPa after 28 curing days. One explanation concerns the fact that a lesser amount of sodium silicate was used. Also, no heat curing was used, although previous investigations [34-36] have shown that heat curing is crucial for the mechanical performance of fly ash-based geopolymers. Recent findings confirm this [13, 37]. Another explanation could be related to a lesser reactivity of the fly ash used in this study compared to the reactivity of fly ash used. As noticed by other authors [38], this is a critical parameter for high mechanical strength based geopolymers. The results show that the replacement of calcium hydroxide by Portland cement leads to lower compressive strength. This could be explained because the CSH gel, that is responsible for the strength of OPC, is retarded by the preferential reactions of calcium and silicon in the geopolymerization allowing the geopolymer to consume the available silica before calcium precipitation has began [39]. However, other authors (Pangdaeng et al., 2014) mention that the replacement of calcium hydroxide contributes to a reduction of CSH and to a lower compressive strength. In relation to the sodium silicate to sodium hydroxide (SS/SH) ratio, it can be seen that the maximum compressive strength is different for different SS/SH ratios in the different mixtures. For instance, while the mixtures based on 90% fly ash plus 10% calcium hydroxide have a maximum mechanical strength for an SS/SH of 2, the mixtures in which calcium hydroxide is replaced by Portland cement have a maximum compressive strength for an SS/SH of 1.5. This could mean that the new Si species provided by OPC require less soluble silicate. Pacheco-Torgal et al. [40] noticed the need for slightly higher SS/SH ratios for attaining optimum mechanical performance. Recently, Suksiripattanapong et al. [41] reported an optimum Na2SiO3/NaOH mass ratio of 4 for enhancing the mechanical strength of sludge-fly ash geopolymers. This means that geopolymers based on different precursors and with different additives have different optimum SS/SH ratios. Figs. (4 and 5) shows the compressive strength results for the mixtures with an A/B=0.8 and A/B=0.7. Again, it can be seen that the majority of strength development, takes place on the first seven days of curing. It is also noticeable that the reduction in the amount of activator is not translated automatically into a decrease in the maximum compressive strength (maybe because the reduction of the activator is associated with a reduction in the workability of the mortars possessing increased internal porosity). Fig. (6) provides a clear picture of the influence of the activator/binder mass ratio on the compressive strength. Fig. (7) shows the plot of all compressive strength values for 28 days curing versus the H2O/Na2O molar ratio, the water/binder ratio and the sodium/binder ratio. From the analysis of the plots, no clear correlation can be established. This means that, in geopolymers, such correlations are very much dependent on the composition of the mixtures. However, if the plotted compressive strength results were aggregated according to their Na2SiO3/NaOH mass ratio, a superior correlation rate would be noticed (Fig. 8). Fig. (9) shows the compressive strength versus H2O/Na2O molar ratio according to curing periods for geopolymer mortars with an A/B=1. There is a general trend that links an increase in the compressive strength with the decrease of H2O/Na2O molar ratio, the most obvious being the mixture with 90% fly ash and 10% OPC. Still, some exceptions can be noticed for mixtures with partial replacement of fly ash by metakaolin. Nevertheless, the results must be seen bearing in mind that the variations in the H2O/Na2O molar ratio between the different mixtures are minor. That fact helps to understand why the typical sharp curve is absent.
3.2. Microstructure
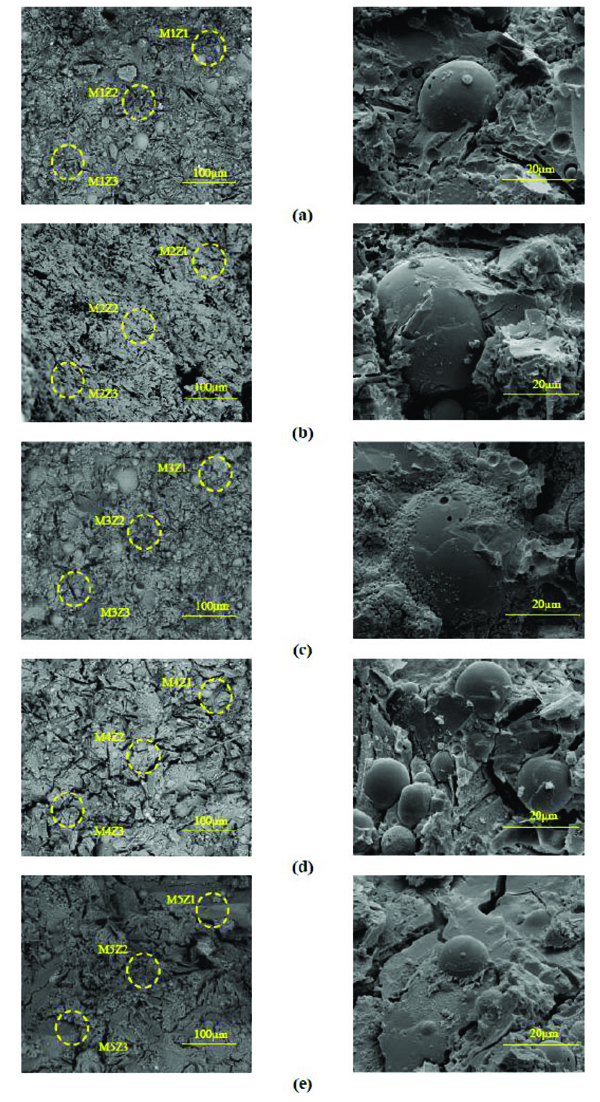
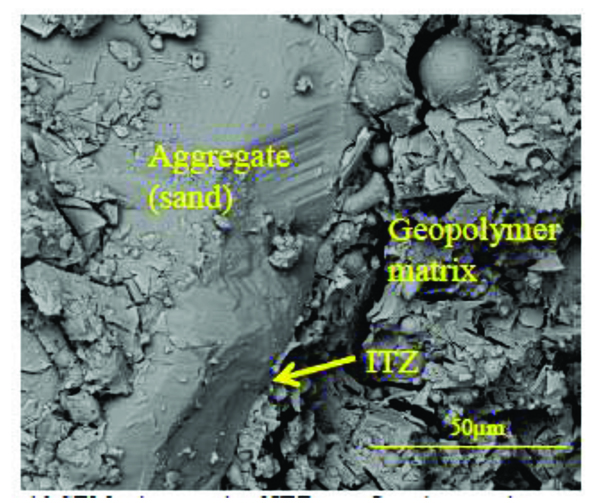
The general view of the microstructure of the selected mortars is presented in Fig. (10). The presence of unreacted fly ash particles is detected in all mixtures. The microstructure of the mixture with the highest 28 days compressive strength (14.5 MPa) seems to be denser and uniform (Fig. 10c) when compared to mixtures with lower strength. The micro-cracks visible in Fig. (11e) are consistent with the fact that this mixture has a lower 28 days compressive strength of 10.9MPa. Traditional porous Interfacial transition zone-ITZ seen in OPC microstructure was not detected in the geopolymeric mixtures studied in the current investigation (Fig. 11). Table 4 presents the atomic ratios for the different geopolymeric mixtures. The atomic SiO2/Al2O3 is always higher than that of SiO2/Al2O3 ratio obtained for pure fly ash and pure metakaolin. This suggests the formation of hydration products due to the presence of Si species from the incorporation of sodium silicate in the mixtures. All the compositions showed low CaO/SiO2 ratios between 0.12 and 0.21. This is very different from typical C/ratios in OPC chemistry that range from 2.5 to 2.0 [42]. This could be due to the replacement of Na with Ca2+ in the CSH matrix. In fact, some authors [43] already demonstrated that sodium incorporation in the CSH phase increases as C/S ratio decreases.
| Ratios | FA | MK | M1 90%FA;10%CH; SS/SH=2.5; A/B=1.0 |
M2 90%FA;10%CH; SS/SH=2.0; A/B=0.8 |
M3 90%FA;10%CH; SS/SH=2.0; A/B=1.0 |
M4 80%FA;10%CH; 10%MK; SS/SH=2.5; A/B=1.0 |
M5 70%FA;10%CH; 20%MK; SS/SH=2.5; A/B=1.0 |
||||||||||
|---|---|---|---|---|---|---|---|---|---|---|---|---|---|---|---|---|---|
| Z1 | Z2 | Z3 | Z1 | Z2 | Z3 | Z1 | Z2 | Z3 | Z1 | Z2 | Z3 | Z1 | Z2 | Z3 | |||
| SiO2/Al2O3 | 4.55 | 2.60 | 7.20 | 7.70 | 7.30 | 9.90 | 8.0 | 10.1 | 5.86 | 6.14 | 5.80 | 7.69 | 9.20 | 6.77 | 7.64 | 5.80 | 4.48 |
| Al2O3/Na2O | 9.65 | 75.0 | 0.31 | 0.32 | 0.57 | 0.48 | 0.59 | 0.50 | 0.67 | 0.61 | 0.65 | 0.66 | 0.48 | 0.50 | 0.49 | 0.46 | 0.64 |
| CaO/ SiO2 | 0.02 | * | 0.14 | 0.17 | 0.15 | 0.19 | 0.19 | 0.20 | 0.17 | 0.21 | 0.18 | 0.13 | 0.12 | 0.17 | 0.13 | 0.18 | 0.16 |
| Na2O/CaO | 1.27 | * | 3.31 | 2.43 | 1.62 | 1.09 | 1.12 | 1.28 | 1.47 | 1.26 | 1.46 | 1.57 | 1.88 | 1.90 | 2.10 | 2.10 | 2.25 |
| MgO/ Al2O3 | 0.24 | * | 0.16 | 0.36 | 0.18 | 0.19 | 0.25 | 0.19 | 0.22 | 0.21 | 0.22 | 0.18 | 0.15 | 0.19 | 0.07 | 0.14 | 0.86 |
| Fe2O3/ Al2O3 | 0.21 | 0.04 | 0.14 | 0.27 | 0.23 | 0.33 | 0.27 | 0.26 | 0.22 | 0.25 | 0.22 | 0.18 | 0.16 | 0.22 | 0.13 | 0.21 | 0.10 |
3.3. FTIR analysis
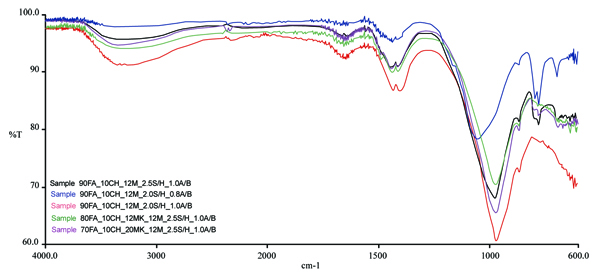
The IR spectra of five geopolymer mixtures are presented in Fig. (12). The peaks centered around 970 cm-1 for all geopolymeric mixtures are characteristic of a geopolymerization reaction corresponding to the Si–O–Al stretching vibration. Typical Si–O–Si stretching vibration at 1057 cm-1 has been noticed for the mixture with the lowest A/B ratio. For this mixture, a very sharp peak at 777 cm-1 corresponding to Al(IV)-O stretching vibration can also be seen. Si–OH bending vibration at 865 cm-1 was noticed for the fly ash mixtures with the A/B=1. The absorption bands around 1434 cm-1 for all geopolymeric mixtures are attributed to stretching vibrations of CO32- ions [44], thus confirming the existence of carbonate species in all tested mixtures. Concerning the geopolymeric fly ash based mixtures, the use of a lower activator/binder ratio is associated with a decrease in the hydration water band at 3355 cm-1. A water hydration band at 1643 cm-1 [45] can be seen for both metakaolin based mixtures.
3.4. Cost Analysis
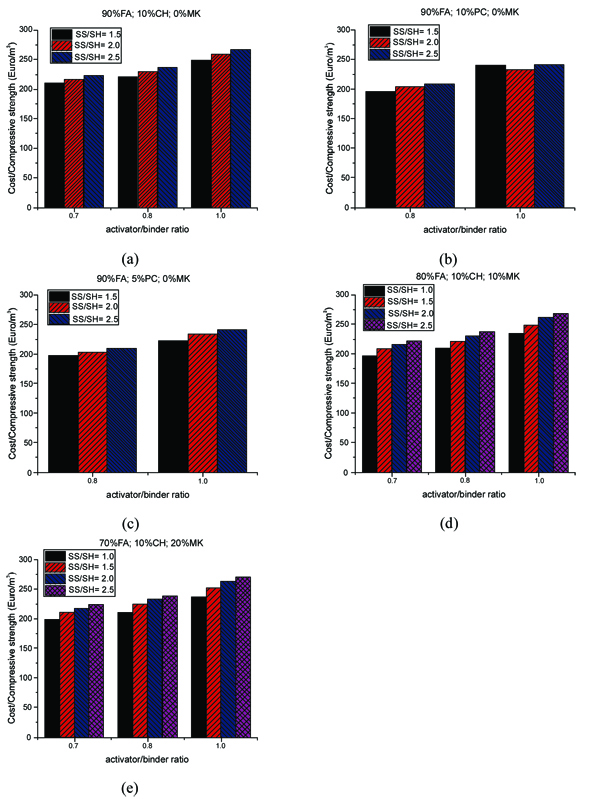
Fig. (13) shows the ratio of the cost per cubic meter with respect to the activator/binder mass ratio and sodium silicate/sodium hydroxide ratio. The cost of the mixtures increases as the activator/binder ratio also increases. Also, the lower the Na2SiO3/NaOH ratio, the lower the cost. The mixtures have a minimum cost of around 200 euro/m3 and this can be obtained for mixtures with, both, fly ash or metakaolin and with the introduction of different additives (OPC or calcium hydroxide). The lowest cost per cubic meter can be achieved when both ratios of activator/binder and sodium silicate/ sodium hydroxide are lower for all studied mortars. This was also reported by other authors [11], and can be explained by the cost fraction of the activator in the mixtures.
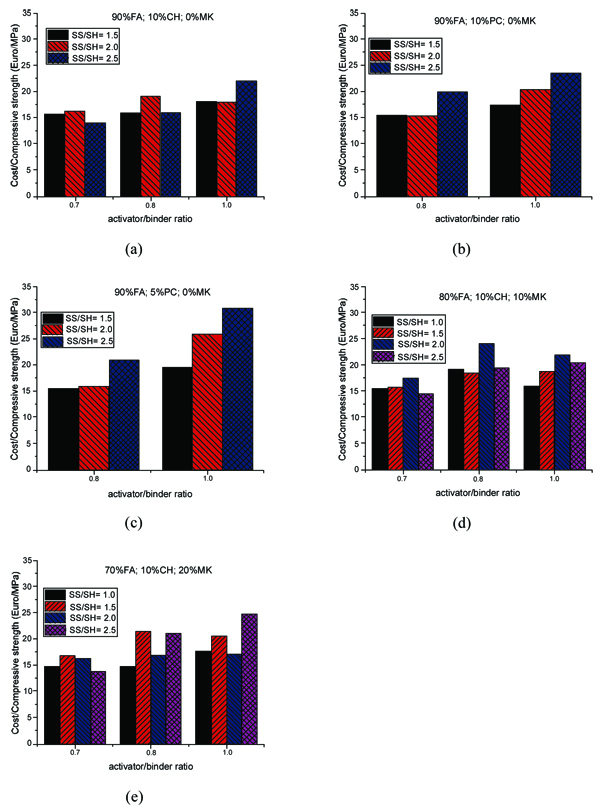
This fraction can reach up to 80% of the total cost. In the mixtures with calcium hydroxide (Fig. 13a), the activator/binder ratio of 0.7 shows that the cost/compressive strength ratio is lower than higher activator binder/ratios. The mixtures with cement and metakaolin at several activator/binder ratios are shown in Fig. (13b, c, d, e). The observations are quite similar to those already made for calcium hydroxide mixtures. The cost/compressive strength ratios versus activator/binder ratios for all studied mortars are shown in Fig. (14).
It is interesting to remark that comparing between mixtures with Portland cement and calcium hydroxide, the latter mixtures always reveal higher cost/compressive strength ratio due to the fact that Portland cement is less expensive than calcium hydroxide (one-third). The results suggest that using a lower activator/binder ratio (e.g. 0.8) may improve the cost efficiency of the geopolymer mortar with Portland cement as the ratio of cost/compressive strength is minimum when the ratio of sodium silicate/ sodium hydroxide decreases.
However, unlike the observation made for Portland cement (see Fig. 14b, c), a reduction in the ratio of cost/compressive strength was noticed for the mixtures with sodium hydroxide and metakaolin, particularly, at the lower activator/binder ratio of 0.7, when the ratio of sodium silicate/sodium hydroxide is 2.5 (Fig. 14a, d, e).
CONCLUSION
The results show that the highest compressive strength observed is below 16 MPa at 28 curing days. This low figure may be due to the absence of heat curing. The use of the Portland cement additive leads to lower compressive strength because of the preferential reactions of calcium and silicon in the geopolymerization. Results also show that geopolymers with different additives have different optimum Na2SiO3/NaOH. The cost of the mixtures decreases with the reduction of the activator/binder ratio. Also, the lower the Na2SiO3/NaOH ratio, the lower the cost. EDS analysis shows that the different mixtures demonstrate low CaO/SiO2 ratios between 0.12 and 0.21. These are very different from typical C/ratios in OPC chemistry. A minimum cost of 200 euro/m3was found for the studied fly ash geopolymeric mixtures. Further investigations regarding the influence of even lower activator concentrations are needed to attain higher cost efficiency.
CONSENT FOR PUBLICATION
Not applicable.
CONFLICT OF INTEREST
The authors declare no conflict of interest, financial or otherwise.
ACKNOWLEDGEMENTS
Funding: This study was funded by Foundation for Science and Technology (FCT) in the frame of project IF/00706/2014-UM.2.15.

