All published articles of this journal are available on ScienceDirect.
Hourly and Daily Traffic Expansion Factors on Selected Roads in Gaza, Palestine
Abstract
Background:
The shortage of sufficient, reliable and continuous traffic data in many developing countries makes it difficult for traffic engineers and researchers. Traffic data are essential for both planning and design of transportation facilities.
Objective:
This work tries to provide data that in order to help local experts in Gaza city to provide better estimates of the average daily traffic (ADT) and hence better transportation facilities.
Methods:
The analysis and discussion are based on continuous traffic flow counts conducted on three selected main streets in Gaza. Data were collected for 24 hours on seven consecutive days on each street.
Results:
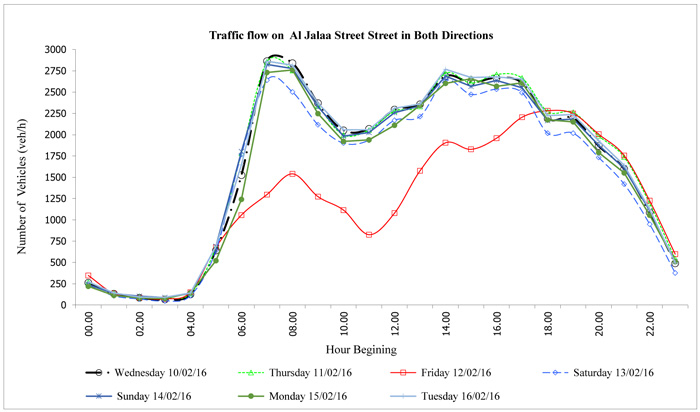
The results indicate that the average hourly expansion factors(HEFs) have a margin of error for the period between 7:00 and 16:00 that does not exceed ±3%. The results also indicate that the average daily expansion factors (DEFs) on the three streets have a maximum margin of error of 3.2% on both Sunday and Monday. On the other hand, the analysis proved that the maximum peak hour volume was 2864 vehicles/hour on Al Jalaa Street between 7:00 and 8:00 and the average peak-to-daily ratio (p/d) of the three streets was found to be 7.18%. The maximum directional traffic split (D) was found to be 60% in the heaviest direction of traffic flow during the peak period.
Conclusion:
The HEFs and DEFs produced in this work can be used with a 95% confidence on the main streets of Gaza city.
1. INTRODUCTION
Data collection of road traffic is very important and essential for traffic engineers in order to help achieving a safe and efficient travel journey in urban and rural environments. Many developing countries suffer from the lack of sufficient, reliable and continuous road traffic data. Therefore, traffic engineers in these countries usually rely on short-term traffic counts and estimations. In many cases, they use other countries traffic expansion factors in their design calculations and they generally do so without prior local verifications. Almasri, Sarraj and Eljamassi indicated that developing cities face several challenges in their planning efforts and development of transportation facilities. One of these challenges is the lack or absence of transportation data such as traffic flow, vehicular speed and delay that are used to evaluate the current traffic situation [1]. It is, therefore, very important to work on providing more road traffic data. These data should be reliable, accurate and as comprehensive as possible.
This research tries to provide information based on scarcely available local road traffic counts. The main objective is to generate an accessible reference that provides hourly and daily traffic expansion factors on three selected main roads in Gaza city, for the benefit of traffic engineers, experts, researchers as well as students.
2. BACKGROUND
Traffic flow usually varies from hour to hour, from day to day and from season to season. This characteristic of traffic flow implies that traffic engineers should deal carefully and wisely with traffic flow information. It is simply not acceptable to estimate the traffic flow on one day (24 hours) by counting flow in one hour of that day and multiplying its value with 24. The hour-to-hour variation of traffic flow creates peak periods and hence it is very essential to determine the morning and evening peaks for the purpose of design among other important purposes. Nicholas Garber and Lester Hoel in their respected and well-known book; Traffic and Highways Engineering, illustrated that “Although traffic volume at a section of a road varies from time to time, this variation is repetitive and rhythmic” [2]. They also indicated that these characteristics of traffic volume are very useful when traffic counts are being planned. This also means that traffic volumes collected at different times or places can be related to each other and knowledge of these characteristics of traffic flow can be used to estimate the accuracy of traffic counts.
Bonsall and O'Flaherty [3] stated, “information on the flow of vehicles past a given point in a specified time period provides a key input to decisions on the planning, design and operation of transport systems.” They also mentioned that “if data are collected at a site on a continuous basis for a year or more, then quantities can be calculated precisely in arrears, but if the count is of limited duration, it becomes necessary to make estimates based on what is known about seasonal flow patterns at other sites.” In many cases, it is important to estimate the annual average daily (AADT), the average daily traffic (ADT), the peak hour period and the peak hour flow for a specific site. Leduc considers the AADT as a crucial raw traffic data for countless of applications and its estimation methodology is typically based on both continuous and temporary traffic counts that are afterwards used as inputs to sophisticated mathematical models [4].
In the UK, the Traffic Appraisal Manual [5] indicates that a short period count can be used to provide estimates of traffic flows of sufficient accuracy for some purposes. It gives an example that a 4-hour count of vehicles might be used to estimate the annual flow with a coefficient of variation of about 10% for an urban road. It also suggests that a short period count be factored up to 16 hours, and then the 16-hour estimate to be factored up to AADT.
The Department for Transport in the UK devised expansion factors for estimating AADT from short period counts at various times of year. It should be noted that the expansion factors are different for different types of road [3]. According to that, AADT can be estimated from very short counts such as 2-hour counts. However, longer counts are expected to give a better estimate and traffic flow estimates derived from short period counts should be treated with considerable caution. This is due to the changeable characteristic of traffic flows, because it might be distorted by public holidays and changes in weather conditions.
The Traffic Appraisal Manual indicated in 1997 that the use of national (rather than local) expansion factors for converting short period counts to AADT and other periods is now no longer recommended. Local Automatic Traffic Count data should be used instead [6].
Garber and Hoel [2] stated: it is common that in less developed cities, traffic flow counts of durations shorter than 24 hours are required in many situations to be expanded to 24-hour volumes. This is also necessary when estimations of the ADT or AADT are needed quickly or when the available budget is very limited. In order to work out such expansion of traffic counts, hourly expansion factors are used. These factors can be determined using data obtained at continuous count stations. Hourly expansion factors (HEFs) are determined by the formula [2]:
 |
The HEFs are used to expand traffic counts of durations shorter than 24 hours to 24-hour volumes by multiplying the hourly volume for each hour during the short count period by the HEF for that hour and finding the mean of these products.
It is also possible to expand traffic volumes collected on a particular day of the week in order to get estimates of the average flow per day in that week. For this purpose, Daily Expansion Factors (DEFs) are computed. DEF is determined by the formula [2]:
 |
The DEFs are used to determine the total traffic volume per week from counts of 24-hour duration by multiplying the 24-hour volume by the DEF. The result is then divided by 7 in order to determine an estimate of the average flow per day (ADT) in that week.
Moreover, estimates of the Average Annual Daily Traffic (AADT) can be computed using Monthly Expansion Factors (MEFs), which are computed as [2]:
 |
Therefore, given the ADT value for a particular month in a given year; the AADT for this year may be obtained by multiplying this ADT by the MEF.
The above expansion factors should be determined for each class of road in the classification system established for an area. Major roads may be classified as freeways, expressways, and major arterials. However, minor roads may be classified as residential, commercial, and industrial streets. Each class should consist of highway links with similar traffic patterns and characteristics. A highway link is defined for traffic count purposes as a homogeneous section that has the same characteristics, such as AADT, and daily, weekly, and seasonal variations in traffic volumes at each point [2].
3. CHALLENGES OF TRAFFIC DATA COLLECTION IN GAZA
The city of Gaza is located in the Gaza Strip that lies on the eastern coast of the Mediterranean Sea. Gaza is the biggest city in Gaza Strip with a total area of about 56km2 and a total population of more than 625 thousand. The total length of roads is more than 900km where less than 38% of which is paved [7]. The total number of registered vehicles in the city is estimated at about 40,000 out of 70,531; the total number of registered vehicles in Gaza Strip by the end of 2017.
Traffic data collection in Gaza Strip is currently suffering from several difficulties and hitches. The most important one is the lack of a formal or official body that is responsible for organizing and achieving this task. Bashbash and Sarraj [8] said that “The available traffic statistics in Gaza city are chaotic and without good management.” After the Israeli occupation of Gaza Strip in 1967, limited traffic flow surveys used to be conducted by the Occupation Authorities. Some results of these surveys used to be published quarterly between 1970 and 1994. After the establishment of the Palestinian National Authority (PNA) in 1994, some efforts were exerted by the Ministry of Planning and International Cooperation (MOPIC). They started by continuing publishing the quarterly Statistical Bulletin which used to be published before. One example of such publications was issued in November 1995. This particular bulletin contained data on several subjects including transportation. The information on transportation included statistics on the following topics:
- Drivers and vehicles registered in Gaza Strip by type of vehicle.
- Road accidents by casualty severity of accidents.
- Traffic flow counts on selected roads in Gaza Strip.
The traffic flow counts were conducted on 32 locations across Gaza Strip, about 44% of these locations were in Gaza city. The traffic counts were classified by vehicle type and were conducted for duration of 12 hours at each location [9]. In 1996, a traffic survey was also conducted by MOPIC in cooperation with the Civil Engineering Department at the Islamic University of Gaza. This survey involved collection of traffic flow counts at 16 main road intersections on Salah El-Deen Road in Gaza Strip; the main arterial road that connects BeitHanoun in the north with Rafah in the south. Traffic flow was counted for a period of 12 hours for one day [10].
Other studies were also carried out on traffic flow and published some reports that included limited traffic statistics. Two of these publications were released by NATUF for Environment and Development, which is a local NGO. NATUF published a report that summarizes traffic data collected at 5 main road intersections in Gaza city [11] and another report that describes a detailed traffic study on the city of Rafah [12]. In 2007, Yahya Sarraj prepared a report that collected and analysed several traffic surveys conducted in Gaza Strip between 1994 and 2006 [13]. In 2010, the Ministry of Planning released a report on the sectorial planning of roads and transportation, which included data on traffic flow and other traffic-related useful information [14]. However, none of the mentioned studies provided any estimation of hourly, daily or monthly expansion factors and most traffic surveys were made for periods less than 24 hours.
4. DATA COLLECTION
The findings of this paper are based on recently collected continuous traffic flow counts on three main roads in Gaza city. The traffic counts were part of the graduation project of three civil engineering students; supervised by Dr Yahya Sarraj [15]. The project involved the collection of classified traffic flow counts for 24 hours on seven consecutive days at three different locations. The traffic flow counts were carried out between February 10thand March 15th2016. Data were collected using a digital video camera and the recordings were manually analysed at the office.
4.1. Location of Counts
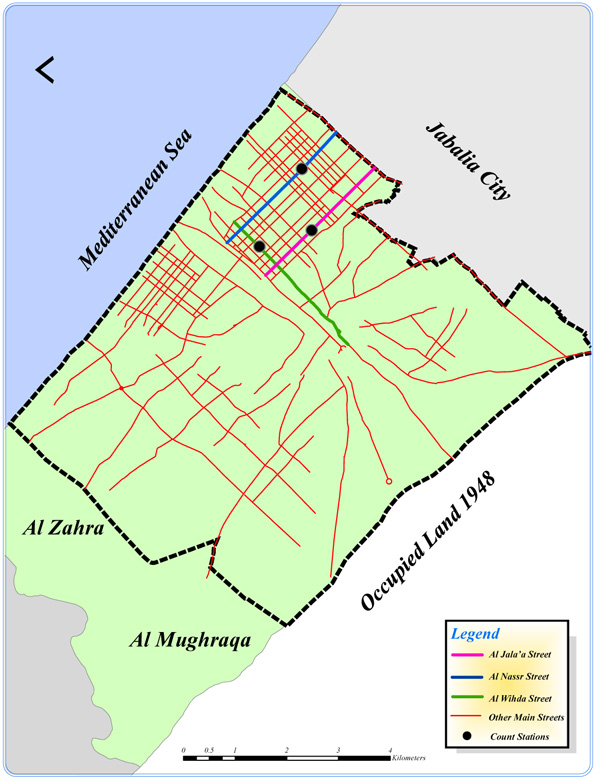
Continuous traffic flow counts were conducted for a period of a week on each of the selected three main roads in Gaza city; AlJala'a, AlNassr and AlWehda Streets. The locations of traffic flow counts are shown in Fig. (1).
5. DISCUSSION
5.1. Al Jalaa Street
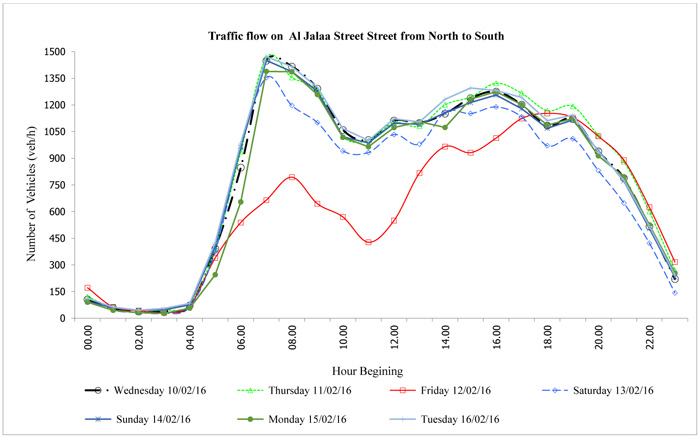
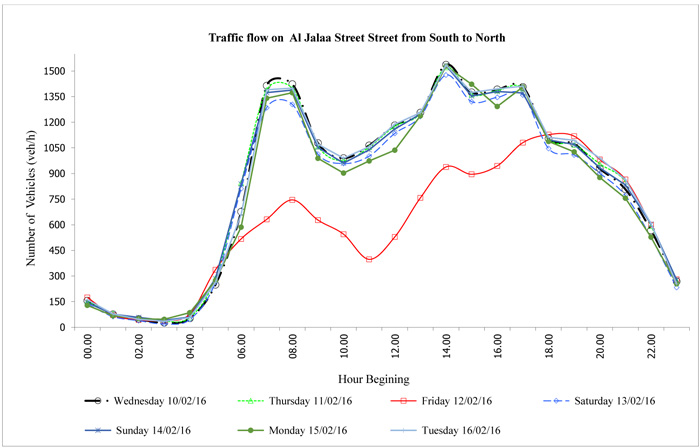
Al Jalaa Street is one of the main roads in the city of Gaza. It is about 3,000m long and 30m wide, connecting between Omar AlMukhtar Street (the most famous road in Gaza) in the south and Salah Khalaf Street in the north. Data were collected on this road on seven consecutive days for 24 hours per day, starting on Wednesday 10th of February 2016 up to Tuesday the 16thof the same month. Figs. (2, 3 and 4) show the 24-hour distribution of traffic flow for seven days in both directions of travel. These figures clearly indicate that traffic flow distribution is almost identical during weekdays (Sunday to Thursday). The distribution on Friday is also almost identical in both directions of travel but different from weekdays flow. Traffic flow pattern on Saturday differs slightly from the weekday pattern.
5.2. Hourly Expansion Factors
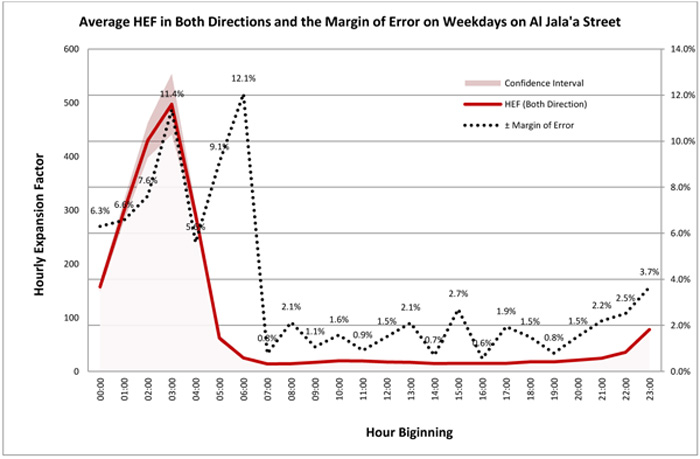
The hourly expansion factor (HEF) was calculated for every hour on the seven days of the week. The analysis of results indicated that the HEF values on the weekend differ from those on the weekdays. Therefore, the hourly expansion factor (HEF) was considered for every hour on the five working days (Sunday to Thursday), in order to increase accuracy and to avoid differences in the weekend (Friday and Saturday). The results exhibited in Fig. (5) indicate that the average HEF for the period midnight to 6 hours is fluctuating widely from day to day. However, the HEF for the period from 7 am to 23hours is almost the same for every hour in this period on all working days. This is emphasized further by exhibiting the margin of error, which shows the expected margin of error at a 95% confidence. It is clear that the margin of error in the period from midnight to 6:00 am is between ±5.6% and ±12.1%. However, it is less than ±4% between 7:00 am and 23:00 hours. It is also shown that this margin of error is less than 2% at the majority of hours in this range. Therefore, it is likely to suggest using the average value of the HEF between 7 and 23 with good confidence.
5.2.1. Al Nassr Street
Al Nassr Street is another main road in the city of Gaza that runs in the north-south direction; parallel to Al JalaaStreet. It is about 2,900m long and 25m wide, connecting between Omar AlMukhtar Street in the south and Salah Khalaf Street in the north. On this road, data were collected on seven consecutive days for 24 hours per day, starting on Wednesday 17th of February 2016 up to Tuesday the 23rd.
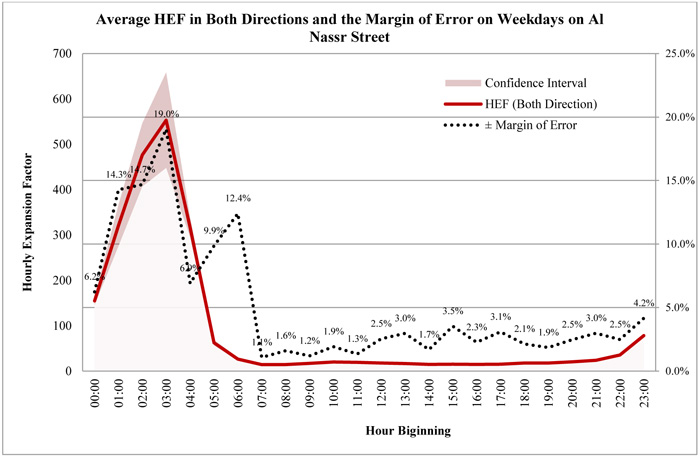
The hourly expansion factors (HEF), exhibited in Fig. (6), indicate that the values on Al Nassr Street follow the same pattern of the respected values on Al Jalaa Street. However, the confidence interval calculation indicates that the average value of the HEF with a 95% confidence interval has a possible range of error that does not exceed ±19%. However, if the average value of the HEE was considered in the period between 7:00 and 23:00 hours the range of error turns out to be between ±1.1% and ±4.2%.
5.2.2. Al Wehda Street
Al Wehda Street is a main road in the city of Gaza that runs in the east-west direction. It is about 3,367m long and varies in width between 16m and 20m. It starts from the west at the main entrance of the central hospital of Gaza Strip (Al Shifa Hospital)forming a T- road intersection with Ezidin Al Qassam Street. It runs towards the east up to its intersection with Salah El-Din Road at the Shijaea District forming a 4-arm road intersection where the eastern arm is named Baghdad Street. Traffic flow data on this street were also collected on seven consecutive days for 24 hours a day, starting on Wednesday 9th of March 2016 up to Tuesday the 15th of the same month.
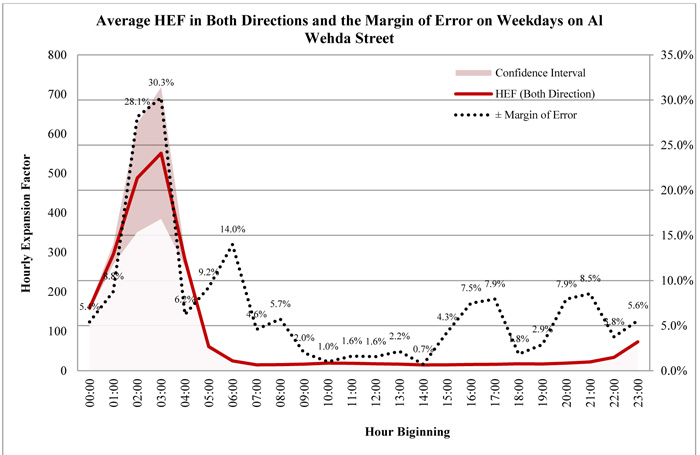
The hourly expansion factor (HEF) was calculated for every hour on the seven days of the week. However, the values of the HEF on the weekdays were only considered in order to avoid difference in the traffic flow pattern at the weekend. The results exhibited in Fig. (7) indicate that the HEF values follow the same pattern of the respected values on Al Jalaaand Al Nassr Streets. However, the confidence interval calculations indicate that the average value of the HEF with a 95% confidence interval has a possible range of error that slightly exceeds ± 30% at 3:00 am but falls down to less than ± 1% at 14:00. It is also found that the margin of error at 95% confidence in the period between 7:00 to 23:00 is between ±0.7% and ±8.5%.
5.2.3. Recommended HEFs for Gaza City, Palestine
Further to the above calculations of the HEF on each of the selected main streets. The average HEF on the three streets was determined. The findings lead to the conclusion that the HEFs calculated for traffic flow in both directions on the three studied main streets in Gaza city can be used with 95% confidence, (Fig. 8). It is recommended to exclude Friday and Saturday and to use the HEFs at certain hours of weak days in order to get even more accurate estimations of the daily traffic. It is also found that HEFs in the interval from 7:00 to 23:00 are more reliable as the margin of error in this period at a 95% confidence is reduced and does not exceed ±5%. Furthermore, it is recommended to use HEFs at the hours between 7:00 and 16:00, as the margin of error in this period is limited to a maximum value of ±3%.
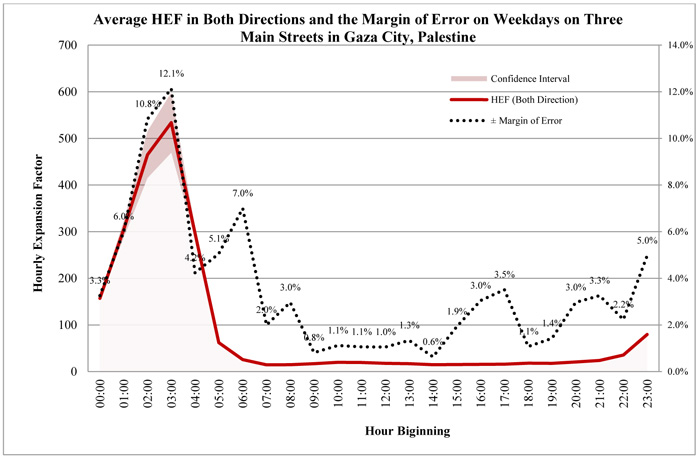
On the other hand, it is recommended to use the average value of each street if the estimation of daily traffic is required on this particular street. However, the average value of the HEF of the three studied streets may be utilized if the required estimation is for daily traffic flow on other streets in the city of Gaza. Table 1 exhibits the values of the recommended HEFs for each hour of the day on each of the investigated streets. The table also presents the recommended average values of the three streets as well as the estimated margin of error at each hour of the day. Figure 8 shows the average HEF at each hour of the day with the estimated margin of error. This figure provides a graphical presentation of the recommended hours of the day, which are expected to provide the most accurate estimation of daily traffic flow in the city of Gaza.
| Average HEF in Both Directions | Margin of Error | ||||||
|---|---|---|---|---|---|---|---|
| Day | (Sunday to Thursday) weekdays only | ± | |||||
| From | To | Al Jalaa St | Al Nassr St | Al Wehda St | Three Streets | Three Streets | |
| 00:00 | 01:00 | 157.55 | 154.77 | 159.12 | 157.15 | 3.3% | |
| 01:00 | 02:00 | 298.89 | 320.54 | 294.91 | 304.78 | 6.0% | |
| 02:00 | 03:00 | 430.30 | 476.44 | 488.24 | 464.99 | 10.8% | |
| 03:00 | 04:00 | 497.21 | 553.06 | 550.97 | 533.74 | 12.1% | |
| 04:00 | 05:00 | 292.30 | 316.37 | 281.86 | 296.84 | 4.2% | |
| 05:00 | 06:00 | 62.15 | 62.55 | 61.10 | 61.93 | 5.1% | |
| 06:00 | 07:00 | 25.19 | 26.47 | 24.91 | 25.52 | 7.0% | |
| 07:00 | 08:00 | 14.02 | 14.24 | 14.86 | 14.37 | 2.0% | Recommended HEFs |
| 08:00 | 09:00 | 14.22 | 14.34 | 15.56 | 14.71 | 3.0% | |
| 09:00 | 10:00 | 17.01 | 17.06 | 16.91 | 16.99 | 0.8% | |
| 10:00 | 11:00 | 19.82 | 20.02 | 19.36 | 19.73 | 1.1% | |
| 11:00 | 12:00 | 19.54 | 19.37 | 18.86 | 19.26 | 1.1% | |
| 12:00 | 13:00 | 17.63 | 17.67 | 17.52 | 17.60 | 1.0% | |
| 13:00 | 14:00 | 16.90 | 16.69 | 16.74 | 16.78 | 1.3% | |
| 14:00 | 15:00 | 14.72 | 14.83 | 14.80 | 14.78 | 0.6% | |
| 15:00 | 16:00 | 15.12 | 15.16 | 14.95 | 15.08 | 1.9% | |
| 16:00 | 17:00 | 14.95 | 14.86 | 15.96 | 15.26 | 3.0% | |
| 17:00 | 18:00 | 15.15 | 15.19 | 16.50 | 15.62 | 3.5% | |
| 18:00 | 19:00 | 17.98 | 17.65 | 17.73 | 17.79 | 1.1% | |
| 19:00 | 20:00 | 17.97 | 17.63 | 17.21 | 17.61 | 1.4% | |
| 20:00 | 21:00 | 20.99 | 20.51 | 19.53 | 20.34 | 3.0% | |
| 21:00 | 22:00 | 24.39 | 23.90 | 22.58 | 23.62 | 3.3% | |
| 22:00 | 23:00 | 35.66 | 35.44 | 34.16 | 35.09 | 2.2% | |
| 23:00 | 00:00 | 77.87 | 78.13 | 73.08 | 76.36 | 5.0% | |
The HEFs presented in Table 1 were compared with HEF determined in Rafah in 2007 [12]. The comparison showed that the values in Rafah are different from the values in Gaza city. However, the difference gets smaller in the morning and evening peaks.
5.3. Daily Expansion Factors
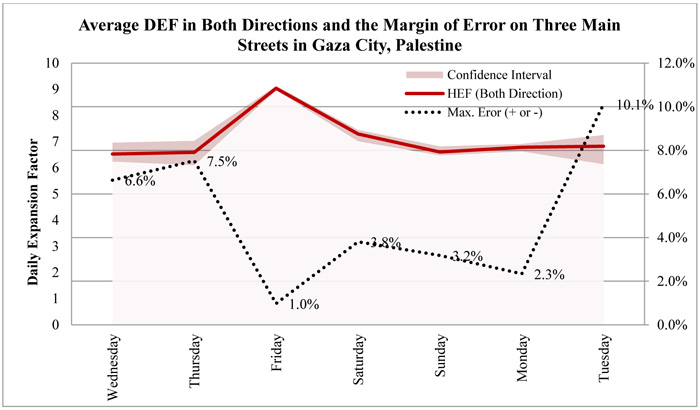
As indicated above, traffic flow data were collected in February and March 2016 on three main streets in Gaza city, Palestine. The Traffic flows per day on the three main roads are shown in Table 2 for every day of the week. The table exhibits traffic flow per 24 hours and the Daily Expansion Factors (DEF) in both directions of traffic. The average value of the DEF on the three streets was calculated for each day. This value is recommended to be utilized in estimating the Average Daily Traffic (ADT) on other main streets in Gaza city. However, the DEF calculated for each street is recommended to be used for estimating the ADT on that particular street. This is expected to result in more accurate estimations of ADT. The expected range of error was calculated for each day of the week. The results indicated that the margin of error is between +6.7 and -10.1%. Although Friday has the lowest margin of error, Sunday and Monday are probably the best days to get the most accurate estimation of ADT. This is because they have the lowest margin of error among weekdays and they are more likely to represent an average day of the week. Fig. (9) shows the different values of the DEF of each day of the week on the three streets, the average DEFs as well as the expected margin of error.
| Day | Daily Traffic Flow and Daily Expansion Factors in Both Directions | ||||||||
|---|---|---|---|---|---|---|---|---|---|
| Al Jalaa Street | Al Nassr Street | Al Wihda Street | Average | Range of Error | |||||
| veh/day | DEF | veh/day | DEF | veh/day | DEF | DEF | |||
| Sunday | 39631 | 6.68 | 30490 | 6.4 | 22889 | 6.75 | 6.61 | 3.2% | -2.1% |
| Monday | 38115 | 6.94 | 29309 | 6.65 | 22857 | 6.76 | 6.78 | 1.9% | -2.3% |
| Tuesday | 40332 | 6.56 | 30485 | 6.4 | 20547 | 7.52 | 6.82 | 6.3% | -10.1% |
| Wednesday | 39686 | 6.67 | 28610 | 6.82 | 25344 | 6.09 | 6.53 | 6.6% | -4.5% |
| Thursday | 40506 | 6.53 | 27530 | 7.08 | 25115 | 6.15 | 6.59 | 6.7% | -7.5% |
| Friday | 29240 | 9.05 | 21404 | 9.11 | 17256 | 8.95 | 9.04 | 1.0% | -0.8% |
| Saturday | 37110 | 7.13 | 27195 | 7.17 | 20405 | 7.57 | 7.29 | 2.2% | -3.8% |
| Total(veh/week) | 264,620 | 195,023 | 154,413 | ||||||
5.4. Peak Period and Peak Hour Volume
It is also worth to indicate the peak period on the studied three main streets. The analysis of the peak period shows that the peak hour does not occur at the same time on every day of the week. The peak flow also occurs at different times in each direction of traffic. Table 3 exhibits the peak period and the peak hour volume on each day of the week in both directions of flow. The results indicate that the peak flow occurs in the morning between 7:00 and 8:00 on most days of the week. However, on Al Wehda Street the peak period mostly occurred in the evening between 14:00 and 16:00 on three days of the week. On Friday, the peak occurred between 18:00 and 19:00 on the three streets.
| Street | Al Jalaa Street | Al Nassr Street | Al Wehda Street | |||
|---|---|---|---|---|---|---|
| Day | Peak Hour | PHV (veh/h) | Peak Hour | PHV (veh/h) | Peak Hour | PHV (veh/h) |
| Sunday | 07:00 - 8:00 | 2825 | 07:00 - 8:00 | 2153 | 14:00 - 15:00 | 1552 |
| Monday | 08:00 - 9:00 | 2760 | 15:00 - 16:00 | 2079 | 07:00 - 8:00 | 1589 |
| Tuesday | 07:00 - 8:00 | 2863 | 07:00 - 8:00 | 2143 | 07:00 - 8:00 | 1480 |
| Wednesday | 07:00 - 8:00 | 2864 | 07:00 - 8:00 | 2036 | 15:00 - 16:00 | 1783 |
| Thursday | 07:00 - 8:00 | 2856 | 07:00 - 8:00 | 1935 | 14:00 - 15:00 | 1716 |
| Friday | 18:00 - 19:00 | 2281 | 18:00 - 19:00 | 1667 | 18:00 - 19:00 | 1350 |
| Saturday | 07:00 - 8:00 | 2640 | 07:00 - 8:00 | 1991 | 07:00 - 8:00 | 1438 |
The peak hour volume (PHV) on Al Jalaa Street was between 2760 and 2864 veh/h in both directions on weekdays. On Friday and Saturday, the peak hour volume was 2281 and 2640 veh/h, respectively. On Al Nassr Street, the PHV was between 1935 and 2153 vhe/h in both directions on weekdays. The PHV on Friday and Saturday was 1667 and 1991 veh/h, respectively. The PHV on Al Wehda Street was less than the respected value on the other two streets. On weekdays, the PHV on Al Wehda Street was between 1480 and 1783 veh/h in both directions. However, on Friday and Saturday, the PHV was 1350 and 1438 veh/h, respectively.
5.5. Peak-To-Daily Ratio and Directional Traffic Split
For capacity and design purposes, the design hour volume is important in representing the amount of traffic occurring at peak times. To derive the design hour volume, the engineer multiplies the average annual daily traffic (AADT) by the K factor. A K factor is a ratio between a peak hour and the ADT. This can be many different factors. The most common is typically referred to as the K-30. It is specifically the ratio between the 30th highest hour and the AADT [16].
The Lehman Center for Transportation Research at Florida International University stated [17], “While the output volumes from traditional forecasting models are usually given in daily traffic, the input capacities are typically given in hourly traffic. Therefore, it is important to convert the corresponding hourly capacity to its daily equivalent by dividing the hourly capacity by a factor called the peak-to-daily ratio. A peak-to-daily ratio (p/d) is computed as the highest hourly volume of a day divided by the total daily volume, as follows:”

Don R. Crownover [16], the Traffic Monitoring Team Leader of Oregon Department of Transportation recommended, “The K factor derived from short-term counts remained consistent throughout the count season. It would represent normal peak conditions well. A typical peak could be computed from either short-term counts or Automatic Traffic Recorders.”
K The proportion of Annual Average Daily Traffic (AADT) occurring in an hour (peak hour).
p/d (PEAK-TO-DAILY RATIO) The highest hourly volume of a day divided by the daily volume.
5.6. Directional Traffic Split (D)
The proportional distribution between opposite flows of traffic on two-way facilities is known as the directional traffic split. It is expressed in percentages. For example, a 60%/40% directional split would be one in which 60% of the two-way hourly volume travels in one direction, and 40% of the two-way volume travels in the opposite direction.
5.7. Estimation of the Percentage of Peak Hour Volume of the 24-Hour Traffic Flow (p/d) and the Directional Split of Traffic Flow (D) During the Peak Hour
Analysis of traffic flow data on the three studied main streets in Gaza shows that traffic flow during the peak period on these streets forms a percentage between 6.78 and 7.82 of traffic flow per day. This value is known as PEAK-TO-DAILY RATIO (p/d). The results showed that the average p/d value of the three streets is 7.18%. Furthermore, the analysis also revealed that the directional split of traffic flow during the peak period is between a minimum value of 50% and a maximum of 60% in the heaviest direction (D). Table 4 exhibits the p/d and D values on the three streets on all days of the week.
As exhibited in Table 4, the p/d ratio is between 6.78% and 7.82%. On the other hand, it should be noted that the p/d ratio in Rafah (a city located at the southern borders of Gaza Strip) was between 8.21% and 9.97% as obtained from traffic flow data collected in 2007 [12].
| Street | Al Jalaa Street | Al Nassr Street | Al Wehda Street | ||||||
|---|---|---|---|---|---|---|---|---|---|
| Day | veh/day | p/d | D | veh/day | p/d | D | veh/day | p/d | D |
| Sunday | 39631 | 7.13% | 51% | 30490 | 7.06% | 51% | 22889 | 6.78% | 60% |
| Monday | 38115 | 7.24% | 51% | 29309 | 7.09% | 54% | 22857 | 6.95% | 57% |
| Tuesday | 40332 | 7.10% | 51% | 30485 | 7.03% | 51% | 20547 | 7.20% | 59% |
| Wednesday | 39686 | 7.22% | 51% | 28610 | 7.12% | 51% | 25344 | 7.04% | 56% |
| Thursday | 40506 | 7.05% | 51% | 27530 | 7.03% | 51% | 25115 | 6.83% | 55% |
| Friday | 29240 | 7.80% | 50% | 21404 | 7.79% | 51% | 17256 | 7.82% | 51% |
| Saturday | 37110 | 7.11% | 51% | 27195 | 7.32% | 51% | 20405 | 7.05% | 53% |
| Total (veh/week) | 264,620 | 195,023 | 154,413 | ||||||
CONCLUSION
The results of this research indicate that the average HEFs obtained on the three studied main streets in Gaza city can be used with 95% confidence. The analysis proved that the average HEFs in the period between 7:00 and 16:00 are the most appropriate. This is because the margin of error in this period is less than ±3%. In order to get the best accuracy, the results recommend applying these factors on traffic counts obtained on weekdays rather than weekends. The results also recommend that the average values of the HEFs of the three streets may be applied on other main streets of Gaza in order to obtain estimates of the ADT.
The results indicate that the DEFs obtained by this work can be used to estimate the ADT with a maximum margin of error of about 10%. However, Sunday and Monday are probably the best weekdays to get the most accurate estimation of ADT. This is because they have the lowest margin of error among weekdays (1.9% to 3.2%) and they are more likely to represent an average day of the week.
A maximum PHV of 2864 vehicles/hour was recorded on Al Jalaa Street on Wednesday between 7:00 and 8:00 in the morning. The average peak-to-daily ratio (p/d) of the three streets was found to be 7.18%. On the other hand, the maximum directional traffic split (D) was found to be 60% in the heaviest direction of traffic flow during the peak period.
RECOMMENDATIONS
It is recommended to carry out further studies and traffic statistics on other roads in Gaza city. This is expected to support the findings of this research and to provide more reliable and accurate HEFs and DEFs. On the other hand, similar studies are also recommended in other cities both in Gaza Strip and the West Bank. It is also recommended to establish a formal body to be responsible for conducting traffic data collection, analysis and publication. This formal body is advised to specify locations for continuous traffic counts. The locations should be carefully selected to represent the important sites in the city of Gaza. Traffic flow data and other related information should be readily available to experts, professionals as well as students. This is important to enhance research in this field and to provide reliable and accurate information for planning and design purposes.
CONSENT FOR PUBLICATION
Not applicable.
CONFLICT OF INTEREST
The authors declare no conflict of interest, financial or otherwise.
ACKNOWLEDGEMENTS
The author would like to acknowledge the work of Mr. M. Alkhatib and Mr. I. Kusba in the data collection process of traffic flow as part of their graduation project at the Civil Engineering Department at the Islamic University of Gaza. The author would also like to acknowledge the support and advice of Dr. T. Eshtaiwi in the statistical analysis of data.


