All published articles of this journal are available on ScienceDirect.
Experimental Study on the Effect of Moisture Content on Hysteretic Behavior of Reinforced Concrete Columns
Abstract
Background:
For reinforced concrete structures under different humid conditions, the mechanical properties of concrete are significantly affected by the moisture content, which may result in a great change of the functional performance and bearing capacity.
Objective:
This paper presents an experiment to investigate the influence of the moisture content on the dynamic characteristics and hysteretic behavior of reinforced concrete column.
Results:
The results show that the natural frequency of reinforced concrete columns increases quickly at an early stage of immersion, but there is little change when the columns are close to saturation; the difference between the natural frequencies before and after cyclic test grows as the moisture content rises. The damping ratio slightly decreases first and then increases with the increase of moisture content; the damping ratio after the cyclic test is larger than before the test due to the development of the micro-cracks.
Conclusion:
The trend of energy dissipation is on the rise with increasing moisture content, although at an early stage, it decreases slightly. According to the experimental result, a formula for the moisture content on the average energy dissipation of reinforced concrete columns is proposed.
1. INTRODUCTION
It is well-established that the concrete structural system is a dynamic system subjected to continuous changes in the moisture content. Concrete structures, such as dams, bridges piers, offshore platforms, waterfront structures, etc., are all operating in an under-water environment. Many hydraulic constructions are in the saturated state all year round, and with global climate changing, concrete structures are often immersed in water because of storms or floods in recent years, which lead to variations in their structral performance.
Some studies [1-4] related to the moisture effects on concrete materials focused on the mechanical properties of materials, stress-strain constitutive law and static behaviors. They mostly concluded that the concrete strength decreased whereas the elastic modulus increased with the increasing moisture content. Some studies [5, 6] investigating the dynamic behavior just concentrated on the strain-rate effect on concrete strength or elastic modulus, which showed that moisture content played an important role in the strain-rate effect of concrete. Rossi et al. [7, 8] believed that water viscosity produced by Stefan effect resulted in the strain-rate effect in concrete and proposed a viscoplasticity model to simulate the properties of concrete under dynamic loading. Zhou et al. [9] executed the uniaxial rapid compressive loading tests of 30 specimens with five moisture contents (0%, 25%, 50%, 75% and 100%, respectively). With an increase in moisture content, the dynamic compressive strength of cement mortar decreased while Young’s modulus first increased and then decreased.
More importantly, apart from the static loads, buildings are often subjected to the dynamic loads, such as impacts, explosions, earthquakes, etc. As the main load-bearing member of concrete frame structures and bridges, reinforced concrete (RC) columns suffer from cyclic transverse loads during an earthquake and dramatically show inelastic characteristics. Precise prediction for the hysteresis behavior of RC columns under the seismic loads carries great significance for the assessment of the safety of RC frames and bridges during an earthquake. Numerous studies with respect to the hysteresis behavior of RC columns have been carried out. In 1972, the Building Center of Japan established the “Short Column Committee” which carried out about 260 experiments in a time span of five years to investigate the seismic behavior of RC columns with a shear span ratio of 1 to 2 and design strength of 21N/mm2. The failure characteristics were compartmentalized shear-type, adhesion-type and bending-type. Shanxi building design institute [10] also studied the effect of axial compression ratio, shear span ratio, reinforcement ratio and stirrup shape on the ductility of RC columns, similar to Wight et al. [11]. Many researchers [12-15] also carried out a series of experiments to explore the seismic behavior of high strength concrete column with different strength, axial compression ratio, shear span ratio, reinforcement ratio and stirrup ratio. Some studies [16-18] with respect to the cyclic response of RC members at low temperature were conducted. Besides, a variety of hysteresis models predicting the response of reinforced concrete members subjected to cyclic loading were proposed, which range from classical models proposed by Clough [19], Mehdi [20] and Takeda et al. [21] to more complicated models-models based on the endochronic theory of plasticity [22] as well as on damage concept [23, 24]. With the formulae for the effect of moisture content on the natural frequency of concrete beams deduced, Zhou et al. [25] carried out a dynamic test on five concrete beams after immersion. Results showed that the elastic modulus and natural frequency of concrete beam increased as increasing moisture content,which is opposite to the dynamic displacement. Considering the impact of moisture content on the mechanical properties of the structure, Gao [26] analyzed the seismic responses of the concrete pier in deep water with the moisture content and hydrodynamic pressure taken into account comprehensively. The results showed that the displacement of the pier top decreased while the internal forces of the bottom of pier increased when moisture content was considered.
It is noteworthy that practically, all previous experimental research has been conducted under standard ambient humidity without considering moisture effects. Indeed, the mechanical properties of concrete may vary under different moisture conditions and related information indicates that the damping of concrete mainly depends on the moisture content [27]. The objective of this paper is to investigate the influence of moisture content on the vibration characteristic and hysteresis behavior of RC columns. Furthermore, the study also gives reference to the subsequent studies on the mechanisms of moisture content effect on the hysteresis behavior and the prediction of the energy dissipation of RC columns at different moisture contents.
2. EXPERIMENTAL PROGRAM
2.1. Specimen Preparation
In this investigation, an ordinary Portland Cement (PO42.5) was used in all compositions and its properties were in accordance with the standard of Common Portland Cement [28]. The aggregate included medium sand (fine aggregate) and pebbles (coarse aggregate) produced in the Zhongxing plant of Zhuozhou in Hebei Province. The fineness modulus, clay content, apparent density and bulk density of the sand were 2.68, 1.6%, 2.66g/cm3, 1559kg/m3 respectively, while the clay content, apparent density, bulk density and maximum aggregate size of the pebbles were 0.6%, 2.65 g/cm3, 1563 kg/m3, 26.5mm, respectively. Fly ash and JK-05 pumping admixture were chosen as the concrete admixture and chemical admixture. The mix proportion of concrete used is given in Table 1, according to the Specification for Proportion Design of Ordinary Concrete [29].
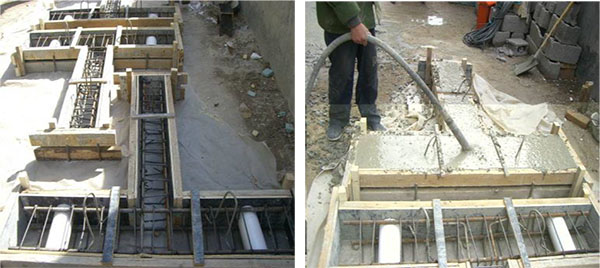
The strength grade of concrete in this research is C30, whose mechanical properties can be referred to the Code for Design of Concrete Structures [30]. Besides, to reflect the real force conditions exactly and to employ the experimental structure to practical engineering, large-scale specimens were used. The longitudinal reinforcement ratio, shear span ratio, and axial compression ratio are 1.356%, 4.75 and 0.15, respectively. The information on the steels and RC columns is given in Table 2 and Fig. (1). The specimens used in this research were cast on site by a project department in Beijing, as shown in Fig. (2).
| Cement | Water | Coarse Aggregate | Fine Aggregate | Fly Ash | Superplasticizer | Others |
|---|---|---|---|---|---|---|
| 302 | 175 | 1044 | 787 | 87 | 8.95 | 0 |
| Steel Type | Steel Grade | Diameter /mm |
Yield Strength /MPa |
Tensile Strength /MPa |
Elongation /% |
|---|---|---|---|---|---|
| Longitudinal bar | HRB400 | 18 | 500 | 675 | 23.0 |
| HRB335 | 12 | 400 | 612 | 27.5 | |
| Stirrup | HRB235 | 6 | 325 | 480 | 28.0 |


2.2. Instrumentation
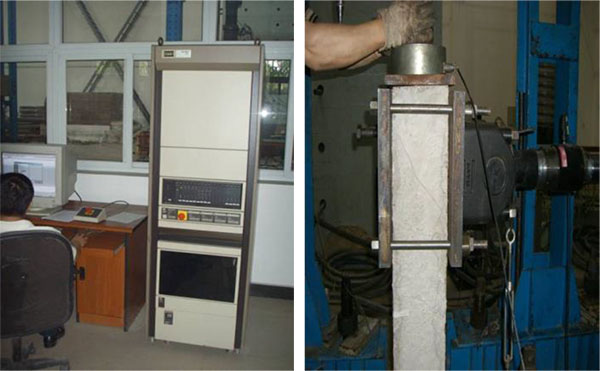
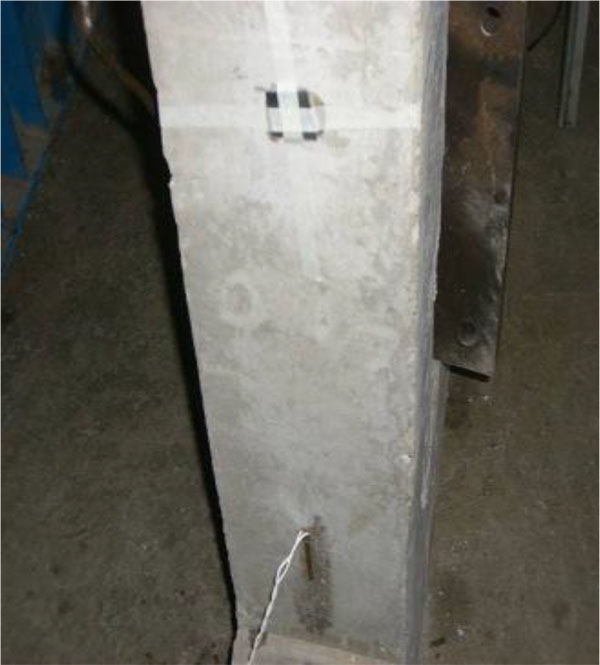
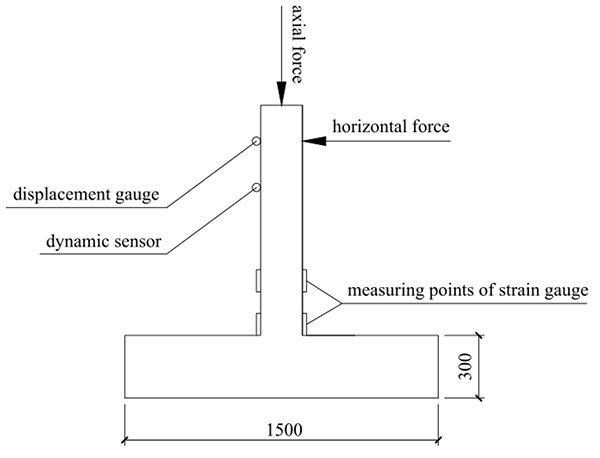
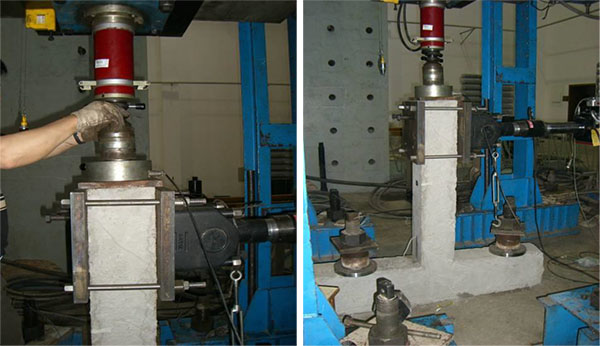
The RC columns were fitted with instruments to measure vibration characteristics, displacement, concrete strains and moisture content. Vibration characteristics were measured by the dynamic sensor and data were collected by DH5922 dynamic test analysis system, as illustrated in Fig. (3). MTS electro-hydraulic servo testing machine and DH3816 continuous data acquisition system in the structural laboratory of Beijing Jiaotong University were employed as lateral loading installation and concrete strain data collection system, as illustrated in Fig. (4). The axial load was applied by vertical hydraulic jack which will be applied to the geometric center of the top of the specimen to ensure that the axial pressure applied will not produce eccentric bending moment. To measure concrete strains in the plastic hinge region, four strain gauges, each 10cm long were attached to the pedestal of RC columns. The concrete strains were measured by electric resistance strain gauges and data were collected by DH3816 continuous data collection system, as shown in Figs. (5, 6) shows the arrangement of the various instruments.
2.3. Test Procedure
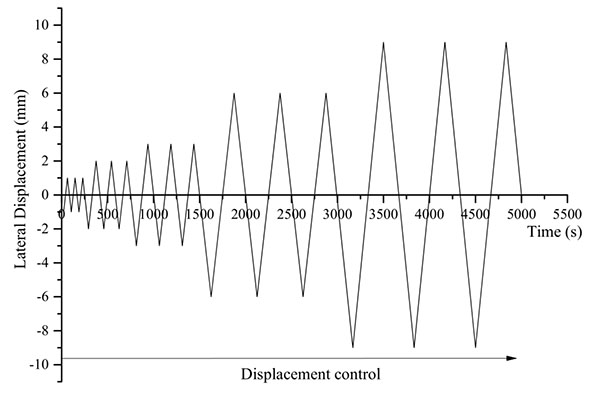
To study the vibration character and hysteresis behavior of RC columns under different moisture contents, four full-scale specimens (No.1-No.4) were subjected to different immersion times. The immersion time was fixed as 0 day, 1 day and 4 days, because the moisture content increases to about 70% fully saturated moisture content at the first interval of 2.5 h, while it increases slowly after 90 h, which can be considered as fully saturated approximately [31]. To obtain the moisture contents of four columns, concrete specimens (100mm×100mm×100mm), the same batch as the columns, were prepared and immersed at the same time. Having been immersed for the same duration as the columns, the moisture contents were obtained by the drying method and they are used as the moisture contents of RC columns, as shown in Table 3. Besides, the vibration characteristics of the four specimens were recorded before the cyclic test. In the cyclic test, the large-scale specimens were installed by geometric alignment, as shown in Fig. (7). An axial force (180kN) was applied according to the design axial compression ratio and kept constant. Then, a cyclic lateral load was applied. The hysteretic loading criteria are presented in Fig. (8). After the cyclic test, the vibration characteristics of No.2-No.4 RC columns were measured.
| Number | Measurement /mm |
Immersion Time /day |
Moisture Content /% |
Subjects Studied |
|---|---|---|---|---|
| 1 | 200×200×1100 | 0 | 1.56 | vibration character |
| 2 | 200×200×1100 | 0 | 1.56 | hysteresis behavior, vibration character |
| 3 | 200×200×1100 | 1 | 3.48 | hysteresis behavior, vibration character |
| 4 | 200×200×1100 | 4 | 4.15 | hysteresis behavior, vibration character |
It is noteworthy that the moisture content test and dynamic test of No.3 and No.4 RC columns were carried out just after an immersion time of respectively 1 day and 4 days were reached. In this way, a difference between the actual moisture content and the measured moisture content caused by water evaporation can be avoided.
3. EXPERIMENTAL RESULTS AND DISCUSSIONS
3.1. Mechanical Behavior of Concrete After Immersion
In this investigation, some groups of concrete specimens(100mm×100mm×100mm for compressive strength and 100mm×100mm×300mm for elastic modulus) were also prepared in the meanwhile to research the relationship between moisture content and mechanical performance of concrete. The results indicate that compressive strength decreases with an increase in moisture content, while elastic modulus of concrete increases with an increase in moisture content. Based on the experimental results, the relationship between compressive strength, elastic modulus and moisture content can be expressed by Eq.1 [32] and Eq.2 [31], respectively. The compressive strength and elastic modulus were measured strictly according to the Standard for Test Method of Mechanical Properties on Ordinary Concrete [33] and the Building Material Test Manual [34].
 |
(1) |
 |
(2) |
Where fc denotes the compressive strength of concrete (MPa), Ec denotes elastic modulus of concrete (MPa), p and denotes moisture content (%).
Eq.1 manifests that the compressive strength apparently declines at the early stage of immersion while it increases at the later phase. This is because the concrete cured under the natural condition was not fully hydrated for a lack of water. Then water saturates the concrete gradually as the immersion time increasing, so the concrete continues to hydrate, leading to an increase in compressive strength of concrete [32]. Eq.2 indicates that the elastic modulus is proportional to moisture content. Han et al. [35] explained that the inclusions in concrete, pores and microcracks have a softening effect on the the concrete matrix, which reduces the elastic modulus of concrete. Whereas, for wet concrete, the bulk modulus of free water in pores shows little difference with that of concrete matrix, so the free water in pores relieves the softening effect of pores and microcracks to some extent, which increases the elastic modulus. Moreover, the absorbed water in C-S-H gels can bear some loads, therefore the presence of it also improves the elastic modulus [31].
The concrete specimens in this experiment were the same batches subjected to the same curing conditions as the RC columns, therefore, on the basis of the above equations, the compressive strength and elastic modulus of four RC columns under different moisture contents are obtained, as depicted in Table 4.
| Number | Moisture Content /% |
Compressive Strength/MPa | Elastic Modulus/MPa |
|---|---|---|---|
| 1 | 1.56 | 30.90 | 28894.39 |
| 2 | 1.56 | 30.90 | 28894.39 |
| 3 | 3.48 | 24.69 | 32700.40 |
| 4 | 4.15 | 26.06 | 34028.55 |
3.2. Dynamic Characteristics
3.2.1. Natural Frequency
According to the experiment, the first modal vibration is the main vibration form of the column. The fundamental frequency of the column is directly related to the flexural stiffness, so the RC column can be analyzed as a single degree of freedom system with flexural deformation. The natural frequencies of the columns before and after the cyclic test, which can be obtained by spectrum analysis, are presented in Table 5.
| Number | Natural Frequencies Before Cyclic Test/Hz | Natural Frequencies After Cyclic Test/Hz | Change Rate/% |
|---|---|---|---|
| 1 | 58.1 | -- | -- |
| 2 | 57.9 | 22.0 | 62.0 |
| 3 | 68.6 | 30.7 | 55.2 |
| 4 | 71.6 | 33.7 | 52.9 |
As can be seen from Table 5, the natural frequency increases with an increasing moisture content. The natural frequency of No.3 specimen is much larger than the one of No.2 specimen; however, there is no significant change between No.3 and No.4 specimens. It seems that natural frequency increases quickly at the early stage of immersion, while there is little change at the later stage when the specimen is close to saturation. The elastic modulus of concrete increases with the growth of moisture content [31] and this phenomenon gives an explanation for the increase of natural frequency.
As for the natural frequencies of No.2-No.4 specimens after the cyclic test, they all meet significant falls because of the stiffness decrease after cracking; however, the change rate decreases as the moisture content increases. This phenomenon is explained by the fact that the stiff effect of water in pores and soft effect of cracks have an opposite effect on the deformation of concrete matrix as well as hinder or restrain the development of micro-cracks within concrete, resulting in the greater macroscopic tensile strength and peak strain of saturated or nearly saturated concrete comparing with that of plain concrete [4, 36]. This effect can reduce partial damage to some degree.
3.2.2. Damping Ratio
The damping ratio can be calculated by the following equation:
 |
(3) |
Where and depict amplitudes of and free vibration curves respectively. The damping ratios of the four specimens before and after cyclic test are presented in Table 6.
| Number | Damping Ratio Before Cyclic Test/% | Damping Ratio After Cyclic Test/% | Change Rate/% |
|---|---|---|---|
| 1 | 2.15 | -- | -- |
| 2 | 1.8 | 3.85 | 113.89 |
| 3 | 1.3 | 5.7 | 338.46 |
| 4 | 1.52 | 5.8 | 281.58 |
As can be seen from the above table, the original damping ratios of the four specimens are about 2%, which coheres with the measured range of damping ratio of RC structures. Before the cyclic test, the damping ratios of No.3 and No.4 specimens are slightly smaller than the ones of No.1 and No.2 specimens without immersion, which may be caused by the lubricating effect of water in the pores after the immersion of specimens. The damping ratios increase significantly after the cyclic test due to micro-cracking in the RC columns; however, for the specimens with immersion, the rate of change of damping ratio is much larger than that of the specimens without immersion. According to Fig. (8), the loading rate during the test cannot be fast for it is acknowledged that cracks in concrete develop very rapidly under high loading rate with immediate speed. According to micro hydrodynamics, there is a significant increase in the viscosity of free water in the small-size cracks. When the cracks develop, an opposite force is applied by the viscosity of free water, which hinders the development of cracks. Therefore, the damping ratio reflects a growth trend for wet specimens after the cyclic loading.
3.3. Hysteretic Behavior
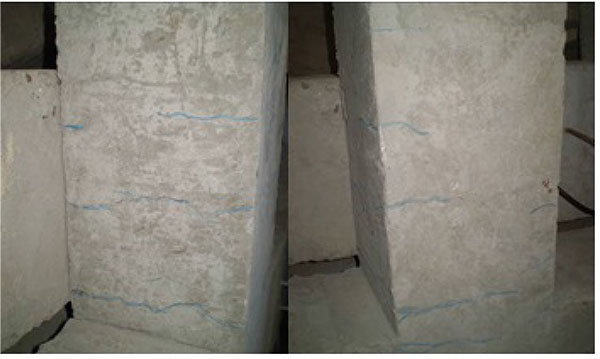
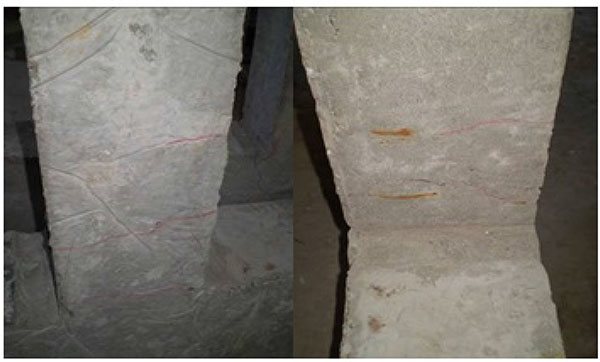
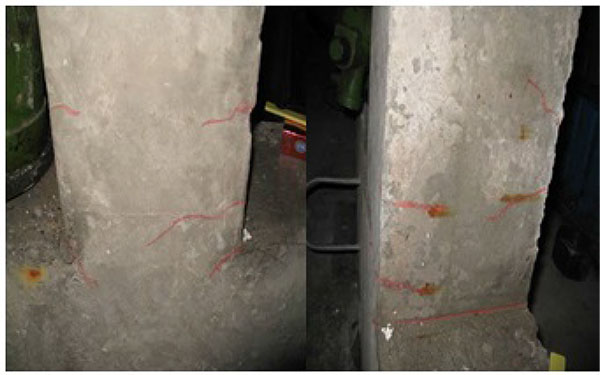
During the loading process, there was no significant difference between the failure modes of all specimens. The crack development of No.2-No.4 specimens is shown in the Figs. (9-11). Two horizontal symmetric cracks appeared first at the base of the specimens. With the load level increasing, some horizontal major fractures developed. At the last load level, crack slopes downward, but the slope angle was smaller.
The hysteretic curves of No.2-No.4 specimens are shown in Fig. (12).
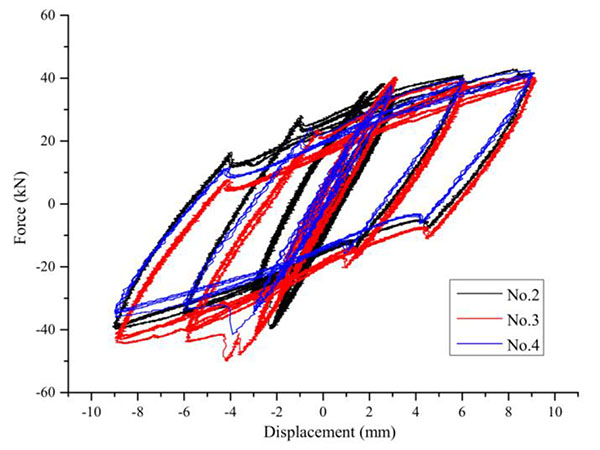
As can be seen from Fig. (12), the shape and the size of the hysteretic curves are basically similar, and the same applies to the slopes, that is to say, with the increasing moisture content, there is no significant stiffness degradation. The hysteretic curves show a plump fusiform, which reflects good ductility and energy dissipation capacity. However, it is apparent that there are some distinctions in the areas of hysteretic curves, which indicates moisture transfer in the interior of concrete has an impact on the energy dissipation capacity.
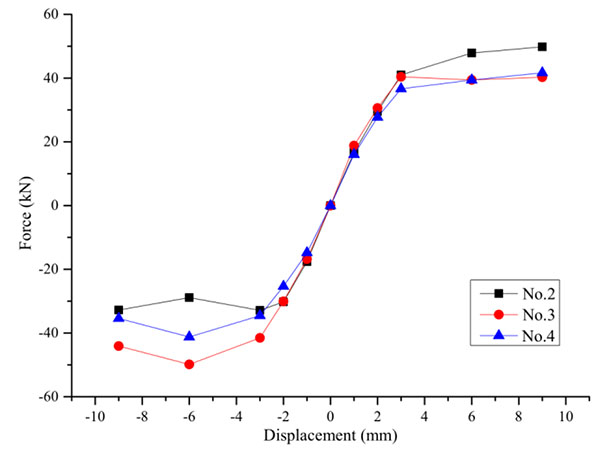
The skeleton curve represents a pivotal stage of the research for a nonlinear seismic response. Its shape is similar to the single loading curve, but the ultimate load decreases as a result of the cyclic load. It is the track of the horizontal force peak in the cyclic loading and reflects a series of stages and characteristics of force and deformation for structural members, such as strength, stiffness, ductility and collapse-resistant capacity, etc [37]. The skeleton curves of No. 2-No. 4 are shown in Fig. (13). The ultimate loads are shown in Table 7.
| Number | 2 | 3 | 4 |
|---|---|---|---|
| Ultimate load/kN | 41.44 | 44.07 | 41.14 |
As can be seen from Fig. (13), during the elastic stage, the stiffness of the No.3 and No.4 specimen is slightly larger than the one of the No.2; this may be because as the moisture content rises, the elastic modulus grows. However, during the elastoplasticity stage of each skeleton curve, there are some discrepancies between the tension and compression section. The discrepancy is more obvious at the initial stage of immersion than during the subsequent days of immersion; the ultimate load is also larger for the initial immersion time than the later stage. The reason might be: in the initial stage of immersion, the micro-crack develops and the water transfers through them into the interior of concrete during the cyclic test; the viscosity of free water hinders some crack-development when tension is applied to the concrete.
Energy dissipation is an important factor in measuring the seismic performance of structural members. Compared with the displacement-ductility factor, it measures the seismic performance by calculating the area of the hysteretic curve rather than by just considering some certain stages (some certain points on a hysteretic curve). Currently, there is no identical evaluation standard for seismic performance measurement. There are some evaluation indicators, such as the area of the hysteretic curve, the equivalent viscous damping coefficient, the average energy dissipation coefficient and the power index. In the essence, they evaluate the plumpness degree of the hysteretic curve. In this paper, the first indicator was employed and the experimental results are illustrated in Table 8.
| Specimens | Area of Hysteretic Curve |
|---|---|
| No.2 | 3224.2 |
| No.3 | 2791.9 |
| No.4 | 3392.0 |
As can be seen from Table 8, in the initial phase of immersion, the energy dissipation of wet specimen decreases compared with the one of the dry specimen; then it increases with an increase in moisture content. Vibration can make the free water in the interior concrete move; friction will occur between the free water and the solid-phrase matrix, which can consume partial energy. In the meanwhile, as a cementing material, water gels are also propitious to the improvement of the damping and the energy dissipation.
According to the energy theory in physics, the area of the hysteretic curve is the work applied by a horizontal force, which can be taken as the energy dissipation of the structural members without considering the heating effect. The ratio of the energy dissipation of one vibration period and the elastic potential energy on the largest amplitude can be expressed by the energy dissipation coefficient, which can be calculated as follows.
 |
(4) |
 |
(5) |
Where E denotes the area of one certain cycle;
 denotes the elastic energy of the force; P+y and P-y denote the yield load when loading in the positive and negative direction; Δ+y and Δ+y denote the yield displacement when loading in the positive and negative direction. In this paper, average energy dissipation coefficient is introduced to express the energy dissipation capacity of the RC column with different moisture contents, which is expressed by Eq.6.
 |
(6) |
Where n denotes total cycle number of the hysteretic curve. The energy dissipation coefficient with different moisture contents is shown in Fig. (14).
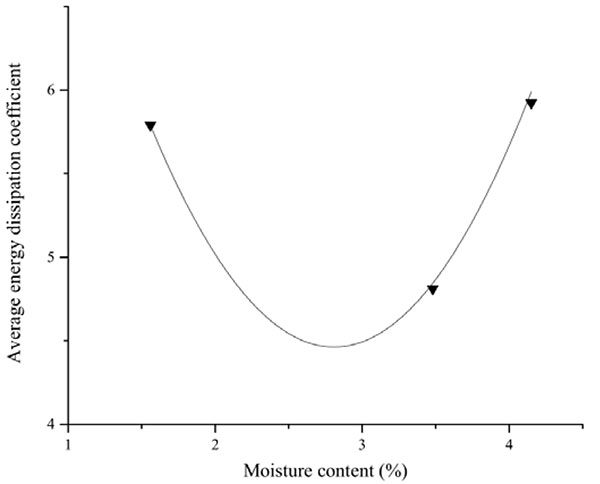
As can be seen from Fig. (14), with the increasing moisture content, the average energy dissipation coefficient decreases first and then increases, that is to say, specimens’ energy dissipation capacity first decreases and then increases with the increase of moisture content. On the basis of the experimental data, a formula expressing the relationship between the average energy dissipation coefficient and the moisture content is developed as follows:
 |
(7) |
where denotes the moisture content. The formula can provide a reference to the research for the hysteretic behavior of underwater concrete structures. However, due to different experimental conditions, test instruments and test methods, whether the results can give guidance to the design of concrete structures accurately should be studied further; besides, the mechanisms of the influence of moisture content on the energy dissipation capacity need further investigations.
CONCLUSION
- Natural frequency increases quickly at the early stage of immersion, but there is little change at the later stage; the natural frequency after the cyclic test is smaller than that before cyclic test due to the cracking; the difference between the natural frequencies before and after cyclic test grows as the moisture content rises.
- The damping ratio slightly decreases first and then increases with the increase of moisture content.; the damping ratio after the cyclic test is larger than before the test due to the micro-cracks.
- The hysteretic curves of all columns are plump, which reflect a good ductility and energy dissipation capacity. In the initial phase of immersion, the energy dissipation of the wet specimen decreases compared with that of the dry specimen. In the subsequent phase, the energy dissipation of columns increases with an increase in moisture content.
- Based on the experimental results, the relationship between the energy dissipation and moisture content is developed, which is expected to give a reference to the study on the hysteretic behavior of the underwater structures.
LIST OF ABBREVIATIONS
| fc | = The Compressive Strength of Concrete |
| E | = The Elastic Modulus of Concrete |
| p | = The Moisture Content |
| A | = The Amplitudes of i Free Vibration Curves |
| Ai + n | = The Amplitudes i + n of Free Vibration Curves |
| E | = The Area of One Certain Cycle |
 |
= The Elastic Energy of the Force |
| P+y | = The Yield Load when loading in the Positive Direction |
| P-y | = The Yield Load when loading in the Positive Direction |
| Δ+y | = The Yield Load when loading in the Negative Direction |
| Δ-y | = The Yield Displacement when loading in the Positive Direction |
| n | = The Total Cycle Number of the Hysteretic Curve |
CONSENT FOR PUBLICATION
Not applicable.
CONFLICT OF INTEREST
The authors declare no conflict of interest, financial or otherwise.
ACKNOWLEDGEMENTS
The authors gratefully acknowledge the financial support of National Science Foundation of China (Grant No.51278031).


