All published articles of this journal are available on ScienceDirect.

Prioritizing Key Duration Estimation Accuracy Factors in Highway Infrastructure Projects Using Fuzzy AHP
Authors Info & Affiliations
Abstract
Background:
At the early phase of project development, highway engineering estimators seek to determine the duration of highway construction projects for the purpose of construction planning and administration. Thus, it is vital to study and analyze the estimation accuracy factors of highway construction project duration. In this regard, several studies have been conducted to identify and analyze the estimation accuracy factors of project duration in various ways to improve the estimation and management performance of all the contracting parties. However, very less effort has been devoted to evaluating the duration estimation accuracy factors in the case of the highway construction industry under fuzzy environment.
Objective:
This paper aims to analyze and prioritize the critical factors that potentially affect the duration estimation accuracy of the highway construction projects in Ethiopia under fuzzy environment.
Methods:
An extensive review and discussions with highway engineering experts were carried out to explore and identify the duration estimation accuracy factors. The study data collection process consists of two stages. The first stage is to conduct a questionnaire survey. Whereas, the second stage is to carry out the pair-wise comparison matrix to capture the imprecision and vagueness in subjective responses. Then, a λ-cut set method to reduce the initial list of factors and exploratory factor analysis was used to classify the reduced set of factors into smaller groups. Finally, a fuzzy hierarchy process algorithm with the use of triangular fuzzy numbers was presented for prioritizing critical factors.
Results:
A cut -off value, λ = 0.95, was verified which resulted in the identification of critical accuracy factors. Accordingly, 12 critical factors were opted and categorized as a cluster of similar items into 5 groups. Finally, the analytical results obtained from fuzzy AHP algorithm revealed that project complexity, project size, bridge type and complexity were found to be the four top-ranked factors based on the global priority weight.
Conclusion:
These factors must be a serious concern in estimating and administering the contract and the duration of highway construction projects at the early phases of project development so that the time deviation upon the completion of the project can be minimized.
1. INTRODUCTION
Establishing a realistic duration at the early stage of infrastructure projects is important for both contractors and clients. An accurate determination of duration and cost at an early phase of project development can aid stakeholders to meet public expectations and avoid the public related problems about time overruns. In addition, it can also be useful in the bid evaluation stage. In cases where bidders are requested to specify a construction period and cost, the expected project duration and cost can be used as one of the bid evaluation criteria. Accordingly, costs of delays and safety problems during project implementation can be estimated and used as an input for the lifecycle cost analysis as well [1]. Therefore, it can be realized that the accuracy of the estimate is critical to guarantee the construction project’s success.
However, many studies revealed inaccurate estimation practices and proved that completing later than scheduled is a long-standing problem widely recognized. Rivera et al. (2017) [2] demonstrated the global construction project performance. According to this study, 75% of projects in Africa experience schedule delay. Of the 75%, project duration is delayed 53% greater than the original scope. In the case of the Ethiopian construction industry, most construction projects are not delivered on time. The Construction Sector Transparency Initiative (CoST) is a country centered initiative to improve the value for money spent on public infrastructures by increasing transparency in the delivery of government-financed construction projects. As part of CoST-Ethiopia, Tadesse et al. (2016) [3] have disclosed 52 construction projects from building, road, and water subsectors in Ethiopia. According to their recent study report, the aggregate time overrun was 134.20% while that of road subsector turns out to be 99.50%. There is still a need to recognize the most significant factors affecting the estimation accuracy of road construction project duration to upswing the estimation and management practice of the contracting parties.
This study demonstrates the application of fuzzy extent analysis and AHP in prioritizing and ranking the significant factors that affect the estimation accuracy of road construction project duration at the early phases in the project development under fuzzy environment.
2. LITERATURE REVIEW
In several highway construction projects, the completion time of construction is set by the contract documents [4]. Estimation of the contract time duration of road construction projects at the planning stage serves as an important input for project planning, scheduling and contract administration. However, there are various factors leading to time overrun which becomes the most prime issue and hence induces turbulence in the time estimates [5]. In several previous studies, the various set of factors that significantly affect the estimation accuracy of the duration of highway projects have been identified. Table 1 depicts the various factors impacting highway project duration and /or its estimation accuracy which are deduced froma comprehensive literature review.
In the realm of estimation, several previous studies have been conducted to identify the various critical factors affecting the accuracy of highway project duration estimation using different statistical techniques such as mean score, relative importance index [6, 8, 16, 29-31] [29-33], principal component analysis [32, 33], stepwise regression [12], trial and error method of artificial neural network [11], sensitivity analysis [31], Likert scale analysis [31] and correlation analysis [4, 10, 19, 34].
In conclusion, the analysis of the existing literature review reflects that there is no prior study in identifying and analyzing the critical factors that affect the estimation accuracy of highway project duration under fuzzy environment because the qualitative attributes for expert evaluation are always imprecise and subjective. Uncertainties and fuzziness are often encountered in practice [35]. Furthermore, there exists a lack of applying multi-criteria decision-making process to analyze the significant factors to highway project duration. This has motivated the authors of this paper to carry out a study to prioritize and rank the duration estimation accuracy factors by applying fuzzy set theory and extent synthetic value analysis method on fuzzy analytical hierarchy process (fuzzy AHP) approach as part of multi-criteria decision-making process to capture the subjective and imprecise perspective data from experts and finally the most weighted factors influencing the estimation accuracy of highway project duration were prioritized and analyzed.
3. RESEARCH METHODOLOGY
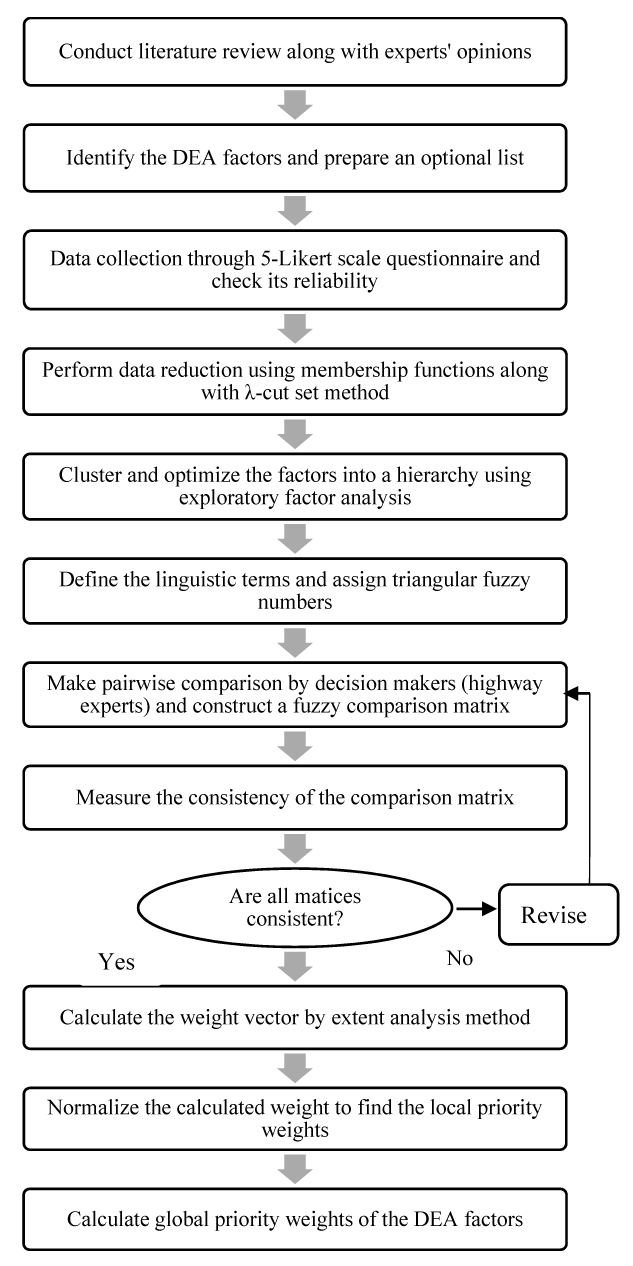
In this study, the overall process of identifying and prioritizing of duration estimation accuracy factors in the case of highway infrastructure projects consists of four main stages. These stages can further be divided into 13 steps. The first stage is to identify the factors and prepare an optional list through literature review and expert interview and then these factors are reduced into manageable sizes using the λ-cut set method in the second stages. The third stage is to group the identified factors having similar information using exploratory factor analysis and the hierarchical model is constructed in order to deal with fuzzy AHP algorithm. In the last stage, the synthetic extent value analysis along with the AHP method is applied to compute the weights of the factors and prioritize them. The steps of this study for prioritizing the factors are demonstrated in Fig. (1).
3.1. Initial Identification of Duration Estimation Accuracy Factors
Initially, the overall factors which directly or indirectly influence the duration estimation accuracy of highway construction projects are collected. In order to realise this, two data collection methods were employed: (i) investigation of secondary data from a thorough literature review of highway project estimation accuracy factors and (ii) primary data from an interview with experts who are involved in highway construction projects provided valuable comments on the sufficiency of the initial factor’s selection. Both the aforementioned data collection methods resulted in creating a collection of factors that made the basis for the main questionnaire with a 5-point Likert scale. Table 2 displays the optional list of identified factors that affect the accuracy of duration estimation of highway construction projects.
| Factors | Source |
|---|---|
| Project type | Elbeltagi et al. (2014) [6], Irfan et al. (2011) [7] |
| Contract type | Irfan et al. (2011) [7], El-kholy (2015) [8], WSDOT (2015) [9] |
| Area location | Liu et al. (2010) [10], Williams and Songer (2008) [12] |
| Project location (districts) | Elbeltagi et al. (2014) [6], Gardner et al. (2017) [13], Gransberg et al. (2017) [14], Gardner et al. (2016) [15], Kaleem et al. (2014) [5] |
| Project scope | Elbeltagi et al. (2014) [6], [El-Maaty et al. (2017) [16], Barraza et al. (2017) [17] |
| Project length | Elbeltagi et al. (2014) [6], Liu et al. (2010) [10], Gardner et al. (2017) [13], Naik and Radhika (2015) [18], Mahamid (2011) [19], Mahamid (2017) [20] |
| Site topography (Terrain type) | Mahamid (2017) [20], WSDOT (2015) [9], Gardner et al. (2017) [13], Aziz and Abdelhakam (2016) [21], Gransberg et al. (2017) [14] |
| Project capacity (Number of lanes) | Elbeltagi et al. (2014) [6], Attal (2010) [11] |
| Design AADT | Williams and Songer (2008) [12], Attal (2010) [11], Gransberg et al. (2017) [14] |
| Design speed | Williams and Songer (2008) [12], Attal (2010) [11], Gransberg et al. (2017) [14] |
| Geometric design standard | Williams and Songer (2008) [12], Attal (2010) [11], Gransberg et al. (2017) [14] |
| Curb, gutter and sidewalk | Gransberg et al. (2017) [14], Williams and Songer (2008) [12] |
| Waterbody and storm drain extents | Elbeltagi et al. (2014) [6], Gardner et al. (2017) [13] |
| Right-of-way (ROW) costs | Gransberg et al. (2017) [14], Aleithawe et al. (2012) [22] |
| Climate / weather conditions | Rivera et al. (2017) [2], Akal et al. (2017) [23], [Barraza et al. (2017) [17], Ren et al. (2008) [24], Bagaya and Song (2016) [25] |
| Condition / type of soils | Elbeltagi et al. (2014) [6], Gardner et al. (2017) [13] |
| Contractor’s performance | Santoso and Soeng (2016) [26], WSDOT (2015) [9], Doloi et al. (2012) [27], Sambasivan and Soon (2007) [28] |
| Construction letting date | Gransberg et al. (2017) [14] |
| Financial condition and rate of inflation | Akal et al. (2017) [23] |
| Construction project cost/amount | Attal (2010) [11], Naik and Radhika (2015) [18] |
| Code | Factors | Code | Factors |
|---|---|---|---|
| x1 | Project type | x23 | Horizontal and vertical alignment |
| x2 | Project complexity | x24 | Typical section (Pavement thickness) |
| x3 | Area location | x25 | Presence of curb, gutter & sidewalk |
| x4 | Project location | x26 | Bridge type and complexity |
| x5 | Project scope | x27 | Number of bridges in the project scope |
| x6 | Project size (length) | x28 | Existence of waterbody and storm drain |
| x7 | Contract type-payment method | x29 | The frequency of the project |
| x8 | Tender selection strategy | x30 | Experience and grade of consultants |
| x9 | Procurement method | x31 | Experience and grade of contractors |
| x10 | Type of project deadline | x32 | Right-of-way acquisition cost costs |
| x11 | Site topography/terrain type | x33 | Contractor’s need for the project |
| x12 | Project capacity-number of lanes | x34 | Hauling distance |
| x13 | Design AADT | x35 | Construction season-weather conditions |
| x14 | Design speed | x36 | Type of soil at the construction sites |
| x15 | Geometric design standard | x37 | Number of intersections |
| x16 | Type of highway system | x38 | Project letting year |
| x17 | Presence of a highway median | x39 | Fluctuation (price) measures |
| x18 | Presence of loops and ramps | x40 | Financial (cash flow) condition |
| x19 | Number of new signal count | x41 | Federal funding utilization |
| x20 | Presence of crossover | x42 | Cost escalation (Rate of inflation) |
| x21 | Site accessibility | x43 | Total project cost |
| x22 | Intersection signalization and signage |
After formulating an optional list of factors affecting the duration estimation accuracy of highway projects, the first round survey was conducted to collect the data from various groups of experts (respondents) through a questionnaire survey for the purpose of data reduction and grouping of factors In this survey, a 5-point Likert scale was employed to capture the preferences of respondents in the questionnaire for each factor, where a level of ‘5’ indicated the very high impact, ‘4’ high impact, ‘3’ moderate, ‘2’ low impact, and ‘1’ not at all impact or negligible. Because of the difficulty in formulating a sampling frame, the non-probability sampling technique was applied as respondents are selected based on their willingness to participate in the survey instead of adopting random selection [36].
In this study, in particular, the snowball sampling method was employed in which respondents know other respondents who also had similar experiences in planning and managing highway construction projects. According to such method, a list of 105 possible respondents was established. These respondents were invited to participate in the survey. Then, a total of 73 responses were received directly and via e-mail. Of the respondents, 12.86% were academics and 87.14% were highway engineers and practitioners from Ethiopian Road Authority and consultants who had had significant participation in the planning, designing and implementing of various types of highway construction projects. The profiles of the respondents are shown in Table 3.
| Characteristics | Categorization | Number | % |
|---|---|---|---|
| Job title | Senior manager | 18 | 25.71 |
| Highway engineer | 29 | 41.43 | |
| Contract administrator | 9 | 12.86 | |
| University instructor | 9 | 12.86 | |
| Undefined | 5 | 7.14 | |
| Working experience | < 5 years | 21 | 30.00 |
| 5 - 10 years | 26 | 37.14 | |
| 11 - 20 years | 13 | 18.57 | |
| > 20 years | 7 | 10.00 | |
| Undefined | 3 | 4.29 | |
| Working organization | Academic institution | 9 | 12.86 |
| Ethiopian Road Authority (Client) | 24 | 34.29 | |
| Consulting service | 37 | 52.86 | |
| Undefined | - | - |
3.2. A λ-Cut Set Method
This 5-point Likert scale questionnaire survey was utilized to analyze the duration estimation accuracy factors using λ – cut set method. In this study, a λ-cut set method as part of the fuzzy set theory was formulated to identify critical factors. This method involves uncertainties and fuzzy variables. The implementation of fuzzy set theory is found to be favourable for the present study as the data is subjective and qualitative, most of them, in identifying the criticality of factors. The fuzzy set theory was used to reduce the fuzziness and uncertainty [37] and to help identify the critical factors [38, 39].
The symbol
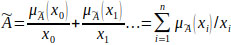
 was used to represent a set of factors, noted as a duration estimation accuracy factors set. This factors set is designed as a fuzzy set (see Eq. 1) [38].
 |
(1) |
where xi is the factor listed in Table 2; n is the number of duration estimation accuracy factors, i.e. 43;
 is the degree of membership of xi in the fuzzy set
and
is the degree of membership of xi in the fuzzy set
and
 . Particularly, in Eq. (1), “+” and “/” are the symbols of the fuzzy set. They don’t stand for “plus” and “divided by,” respectively.
 means that the degree of membership of xi in
is
means that the degree of membership of xi in
is
 “+” can be read as “and.” [38-40].
The descriptive analysis is computed based on the influence of the factors. Accordingly, Mean Scores (MSs) and Standard Deviations (SDs) are calculated for all initial list of factors that provide the basic data to employ fuzzy set theory. The value of the standard deviation determines whether a factor belongs to the critical factors set. In this regard, the larger the standard deviation, the less critical the identified factor. Moreover, the factor’s criticality is recorded from 1 to 5, with a score of 3 as a neutral marking between non-critical and critical factors. Thus, the mean score of a factor is less than 3, the possibility for the factor to be one of the critical factors set is less than 50%. Then after, a new parameter Z can be defined to determine whether a factor should be encompassed in the critical factors set based on the two aforementioned indicators [38, 39]. Using Eq. (2), the variable Z is determined for each factor.
 |
(2) |
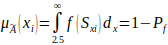
Nevertheless, because of the fuzziness involved in the subjective judgment process engaged in by individual respondents, the scoring result from the questionnaire survey usually is not in a normal distribution [38]. Therefore, this study was adopted as a fuzzy distribution instead. On the basis of fuzzy set theory [37-40], the degree of membership,
, of the variable in the fuzzy set is the probability that a variable belongs to a group and is described using Eq. (3) [39]:
 |
(3) |
Where
is the degree of membership for each factor in each category and Pf is the possibility that the factor does not belong to the group (critical factors).
Hence, after the Z score for each factor is computed, calculations for the degree of membership,
or fz can be derived. The fz score is the standard normal density function command in Microsoft Excel. The standard normal density function fz is computed using Eq. (4) below [39].
 |
(4) |
3.3. Exploratory Factor Analysis
Exploratory factor analysis based principal component analysis is used to find a small number of factors from a large number of variables which is capable of explaining the observed variance in the larger number of variables. In other words, it is a technique which is used for explaining the variance of a large set of interrelated factors by transforming them into a new or smaller set of uncorrelated factors. It is also useful to show the most significant factors and less significant factors with minimum loss of the original data in a clustered fashion [32]. Several previous studies have been used for factor analysis to cluster the most significant factors from a large set of factors [32, 33, 41-47]. Therefore, it can be generalized that there exists a general consensus on the suitability and applicability of the factor analysis in identifying and clustering the critical factors. Hence, in this study, the technique was used to cluster the identified critical duration estimation accuracy factors into various groups for the purpose of constructing the hierarchy structure and to apply the fuzzy AHP.
3.4. Basics of Fuzzy Set Theory and Triangular Fuzzy Numbers
It is very difficult to make decisions in a vague and uncertain environment [48]. In order to tackle this vagueness and uncertainty, Zadeh (1965) [37] proposed the concept of fuzzy set theory as an extension of the classical notion of the set and he defined it as a “class of objects with a continuum of grades of membership”. Fuzzy systems have rapidly become one of the most successful of today's technologies for developing sophisticated control systems because of their simplicity. Fuzzy systems address such applications perfectly as they resemble human decision making with an ability to generate precise solutions from certain or approximate information [49]. In the real world, there exists much fuzzy knowledge, that is, knowledge which is vague, imprecise, uncertain, ambiguous, inexact, or probabilistic in nature. Uncertainty can be caused by imprecision in measurement due to the imprecision of tools or other factors. Uncertainty can also be caused by vagueness in language objects and situations. Fuzzy set theory is primarily concerned with quantifying and reasoning using natural language in which many words have ambiguous meanings [50]. Fuzzy sets are sets whose elements have degrees of membership [51].
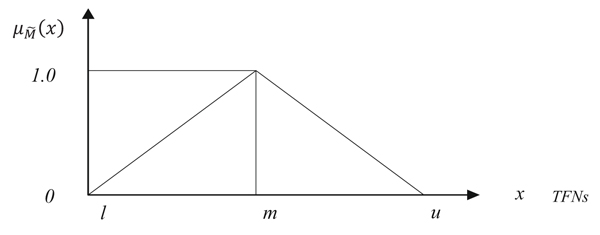
A Triangular Fuzzy Number (TFN) is a fuzzy number that is shown by three points [52]. A fuzzy number
 on
on
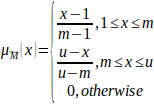
 to be a TFN if its membership function
 :
→ [0,1] is equal to the following Eq. (5) [51-54]:
:
→ [0,1] is equal to the following Eq. (5) [51-54]:
 |
(5) |
Where l and u mean the lower and upper bounds of fuzzy number
and m is the modal value for
. The TFN can be denoted by
 and is represented in geometric space as shown in Fig. (2) [51].
3.5. Fuzzy AHP Algorithm
Analytic hierarchy process is a powerful quantitative technique used to solve complex decision problems [51- 55]. It is one of the multi-criterion decision-making approaches. It is a tool which assists in decomposing, organising and analysing a complex problem and converting it into a multi-level hierarchy structure encompassing of goal (objective function), criteria and sub-criteria (attributes) [56]. But there is limited applicability of AHP as reported in the literature such as the judgmental scale is unbalanced and absence of uncertainty; selection of judgment is subjective [51, 53, 55, 56]. Therefore, it is essential to combine an AHP technique with fuzzy set theory to deal with an imprecise environment like expert’s judgments proposed by linguistic variables [53, 56-58]. This study employed fuzzy AHP to fuzzify hierarchical analysis by allowing fuzzy numbers for the pairwise comparisons and find the fuzzy preference weight. Chang (1996) [59] presented the application of the extent analysis method on fuzzy AHP. For this purpose, Triangular Fuzzy Numbers (TFNs) are preferred for pairwise comparison scale of fuzzy AHP and extent analysis method is used for the synthetic extent value of pairwise comparison [53].
The following steps explain the computational process of Chang’s fuzzy extent analysis method [59-61].
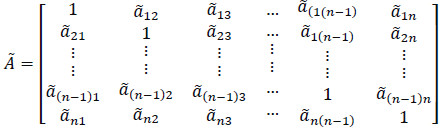
Step 1. The fuzzy judgment matrix
(aij) can be expressed mathematically as in Eq. (6) [53].
 |
(6) |
The judgment matrix
is an n×n fuzzy matrix containing fuzzy numbers
 (Eq. 7) [53].
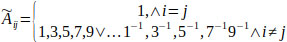 |
(7) |
Step 2. The values of the fuzzy synthetic extent with respect to ith factor is defined as Eq. (8) [59, 62, 63]:
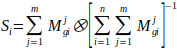 |
(8) |
Where Si is defined as the fuzzy synthetic extent value and
 is the multiplication operation of two fuzzy numbers.
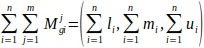
To find
 the fuzzy addition operation of m extent analysis values was performed for a certain matrix such as (Eq. 9):
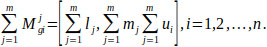 |
(9) |
To also find
 , the fuzzy addition operation of
 values was performed such as (Eq. 10):
 |
(10) |
Then, the inverse of the above vector was computed in Eq. (11) such that:
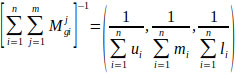 |
(11) |
Therefore, using Eq. (12) the synthetic extent value of each ith factor can be computed as:
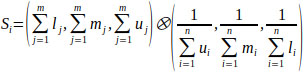 |
(12) |
Where, l is the lower limit value, m is the most promising value and u is the upper limit value (Fig. 2).
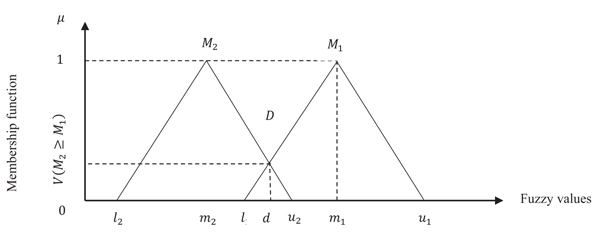
Step 3. The degree of possibility of M2 = (l2, m2, u2) ≥ M1 = (l1, m1, u1) can be defined as Eq. (13) [59, 64]:
 |
(13) |
It can be equivalently expressed as follows (Eqs. 14 and 15):
 |
(14) |
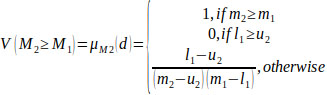 |
(15) |
Where, d is the origin of the highest intersection point D between two fuzzy
 and
and
 (Fig. 3).
In order to compare M1 and M2, the values of both V(M1 ≥ M2) and V(M2 ≥ M1) are required [53].
Step 4. The degree of possibility for convex fuzzy numbers to be greater than k convex fuzzy numbers Mi(i= 1,2,3,…,k) can be defined as Eq. (16) [59]:
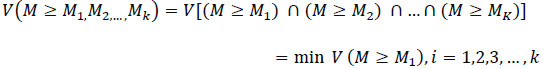 |
(16) |
Assume that (Eqs. 17 and 18)
 |
(17) |
Then, the weight vector can be given as:
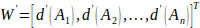 |
(18) |
Where Ai(1,2,3,…,n) are n elements.
Step 5.via normalization, the normalized weight vectors are given as follows Eq. (19) [59, 62, 63]:
 |
(19) |
Where, W is a non-fuzzy number.
3.5.1. Consistency Evaluation of the Pair-wise Comparison Matrix
Consistencies of the pair-wise comparison results were examined as consistency is a crucial issue in the realm of fuzzy AHP [65]. This consistency evaluation ensures that the judgements of the experts is consistent throughout the questionnaire survey [61]. Consistency index (CI) and the consistency ratio (CR) are computed using Eqs. (20 and 21) [66]:
 |
(20) |
 |
(21) |
Where λmax is the largest eigenvalue of the comparison matrix, n is the number of compared elements in the judgement matrix, and RI is a random index, which depends on n as depicted in Table 4. If the CR value of the comparison matrix is less than 0.10, the judgment matrix is considered to be consistent and acceptable otherwise, the decision maker has to revise the values in the pairwise comparison matrix again as it indicates that judgements expressed by experts are inconsistent [67, 68].
3.5.2. Pair-wise Comparison of Experts’ Judgement of a Fuzzy Event
A linguistic variable is a variable whose values are words or sentences in a natural or artificial language. Linguistic variables take on values defined in its set of linguistic terms. Linguistic terms are subjective categories for the linguistic variable [51]. In this study, such kind of expression was used to evaluate the critical factors or parameters influencing the estimation accuracy highway project duration by nine basic linguistic terms. Then, based on these linguistic variables and the corresponding triangular fuzzy numbers, a pairwise compa- rison matrix for each decision makers using the scales is developed and the geometric mean to form aggregated matrices is used [69]. The computational technique employed in this study is based on the following fuzzy numbers defined in Table 5 [53, 70].
3.5.3. Defuzzification Method
The defuzzification method for converting of triangular fuzzy numbers to crisp numbers was employed and performed using Eq. (22) [57].
 |
(22) |
where Mcrisp is the crisp number, l,m and u stand for the lower, medium and upper bounds of triangular fuzzy numbers, respectively.
| n | 1 | 2 | 3 | 4 | 5 | 6 | 7 | 8 | 9 | 10 |
| CR | 0 | 0 | 0.58 | 0.89 | 1.12 | 0.24 | 0.33 | 0.40 | 0.45 | 0.49 |
| Linguistic Variables | Fuzzy Number | Membership Function | TFN | Reciprocal TFN |
|---|---|---|---|---|
| Equal important (EI) |

|
M1 | (1,1,1) | (1,1,1) |
| Equal to moderate important (intermediate) (E-MI) |

|
M2 | (1,2,3) | (1/3,1/2,1) |
| Moderate important (MI) |

|
M3 | (2,3,4) | (1/4,1/3,1/2) |
| Moderate to strong important (intermediate) (M-SI) |

|
M4 | (3,4,5) | (1/5,1/4,1/3) |
| Strong important (SI) |

|
M5 | (4,5,6) | (1/6,1/5,1/4) |
| Strong to very strong important (intermediate) (S-VSI) |

|
M6 | (5,6,7) | (1/7,1/6,1/5) |
| Very strong important (VSI) |

|
M7 | (6,7,8) | (1/8,1/7,1/6) |
| Very strong to absolute important (intermediate) (VS-AI) |

|
M8 | (7,8,9) | (1/9,1/8,1/7) |
| Absolute important (AI) |

|
M9 | (8,9,10) | (1/10,1/9,1/8) |
4. DATA ANALYSIS
4.1. Reduction of Duration Estimation Accuracy Factors
The results of calculations for the degree of membership are given in Table 6. In this study, the λ-cut set method was used to reduce the optional list of duration estimation accuracy factors and identify the critical factors for the sake of simplicity of further analysis. In doing so, f(z) of each factor should meet a given benchmark value (i.e.λ) to take into account as the most influential factors. The λ-cut set approach can transfer a fuzzy set to a classical set. The pessimistic (worst) outcome is λ=0 and the optimistic outcome is λ=1. When λ=0.5, the outcome is neither pessimistic nor optimistic. In this study, the three cut-off points (thresholds) were adopted as the criterion to select the total number of critical factors from Table 5: λ=0.85, 0.90 and 0.95 [39, 71].
According to Table 6, the total number of critical duration estimation accuracy factors for each threshold are 20, 18, 12 for λ = 0.85, 0.90, 0.95, respectively. In this study, the factor xi was selected as a critical factor if its degree of membership,
 , was equal to or greater than 0.95. Accordingly, Table 7 shows the factors that are opted as significant (critical) factors or parameters to highway project duration estimation in the case of the Ethiopian highway construction industry.
The identified critical factors were then re-organized for further analysis i.e. exploratory factor analysis based on principal component analysis to cluster them into smaller groups. This analysis was performed to construct the hierarchical structure model of the critical factors to prepare them for determining their relative weight with respect to a certain group using fuzzy AHP approach based on extent value analysis.
| Factor Set x | Statistical Results | Critical Factors | Factor Set x | Statistical Results | Critical Factors | ||||||||||
|---|---|---|---|---|---|---|---|---|---|---|---|---|---|---|---|
| Mean | SD | Z | µA(xi) | λ=0.85 | λ=0.90 | λ=0.95 | Mean | SD | Z | µA(xi) | λ=0.85 | λ=0.90 | λ=0.95 | ||
| x1 | 4.01 | 1.18 | 1.28 | 0.9 | * | * | * | x23 | 3.22 | 1.15 | 0.62 | 0.73 | - | - | - |
| x2 | 4.43 | 0.88 | 2.2 | 0.99 | * | * | * | x24 | 3.45 | 1.2 | 0.79 | 0.79 | - | - | - |
| x3 | 4.14 | 0.77 | 2.14 | 0.98 | * | * | * | x25 | 3.24 | 1.09 | 0.67 | 0.75 | - | - | - |
| x4 | 3.62 | 1.13 | 0.99 | 0.85 | * | - | - | x26 | 4.34 | 0.76 | 2.43 | 0.99 | * | * | * |
| x5 | 4.14 | 1.09 | 1.51 | 0.93 | * | * | - | x27 | 4.43 | 0.84 | 2.29 | 0.99 | * | * | * |
| x6 | 4.34 | 0.99 | 1.86 | 0.97 | * | * | * | x28 | 3.87 | 1.01 | 1.36 | 0.91 | * | * | - |
| x7 | 3.32 | 1.12 | 0.73 | 0.77 | - | - | - | x29 | 3.31 | 1.47 | 0.55 | 0.71 | - | - | - |
| x8 | 3.17 | 1.33 | 0.51 | 0.69 | - | - | - | x30 | 3.99 | 1.03 | 1.45 | 0.93 | * | * | |
| x9 | 3.29 | 1.08 | 0.73 | 0.77 | - | - | - | x31 | 4.38 | 1 | 1.88 | 0.97 | * | * | * |
| x10 | 3.99 | 1.25 | 1.19 | 0.88 | * | - | - | x32 | 4.66 | 0.59 | 3.68 | 1 | * | * | * |
| x11 | 4.31 | 1.04 | 1.74 | 0.96 | * | * | * | x33 | 3.38 | 1.3 | 0.68 | 0.75 | - | - | - |
| x12 | 3.58 | 1.11 | 0.97 | 0.83 | - | - | - | x34 | 3.78 | 1.02 | 1.26 | 0.9 | * | * | - |
| x13 | 3.16 | 1.06 | 0.62 | 0.73 | - | - | - | x35 | 4.26 | 0.72 | 2.45 | 0.99 | * | * | * |
| x14 | 2.7 | 1.16 | 0.17 | 0.57 | - | - | - | x36 | 3.91 | 0.88 | 1.61 | 0.95 | * | * | * |
| x15 | 3.17 | 1.19 | 0.56 | 0.71 | - | - | - | x37 | 3.2 | 0.97 | 0.72 | 0.76 | - | - | - |
| x16 | 3.46 | 1.26 | 0.77 | 0.78 | - | - | - | x38 | 3.14 | 1.31 | 0.48 | 0.69 | - | - | - |
| x17 | 3.04 | 0.92 | 0.59 | 0.72 | - | - | - | x39 | 2.96 | 1.1 | 0.42 | 0.66 | - | - | - |
| x18 | 3.29 | 1.11 | 0.71 | 0.76 | - | - | - | x40 | 3.76 | 0.84 | 1.49 | 0.93 | * | * | - |
| x19 | 2.85 | 1.08 | 0.33 | 0.63 | - | - | - | x41 | 3.41 | 0.97 | 0.94 | 0.83 | - | - | - |
| x20 | 3.44 | 1.24 | 0.76 | 0.78 | - | - | - | x42 | 3.49 | 1.09 | 0.91 | 0.82 | - | - | - |
| x21 | 4.14 | 1.03 | 1.59 | 0.94 | * | * | - | x43 | 4.01 | 0.67 | 2.26 | 0.99 | * | * | * |
| x22 | 2.9 | 1.23 | 0.32 | 0.63 | - | - | - | ||||||||
| Critical Duration Estimation Accuracy Factors | |
|---|---|
| Project type (x1) | Number of bridges (x27) |
| Project complexity (x2) | Contractor's experience (x31) |
| Project area location (x3) | ROW acquisition costs (x32) |
| Project size (x6) | Weather condition (x35) |
| Site topography (x11) | Soil type (x36) |
| Bridge type and complexity (x26) | Total project cost (x43) |
4.2. Clustering of the Critical Duration Estimation Accuracy Factors
Applying the rate regarding the influence score for each of the 12 identified critical factors, an exploratory factor analysis based on principal component analysis was performed to identify the factors addressing the same underlying concept and cluster them into groups. For this purpose, SPSS version 24 was employed to run the analysis.
Reliability analysis. Cronbach’s α coefficient method was used to test the reliability of the dataset. Analytical process for Cronbach’s α coefficient resulted in the given data set from the information provided by the 70 successfully completed and valid respondents. The analytical results are shown in Table 8. The Cronbach’s α coefficient for the data set is more than 0.7 i.e. 0.716. Therefore, the data set is considered reliable.
| Cronbach's Alpha Coefficient | Number of Items |
| 0.716 | 12 |
Preliminary analysis. In this stage, before performing factor analysis, the Kaiser–Meyer–Olkin (KMO) and Bartlett's Test were checked because these measurements are important to perform factor analysis for the given dataset. Table 9 depicts the KMO measure of sample adequacy and Bartlett’s test for sphericity for duration related items (factors). Consequently, the KMO measure verified the sampling adequacy for the analysis, KMO = 0.603, which is well above the acceptable limit of 0.5 [72]. Bartlett’s test of sphericity χ2 (66) = 210.037, significance (p) < .001, indicated that correlations between items were sufficiently large for factor analysis. Therefore, the results of KMO and Bartlett’s test revealed that factor analysis is appropriate.
| Kaiser-Meyer-Olkin Measure of Sampling Adequacy | 0.603 | |
|---|---|---|
| Bartlett's Test of Sphericity | Approx. Chi-Square | 210.037 |
| df | 66 | |
| Sig. | 0.000 | |
It is normally crucial to look for variables that don't correlate with any other variables by scanning the correlation matrix or correlate very highly (r = 0.9) with one or more other variables [72]. If any is found then the problem could arise because of singularity in the data and therefore, one of the two variables which cause the problem can be eliminated. Scanning of the correlation matrix for the data set revealed that there is no pair of variables its r is bigger than 0.9. Thus, there is not a problem of singularity in both groups of data. In addition, it is necessary to check the determinant R of the correlation matrix. Field (2013) [72] opined that R must be greater than 0.00001. The result reveals that the determinant R-value of the data is 0.032 which is greater than the required value of 0.00001, satisfying the criteria of performing factor analysis and, therefore multicollinearity is not a problem for the given dataset.
SPSS automatically identified 5 principal components or factor groups or principal factors within the dataset through complicated correlation analysis. These 5 components were extracted and considered as a principal category using principal component analysis. In doing so, an initial analysis was conducted to find eigenvalues for each component in the given set of data. The eigenvalues related to each linear component represent the variance explained by that certain component. Five main categories had eigenvalues greater than Kaiser’s criterion of 1.0 and in integration explained 70.157% of the total variance (Table 10). Meaning that only 5 factors explain the relatively large amount of variance. Table 10 also shows the rotated component matrix, also called the rotated factor matrix that is a matrix of the factor loadings for each variable onto each component. Using the calculated loading factors, the critical duration estimation accuracy factors were effectively classified into smaller categories.
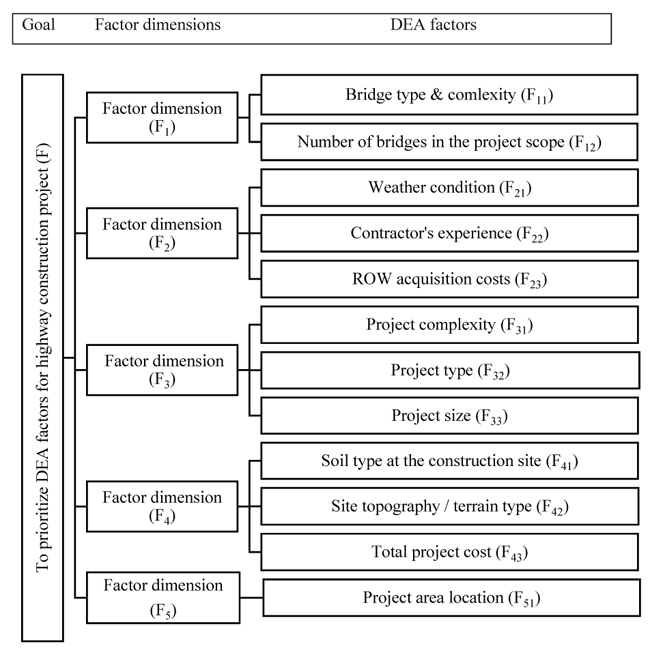
Fig. (4) depicts the clustered factors with their category name. This categorization was then used as a decision hierarchy for further analysis using fuzzy AHP with Chang’s synthetic extent value method to determine the vector weight of each factor at both sub-factor and factor level and rank them. The application of the proposed approach is presented in the subsequent section.
| Critical factors | Principal components | ||||
|---|---|---|---|---|---|
| 1 | 2 | 3 | 4 | 5 | |
| Bridge type and complexity | 0.916 | ||||
| Number of bridges in the project scope | 0.872 | ||||
| Weather condition | 0.761 | ||||
| Contractor's experience | 0.721 | ||||
| ROW acquisition costs | 0.713 | ||||
| Project complexity | 0.805 | ||||
| Project type | 0.793 | ||||
| Project size | 0.623 | ||||
| Soil type at the construction site | 0.737 | ||||
| Site topography/terrain type | 0.711 | ||||
| Total project cost | -0.439 | ||||
| Project area location | 0.812 | ||||
| Eigenvalues | 3.167 | 2.047 | 1.161 | 1.030 | 1.014 |
| Variance (%) | 16.673 | 15.804 | 15.308 | 12.532 | 9.840 |
| Cumulative variance (%) | 16.673 | 32.477 | 47.785 | 60.317 | 70.157 |
| Extraction Method: Principal Component Analysis. Rotation Method: Varimax with Kaiser Normalization. a. Rotation converged in 6 iterations. | |||||
4.3. Prioritization and Ranking of Duration Estimation Accuracy Factors
To determine the weight vector of factors in each category for the purpose of prioritizing and ranking them, a fuzzy synthetic extent (degree) value analysis based on AHP was employed. To do so, firstly, it is required to construct a judgmental comparison matrix for each category. Hence, for such purpose, the decision committee members consisted of 5 highway experts from the client, 4 experts from consulting organization and 4 academic professionals have been participated in making the pairwise comparison of factors. Based on the ratings found through decision maker’s (expert’s) input (opinion, the fuzzy evaluation (judgemental) matrices were constructed and the subsequent weight vector computations were carried out for finding their priorities using the fuzzy extent value analysis along with AHP approach. The framework of AHP based on hierarchical model to evaluate the factors is comprised of 3 levels (Fig. 4): 1st level: overall goal - to prioritize the factors; 2nd level: five-factor dimensions; lastly the 3rd level comprises 12 critical factors.
Then, the overall computational procedures of fuzzy synthetic extent (degree) value analysis for factor dimension and factor level are explained. Initially, via pairwise comparison, the fuzzy judgemental (evaluation) matrix
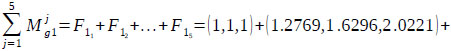
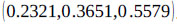
for the factor dimension level of the hierarchy is constructed. Using Eq. (22) and taking the average value of each factor, results shown in Table 11 are obtained (the aggregated fuzzy evaluation matrix). Then, the synthetic extent (degree) values of all elements for the factor dimension level in the hierarchy are computed as follows:
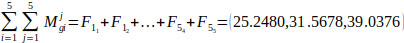
Applying Eq. (9), the fuzzy sum of the first row in the matrix is given as:
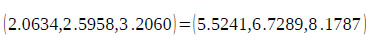
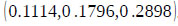
and the fuzzy sum of the whole matrix is calculated using Eq. (10) as follows:
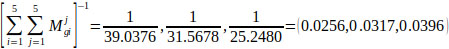
Then, using Eq. (11), the inverse matrix is given by:
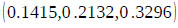
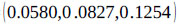
By applying Eq. (12), the synthetic extent value of F1, Sf1 is computed as follows:

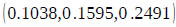
Similarly, the synthetic extent values of other elements
 are calculated as follows:


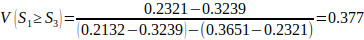
Next, the theorem of the principles of comparison of fuzzy numbers is applied to drive the weight vectors of all elements for the factor dimension level of the hierarchy with the use extent values calculated above.
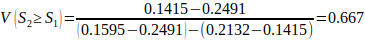
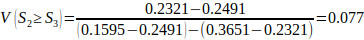
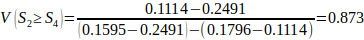
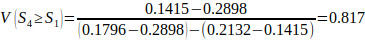
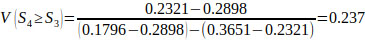
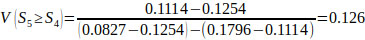
Using Eqs. (14 and 15), V(Si ≥ Sk), the following comparison results are derived.
V(S1 ≥ S2) = V(S1 ≥ S4) = V(S1 ≥ S5) = 1.


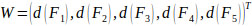
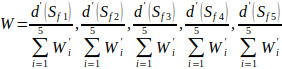
Finally, by using Eq. (17), the weight vectors of all elements of the factor level of the hierarchy are given by:
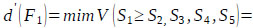
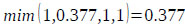
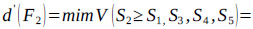


Thus, using Eq. (18)

| F1 | F2 | F3 | F4 | F5 | Consistency Test | |
|---|---|---|---|---|---|---|
| F1 | 1 | 1.6362221 | 0.483877046 | 1.040875077 | 2.608781776 | λ max = 5.096682766 C.I = 0.024170691, R.I = 1.12 C.R = 0.021580974 < 0.10 Acceptable! |
| F2 | 0.622048036 | 1 | 0.583285224 | 1.129037597 | 1.746120636 | |
| F3 | 2.103292298 | 1.7434416 | 1 | 2.259407875 | 4.434363775 | |
| F4 | 0.98250049 | 0.9172202 | 0.460333547 | 1 | 2.363249403 | |
| F5 | 0.38958196 | 0.587717 | 0.22879469 | 0.439308528 | 1 |
via normalization, the normalized weight vectors with respect to the factors, F1 ~ F5 are given by Eq. (19) as follows:

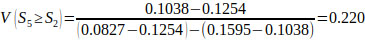
Following the similar computational process, in the 3rd level of decision hierarchy, the aggregated pair-wise comparison matrices for various critical factors with respect to each factor are constructed (Tables 12 - 15) and their respective normalized weight vectors are obtained.
5. DISCUSSION
From the computational results at factor dimension level shown in Table 11, “F3 factor dimension with normalized weight of 0.5914” was found to be the most important factor dimension which consists of project complexity, project type and project size followed by “F1 (0.2229)”; “F4 (0.1405)”; “F2 (0.0453)” and “F5 with null weight”.
| – | F11 | F12 |
|---|---|---|
| F11 | 1 | 1.2909109 |
| F12 | 0.796673656 | 1 |
| F21 | F22 | F23 | Consistency Test | |
|---|---|---|---|---|
| F21 | 1 | 1.4105687 | 1.06920565 | λ max = 3.159443034 C.I = 0.079721517, R.I = 0.58 C.R = 0.137450891< 0.10 Acceptable! |
| F22 | 0.731916459 | 1 | 2.254057739 | |
| F23 | 0.964146134 | 0.4507833 | 1 |
| F31 | F32 | F33 | Consistency Test | |
|---|---|---|---|---|
| F13 | 1 | 3.533688 | 0.806334983 | λ max = 3.067570679 C.I = 0.033785339, R.I = 0.58 C.R = 0.058250585< 0.10 Acceptable! |
| F32 | 0.290479175 | 1 | 0.423314192 | |
| F33 | 1.273595122 | 2.4219181 | 1 |
| F41 | F42 | F43 | Consistency Test | |
|---|---|---|---|---|
| F41 | 1 | 0.5844031 | 0.986695536 | λ max = 3.020969638 C.I = 0.010484819, R.I = 0.58 C.R = 0.018077274< 0.10 Acceptable! |
| F42 | 1.739301279 | 1 | 1.617209227 | |
| F43 | 1.038673016 | 0.6314006 | 1 |
| Factor Dimensions | Weight | Rank | Factors | Local Weight | Local Rank | Global Weight | Global Rank |
|---|---|---|---|---|---|---|---|
| F1 | 0.2229 | 2nd | Bridge type & complexity (F11) Number of bridges (F12) |
0.631 0.369 |
1st 2nd |
0.1406 0.0823 |
3rd 5th |
| F2 | 0.0453 | 4th | Weather condition (F21) Contractor's experience (F22) ROW costs (F23) |
0.387 0.470 0.143 |
2nd 1st 3rd |
0.0175 0.0213 0.0065 |
9th 7th 10th |
| F3 | 0.5914 | 1st | Project complexity (F31) Project type (F32) Project size (F33) |
0.539 0.000 0.461 |
1st 3rd 2nd |
0.3188 0.0000 0.2726 |
1st 11th 2nd |
| F4 | 0.1405 | 3rd | Soil type (41) Site topography (F42) Total project cost (F43) |
0.144 0.679 0.177 |
3rd 1st 3rd |
0.0202 0.0954 0.0249 |
8th 4th 6th |
| F5 | 0.000 | 5th | Project area location (F51) | 0.000 | 1st | 0.000 | 11th |
However, the prime concern of the present study is to rank the critical duration estimation accuracy factors at the 3rd level because they are more specific and requires huge attention while estimating and managing the performance of highway construction project duration. Table 12 evaluates the critical factors under F1 factor dimension. The normalized weight vector of factors with respect to factor F1 is calculated as W1=(d(F11), d(F12))T=(0.631,0.369)T. “Bridge type and complexity (F1) (0.631)’ has been reported as the most important factor compared to “Number of bridges (0.369)”. The different types of bridges under the scope of highway project can affect the contemplated time of the project. Moreover, the greater the number of bridges and the complicated the bridge design, the longer will be the time taken.
In Table 13, critical factors under dimension “F2” are checked for hierarchy. The normalized weight vector of factors with respect to factor F2 is calculated as W2=(d(F21),d(F22),d(F23))T=(0.387,0.470,0.143)T. The result reveals that “Contractor’s experience (0.0.470)” was the most important duration estimation accuracy factor, followed by “weather condition (0.387)” and ‘ROW acquisition cost (0.07617)”. The experience or performance of contractors or the engineering staff in estimating and undertaking the project is crucial for project success. In most cases, contractors are evaluated and selected based on their experience in undertaking certain project types and their past record in delivering within budget and on time with the required work quality. Furthermore, in some other cases, contractors are requested to determine the expected project duration where it is considered as the bid evaluation criteria. Thus, their experience is mandatory in such environment. This idea is agreed with other studies [1, 21, 73].
Furthermore, under factor dimension “F3” had been checked for hierarchy in Table 14. The normalized weight vector of factors with respect to F3, from Table 14, is calculated as W3=(d(F31),d(F32),d(F33))T =(0.539,0.0.000,0.461)T. From the analytical results, “Project complexity (0.539)” factor has been obtained the most important duration estimation accuracy factors followed by “Project size (0.461)’ and “Project type (0.000)”. In this regard, it is important to notice that a certain project must be fully understood by the estimators (quantity surveyors) and project administrators for timely delivery of the project so that no claim will be raised due to late completion. It is the fact that project design and its complexity is one of the determinant factors for the project site performance which affects project contract duration. Moreover, the complexity of the project is ranked 3rd in the study conducted by Aziz and Abdelhakam (2016) [74] as the cause of delay in road construction projects.
Next, critical duration estimation accuracy factors under factor dimension “F4” had also been checked for decision hierarchy. The normalized weight vector of sub-factors with respect to F4, from Table 15, is calculated as W4=(d(F41),d(F42),d(F43))T=(0.144,0.679,0.177)T. This computational result shows that ‘Site topography or terrain type (0.679)’ was found to be the most important factor to the project time/duration performance, followed by ‘Total project cost (0.177)’ and ‘Soil type (condition) at the construction site (0.144)’. It can figure out that, poor site layout is identified as one of the most significant factors influencing the duration estimation accuracy of the highway construction projects. Aziz and Abdelhakam also proved that it is one of the top delay causing factors in road construction projects.
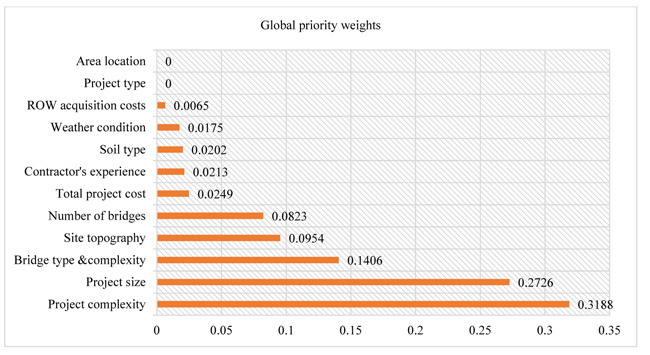
Simultaneously, it is quite crucial to check the consistency of the decision makers while evaluating the critical duration estimation accuracy factors to generate the pairwise comparison matrix. According to this study, it can be inferred that the values of consistency ratio are in permissible range, < 0.10, for all pairwise comparison matrix shown in Tables 12-15, ensuring reliability and consistency of decision-makers while evaluating the highway project duration estimation accuracy factors [75]. To summary, the local priority weights of the factors with respect to the various factor dimension and their global priority weights are summarized in Table 16. Furthermore, since presentation graphics help for making reports in a better way, the global priority weight data of all the critical factors were presented using a bar chart as shown in Fig. (5) [76].
According to the global weight depicted in Table 16 and Fig. (5), the top four ranking factors that affect the accuracy of duration estimation in the case of highway construction projects are project complexity, project size, bridge type and complexity and site topography (or terrain type). These factors have a direct consequence on project time duration performance. Hence, the project administrators should focus on these factors while estimating and managing the time duration of highway construction projects.
6. MANAGERIAL IMPLICATIONS
The above results convey certain practical implications for construction management. Highway experts, especially construction managers, must be aware that there are few but most significant factors that affect the estimation accuracy of highway project duration or completion time which is increasingly professed in terms of project time performance. It is required to analyze the impact of the top-ranked duration estimation accuracy factors on the highway project duration and serious attention must be considered at the early stages in the project development. This helps the construction managers and project administrators to advance the estimation accuracy of highway construction project duration.
CONCLUSION
An accurate prediction of construction project duration is crucial to contract administration. Furthermore, the accuracy of the estimate is critical to guarantee the successful accomplishment of a particular construction project as time or duration is one of the main project constraints among project iron triangles. However, establishing realistic estimates for project completion time is still one of the most challenging aspects of planning a project. To manage it successfully, identifying, defining, and prioritizing the most significant factors affecting the accuracy of project duration at the early phases of project development are undeniably important through a more sound and systematic way. The main objective of this study was to identify, analyze and prioritize the critical duration estimation accuracy factors in the case of highway construction projects. To do so, the initial list of duration estimation accuracy factors composed from extant literature and expert interview was reduced to small sizes, the so-called critical factors, using a λ-cut set method. This made the next process easy i.e. the construction of the pairwise comparison matrix and the computational analysis of fuzzy AHP to determine the relative weight of the critical factors.
Then, factor analysis was carried out to cluster the critical factors into groups. This categorization of factors was utilized for the construction of a hierarchy model structure to easily apply fuzzy AHP. Due to the subjective and qualitative nature of the factors (experts prefer natural language expressions rather than sharp numerical values) used in their evaluation, applying fuzzy set theory was found to be appropriate for a satisfactory result. Accordingly, Chang’s synthetic extent analysis on fuzzy AHP was applied to determine the weight of each critical factor clustered in a different group. The proposed hierarchy model used in this study comprises five-factor dimensions (groups) and twelve critical factors. The analytical results obtained in the above calculations reveal the critical factors in the case of Ethiopia highway construction industry. However, the presented model can also be employed in any country. In this study, project complexity, project size and bridge type and complexity were found to be the three most crucial factors that must be a serious concern while estimating and managing highway projects in Ethiopia.
In regard to different methods or approaches, the present study used Chang’s synthetic extent (degree) value analysis along with fuzzy AHP methodology to determine the normalized weight vector for the critical duration estimation accuracy factors and prioritize them. However, this is not the only approach for prioritization purpose. Also, other methods such as Van Laarhoven and Pedrycz’s fuzzy priority method, Buckley’s geometric mean method, Mikhailov’s fuzzy preference programming method and Mikhailov’s fuzzy prioritization method could be used for evaluation and prioritization of highway project duration estimation accuracy factors. Then, the results of these methods could be compared to the results found in the present study.
CONSENT FOR PUBLICATION
Not applicable.
AVAILABILITY OF DATA AND MATERIALS
The data that support the findings of this research are available from the corresponding author upon a reasonable request.
FUNDING
None.
CONFLICT OF INTEREST
The authors declare no conflict of interest, financial or otherwise.
ACKNOWLEDGEMENTS
The authors express their sincere thanks to the Pan African University Institute for Basic Science, Technology and Innovation (PAUISTI) for the general support provided to achieve the scientific research.

