All published articles of this journal are available on ScienceDirect.
Assessing the Dynamic Behaviour of Midrise Frame Structures Sitting on Silty Sandy Soil
Abstract
Background:
Midrise 5 to 15 storeys frame structures sitting on soft soils are susceptible to damage induced by seismic events. The level of damage is related to the interaction between the structure, foundation and soil called Soil Structure Interaction (SSI). If the level of ground acceleration is low, the wave gets amplified putting the structure at risk of collapse.
Objective and Methods:
Concerns about SSI have motivated several researchers to investigate the seismic behaviour of structures rested on cohesive and cohesionless soils. The objective of the work presented in this paper is to evaluate the effects of several parameters on the seismic soil structure interaction behaviour of midrise structures sitting on silty sandy soil. Using ABAQUS, reliable 3D models of 5 to 15 storeys midrise concrete frame structures rested on raft foundation were built. The effects of the structure’s number of storeys, raft size and thickness were explored for different column sizes. Fixed-based structures which capture the model adopted in seismic codes and flexible-based structures were hit at the bottom by El-Centro (1940) and Northridge (1994) earthquakes.
Results and Conclusion:
The results, presented in terms of storey lateral deflection, inter-storey drift, shear force, foundation rocking and response spectrum showed the important contribution of SSI effects on the behaviour of the midrise structures. The model analyses indicated that column size strongly affects the behaviour of flexible structures. Let N be the structure number of storeys and C the column size. The results showed that in terms of storey lateral deflection and levelling shear force, for column sizes C 0.5 X 0.5 m, SSI was detrimental to structures with 10 ≤ N ≤ 15 and beneficial to structures with 5 ≤ N <10. Increasing the column size to C 0.5 X 1 m showed that SSI became detrimental for structures with 10 < N ≤ 15 under El-Centro (1940) and for structures with 7≤ N ≤ 15 under Northridge (1994), and beneficial for structures with 5 ≤ N ≤ 10 under El-Centro (1940) and for structures with 5 ≤ N < 7 under Northridge (1994). The FE results showed that even though base shear increased with raft size, lateral deflections were amplified for C 0.5 X 0.5 m S15 structures and attenuated for C 0.5 X 1 m S15 structures. However, the seismic response of S15 structures was slightly affected by the variation in raft thickness under both column sizes. Finally, the paper includes a discussion and evaluation of the contribution of inertial and kinematic effects, including soil types used on the simulated numerical models’ seismic responses.
1. INTRODUCTION
Midrise structures having 5 to 15 storeys supported by raft foundations are susceptible to damage caused by earthquakes. The interaction between the structure, foundation and soil, called “Soil Structure Interaction (SSI)”, can amplify the seismic wave, putting the structure at risk of collapse. Depending on the soil spectral acceleration, SSI causes an increase in the fundamental period, damping ratio and lateral displacement. In addition, it causes an increase or a decrease in a flexible structure’s base shear founded on soft soil compared to a fixed-based structure’s base shear [1].
The interest and awareness regarding the effects of SSI have significantly increased after the 1964 M w =9.2 Great Alaska earthquake and 1964 M w =7.5 Niigata earthquake. A number of experimental, analytical and numerical studies were conducted by Stewart et al . [ 1 ], Shehata et al . [ 2 ], Dhileep et al. [ 3 ], Mylokanis and Gazetas [ 4 ], Yue and Wang [ 5 ], Tena-Colunga [ 6 ], Ruiz, [ 8 ], etc. to study SSI’s effects. However, local site effects were not considered in building codes and it was not until after 1971 M w =6.6 San Fernando earthquake that such effects were taken into account. Currently, seismic codes provide design charts based on 1D free-field response analysis such as Shake program. In addition, these codes recommend ignoring SSI effects in structures built on soft soils. Several studies, such as Stewart et al. [2], Shehata et al. [3], Dhileep et al. [4], Mylonakis and Gazetas [5] proved that gaps exist in seismic codes and SSI can have negative effects on soft soils. In addition, other studies such as Yue and Wang [6], Tena-Colunga [7] and Ruiz [8] compared the seismic structures guidelines of different codes and pointed out their limitations.
Using the direct method of analysis, the significance and importance of SSI on structural response and design were considered by Velestos and Meek [9], Wolf [10], Luco et al. [11], Ciampoli and Pinto [12], ATC [13], Farghali and Ahmed [14], Tabatabaiefar et al. [15]. The effects of structural and soil damping behaviour have also been considered by Farghali and Ahmed [14], Hatami et al. [16], Xinxian et al. [17] and Star et al. [18]. Jayalekshmi and Chinmayi [19] and Farghali et al. [14] studied the influence of shear wall and retaining walls’ positions while Armouni [20, 21], Shatnawi and al-Qaryouni [22], Bayat et al. [23] and Djedoui et al. [24] considered different types of dampers to reduce base-isolated building response.
Gajan and Kutter [25] showed that material and geometric nonlinearity in soil may be beneficial to seismic structural performance. While Turan et al. [26] found that increasing the embedment depth forces leads flexible-based structure’s frequency to approach fixed-base structure’s frequency. The effect of foundation type for structures built on clayey soils was considered by Shehata et al. [3], Yingcai [27], Hokmabadi et al. [28, 29], Homabadi and Fatahi [30], Kumar [31], Visuyasam and Chandrasekaran [32] and Nguyen et al. [33,34 ]. In addition, the effect of structure’s number of storeys also for structures built on clayey soils was studied by Shehata et al. [3], Farghaly and Ahmed [14], Nadar et al. [35], Hayashi and Takahashi [36], Torabi and Rayhani [37]. Results showed that SSI increases the building's storey displacement [3, 14, 35] that is mostly affected at the lower storeys [12, 15]. Empirical models that predict the seismic performance of structures while considering SSI effects were proposed by Safak [38], Masaeli et al. [39], Tabatabaiefar et al. [40, 41] Sameto and Ghannad [42] and Lu et al. [43].
In this paper, we analysed the seismic response of midrise frame structures using 3D finite element models in ABAQUS. Most research analysing the effects of SSI was performed using dashpots in 2D, and a limited number of studies were performed in 3D, which better captures reality. In fact, the seismic response of flexible structures is highly dependent on the soil boundary limits and conditions in all directions. The propagation of the wave in all directions, captured using 3D models, strongly affects the amplitude of the wave at the base of the structure-foundation model, and therefore, the behaviour of the structure as a whole. Another limitation of existing studies is that they tend to focus on midrise structures built on clayey soils. However, in many countries, in Lebanon for example, midrise structures are commonly built on silty sandy soils. In this paper, we explored and assessed the effects of several parameters on the seismic response of midrise concrete frame structures supported on raft foundation and silty sandy soil type. We studied the effects of the following parameters: the structure’s number of storeys (N), raft size (B) and raft thickness (e) for two different column sizes (C). The lateral displacement, inter-storey drift, levelling shear force, foundation rocking and response spectrum were obtained from the 3D models. Fixed and flexible-based structures were hit at the bottom by two strong ground motions: El-Centro (1940) and Northridge (1994) earthquakes. Finally, the FE results were analysed to assess the influence of the studied parameters on inertial and kinematic SSI effects.

| G (MPa) |
Poisson’s Ratio ν |
Dry Unit Weight γd (kN/m3) |
Void Ratio e |
Internal Friction Angle: ϕ (ᵒ) |
Dilation Angle: Ψ (ᵒ) |
Soil Apparent Cohesion: c (kPa) |
| 7.7 | 0.3 | 18.98 | 0.4 | 35 | 10 | 50 |
| Earthquake | Cyclic shear strain: γc (%) | Ratio of shear modulus: G/Gmax | Damping ratio: ζ (%) | Mass damping factor: α | Stiffness damping factor: β | Plasticity index: PI (%) |
| El-Centro (1940) | 1.72 | 0.085 | 20 | 0.63 | 0.066 | 15 |
| Northridge (1994) | 1.82 | 0.0769 | 21 | 0.65 | 0.068 | 15 |
| Structures Dimensions (m) | ||||||||||||||
| Number of Bays | Storey Height | Bay Width | Beam | Slab | ||||||||||
| 3 | 3 | 5 | 0.5 X 0.5 | 5 X 5 X 0.25 | ||||||||||
| Effect of | Reference name | Number of storeys | Raft Dimension (m) | Column size (m) | Concrete Young Modulus Ec (GPa) | Structure's | ||||||||
| Length | Width | Thickness | α | Β | ||||||||||
| Structure's Number of storeys & Column Sizes | S15 | 15 | - | - | - | 0.5 X 0.5 | 14 | 0.22 | 0.008 | |||||
| S15-e-1.5m | 15 | 20 | 20 | 1.5 | 0.5 X 0.5 | 14 | 0.22 | 0.008 | ||||||
| S12 | 12 | - | - | - | 0.5 X 0.5 | 14 | 0.29 | 0.007 | ||||||
| S12-e-1.2m | 12 | 20 | 20 | 1.2 | 0.5 X 0.5 | 14 | 0.29 | 0.007 | ||||||
| S10 | 10 | - | - | - | 0.5 X 0.5 | 14 | 0.32 | 0.006 | ||||||
| S10-e-1m | 10 | 20 | 20 | 1 | 0.5 X 0.5 | 14 | 0.32 | 0.006 | ||||||
| S7 | 7 | - | - | - | 0.5 X 0.5 | 14 | 0.5 | 0.004 | ||||||
| S7-e-0.7m | 7 | 20 | 20 | 0.7 | 0.5 X 0.5 | 14 | 0.5 | 0.004 | ||||||
| S5 | 5 | - | - | - | 0.5 X 0.5 | 14 | 0.52 | 0.003 | ||||||
| S5-e-0.5m | 5 | 20 | 20 | 0.5 | 0.5 X 0.5 | 14 | 0.52 | 0.003 | ||||||
| S15 | 15 | - | - | - | 0.5 X 1 | 14 | 0.25 | 0.007 | ||||||
| S15-e-1.5m | 15 | 20 | 20 | 1.5 | 0.5 X 1 | 14 | 0.25 | 0.007 | ||||||
| S12 | 12 | - | - | - | 0.5 X 1 | 14 | 0.32 | 0.006 | ||||||
| S12-e-1.2m | 12 | 20 | 20 | 1.2 | 0.5 X 1 | 14 | 0.32 | 0.006 | ||||||
| S10 | 10 | - | - | - | 0.5 X 1 | 14 | 0.37 | 0.005 | ||||||
| S10-e-1m | 10 | 20 | 20 | 1 | 0.5 X 1 | 14 | 0.37 | 0.005 | ||||||
| S7 | 7 | - | - | - | 0.5 X 1 | 14 | 0.57 | 0.003 | ||||||
| S7-e-0.7m | 7 | 20 | 20 | 0.7 | 0.5 X 1 | 14 | 0.57 | 0.003 | ||||||
| S5 | 5 | - | - | - | 0.5 X 1 | 14 | 0.6 | 0.003 | ||||||
| S5-e-0.5m | 5 | 20 | 20 | 0.5 | 0.5 X 1 | 14 | 0.6 | 0.003 | ||||||
| Raft and Column Sizes | S15 | 15 | - | - | - | 0.5 X 0.5 | 14 | 0.22 | 0.008 | |||||
| S15-1.3B | 15 | 20 (1.3B) | 20 (1.3B) | 1.5 | 0.5 X 0.5 | 14 | 0.22 | 0.008 | ||||||
| S15-1.5B | 15 | 22.5(1.5B) | 22.5(1.5B) | 1.5 | 0.5 X 0.5 | 14 | 0.22 | 0.008 | ||||||
| S15-2B | 15 | 30 (2B) | 30 (2B) | 1.5 | 0.5 X 0.5 | 14 | 0.22 | 0.008 | ||||||
| S15- C-0.5-1m | 15 | - | - | - | 0.5 X 1 | 14 | 0.25 | 0.007 | ||||||
| S15-1.3B-C-0.5-1m | 15 | 20 (1.3B) | 20 (1.3B) | 1.5 | 0.5 X 1 | 14 | 0.25 | 0.007 | ||||||
| S15-1.5B-C-0.5-1m | 15 | 22.5 (1.5B) | 22.5 (1.5B) | 1.5 | 0.5 X 1 | 14 | 0.25 | 0.007 | ||||||
| S15-2B-C-0.5-1m | 15 | 30 (2B) | 30 (2B) | 1.5 | 0.5 X1 | 14 | 0.25 | 0.007 | ||||||
| Raft Thickness and Column Sizes | S15 | 15 | - | - | - | 0.5 X 0.5 | 14 | 0.22 | 0.008 | |||||
| S15-e-2m | 15 | 20 | 20 | 2 | 0.5 X 0.5 | 14 | 0.22 | 0.008 | ||||||
| S15-e-1.5m | 15 | 20 | 20 | 1.5 | 0.5 X 0.5 | 14 | 0.22 | 0.008 | ||||||
| S15-e-1m | 15 | 20 | 20 | 1 | 0.5 X 0.5 | 14 | 0.22 | 0.008 | ||||||
| S15- C-0.5-1m | 15 | - | - | - | 0.5 X 1 | 14 | 0.25 | 0.007 | ||||||
| S15-e-2m-C-0.5-1m | 15 | 20 | 20 | 2 | 0.5 X 1 | 14 | 0.25 | 0.007 | ||||||
| S15-e-1.5m- C-0.5-1m | 15 | 20 | 20 | 1.5 | 0.5 X 1 | 14 | 0.25 | 0.007 | ||||||
| S15-e-1m- C-0.5-1m | 15 | 20 | 20 | 1.5 | 0.5 X 1 | 14 | 0.25 | 0.007 | ||||||
| Reference Name | El-Centro (1940) | Northridge (1994) | ||||||||||||||
|
Max δ (m) |
δflexible/ δfixed |
Max V (kN) |
Vflexible/ Vfixed |
Max δ (m) |
δflexible/ δfixed |
Max V (kN) |
Vflexible/ Vfixed |
|||||||||
| C0.5X0.5m | S15 | 0.162 | - | 5557.20 | - | 0.644 | - | 9173.95 | - | |||||||
| S15-e-1.5m | 0.308 | 1.90 | 5550.69 | 1.00 | 1.034 | 1.61 | 8788.61 | 0.96 | ||||||||
| S12 | 0.102 | - | 4219.58 | - | 0.611 | - | 10654.00 | - | ||||||||
| S12-e-1.2m | 0.143 | 1.40 | 4634.26 | 1.10 | 1.021 | 1.67 | 10595.70 | 0.99 | ||||||||
| S10 | 0.101 | - | 4048.55 | - | 0.485 | - | 11422 | - | ||||||||
| S10-e-1m | 0.131 | 1.29 | 4577.97 | 1.13 | 0.817 | 1.68 | 11444.60 | 1.00 | ||||||||
| S7 | 0.091 | - | 6786.22 | - | 0.393 | - | 11620.00 | - | ||||||||
| S7-e-0.7m | 0.069 | 0.76 | 3694.03 | 0.54 | 0.182 | 0.46 | 11791.00 | 1.01 | ||||||||
| S5 | 0.072 | - | 5295.10 | - | 0.169 | - | 8847.36 | - | ||||||||
| S5-e-0.5m | 0.039 | 0.54 | 3061.43 | 0.58 | 0.153 | 0.91 | 8625.49 | 0.97 | ||||||||
| C0.5X1m | S15 | 0.099 | - | 6619.64 | - | 0.688 | - | 20425.90 | - | |||||||
| S15-e-1.5m | 0.380 | 3.85 | 6281.49 | 0.95 | 1.125 | 1.64 | 16529.50 | 0.81 | ||||||||
| S12 | 0.076 | - | 6622.09 | - | 0.490 | - | 23522.90 | - | ||||||||
| S12-e-1.2m | 0.151 | 1.98 | 5072.78 | 0.77 | 0.823 | 1.68 | 20155.30 | 0.86 | ||||||||
| S10 | 0.097 | - | 10000.05 | - | 0.296 | - | 22468.30 | - | ||||||||
| S10-e-1m | 0.085 | 0.87 | 5106.63 | 0.51 | 0.593 | 2.00 | 20337.20 | 0.91 | ||||||||
| S7 | 0.076 | - | 7937.67 | - | 0.171 | - | 14419.30 | - | ||||||||
| S7-e-0.7m | 0.049 | 0.64 | 3578.24 | 0.45 | 0.227 | 1.33 | 14806.50 | 1.03 | ||||||||
| S5 | 0.071 | - | 8910.27 | - | 0.168 | - | 20114.80 | - | ||||||||
| S5-e-0.5m | 0.014 | 0.20 | 2654.03 | 0.30 | 0.070 | 0.42 | 8262.45 | 0.41 | ||||||||
2. MATERIALS AND METHODS
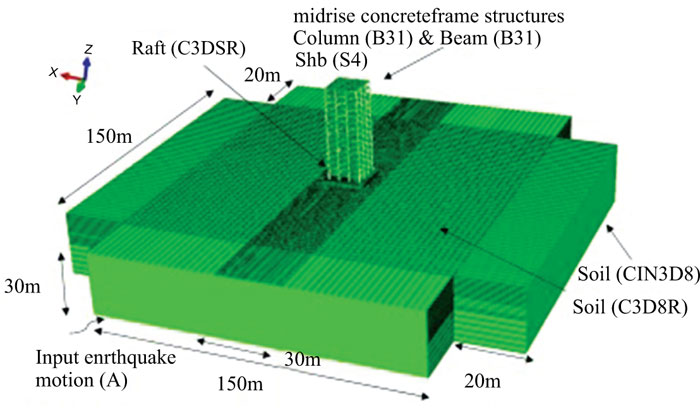
3D finite element models, consisting of the structure, raft foundation and soil block, were built in ABAQUS 2017 [44] using the direct method of analysis to simulate the seismic SSI of midrise frame structures (Fig 1). The 3D models were simulated at the same time. Therefore, the dynamic equation of motion of the soil-foundation-structure system is given as follows:
 |
(1) |
where: {ü}, {ü}and {u} refer to the nodal accelerations, velocities and displacements with respect to the underlying soil foundation respectively, [M], [C] and [K] refer to the mass, damping and stiffness matrices of the structure respectively, [K] refers to the stiffness tangential matrix, üg refers to the earthquake acceleration at the base of the model, {Fv} refers to the force vector that corresponds to the viscous soil quiet boundaries and {m} = [1,0,0,1,0,0,...,0]T since only horizontal acceleration was considered in this paper.
In this paper, two scenarios were adopted. The first scenario corresponded to fixed-based structures resembling the models adopted in seismic codes. In the second scenario, flexible-based structures that capture the interaction between the structure, foundation and soil were analysed. Both scenarios were hit at their bases by the far field El-Centro (1940) and the near-field Northridge (1994) earthquakes (Fig. 2).
All simulated structures were formed of 3 X 5 m bays in both horizontal directions. The height of every storey was taken to be equal to 3 m. In addition, slab thickness was taken to be equal to 25 cm and beam sections were taken to be equal to 50 X 50 cm, while column sections were taken to be equal to 50 X 50 cm and 50 X 100 cm. Note that live and dead loads of 2.5 kN/m2 were applied to the structures’ floors.
The beams and columns were modelled using 2-node linear beam elements B31 with 9400 elements. The slab was modelled using 4-node doubly curved shell with 100 elements. In addition, the structure was supported by a raft foundation built using eight-node linear brick, reduced-integration, hourglass control continuum solid elements C3D8R with 4800 elements. The structure-raft system was rested on a dense silty sandy soil which was modelled using eight node linear brick, reduced-integration, hourglass control continuum solid elements C3D8R with 96500 elements. To account for the absorbed energy from the unbounded soil domain, the far-field soil, in both horizontal directions, was modelled using 8-node linear one-way infinite brick elements CIN3D8. Finally, to simulate bedrock conditions, the bottom soil boundary was defined as a rigid boundary [45, 46].
In this study, the beams and floor slabs were tied using the tie command in ABAQUS. In addition, the structure-raft interface was modelled by tying the columns and raft foundation while the raft-soil interface was modelled by tying the raft bottom surface with the soil top surface. Noting that embedded columns were inserted in the raft in flexible models.
In this paper, the soil medium is a granular soil with silt whose presence imparts a degree of apparent cohesion (Table 1). Such material is typical of Lebanese mountainous areas. The conventional elasto-plastic Mohr Coulomb model (MC) was used to model the soil medium. The equivalent linear method was performed to estimate the values of soil damping ratio (ζ) and shear modulus (G) for each earthquake [47-49].
In the models analysed, reinforced concrete having a density of 2400 kg/m3 and Poisson’s ratio of 0.2 was used. The inelastic behaviour of structural elements was modelled using elastic-perfectly plastic material while considering Rayleigh damping to account for the building dissipated energy. The natural frequencies and model’s mode shapes were obtained from ABAQUS using linear perturbation procedure and Lancoz method. Therefore, as detailed in Table 2, based on first and second mode frequencies (fi and fj in rad/s) obtained from ABAQUS and for 5% structural damping (ζ) for the structure and ζ soil damping obtained from the linear equivalent method analysis, the mass damping factor (α) and the stiffness damping factor (β) can be calculated for the structure and the soil block (Chopra [50]) based on:
 |
(2) |
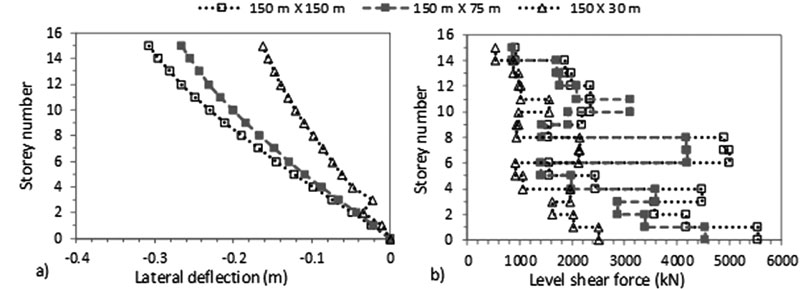
A mesh sensitivity analysis was performed in ABAQUS to obtain a mesh configuration that would optimize the accuracy of the results with simulations computational speed. In addition, the effect of soil boundary limits was tested in both soil block horizontal directions based on the studies of Rayhani and El Naggar [45] and Ghosh and Wilson [51]. As a result, a baseline case of 15 storey midrise frame structure rested on 20 m X 1.5 m X 30 m (width X thickness X depth) raft foundation and dense silty sandy soil block hit at the bottom by El-Centro (1940) earthquake was used to study the variation of soil boundary limits. Therefore, the soil boundary limits were varied between 30, 75, 83, 98, 113, 150 and 180 m corresponding to 2B, 5B, 5.5B, 6.5B, 7.5B, 10B and 12B respectively with B being the width of the structure. These lengths exclude the lengths of quiet boundary conditions that were set to be equal to 20 m.
In order to minimize the size of the soil model, and since earthquakes were hit in the X direction, the soil boundary limit in the Y direction was varied between 150 m, 75 m and 30 m. Note that studies available in the literature such as Nguyen et al. [33] only consider a 30 m soil width in the Y direction. Therefore, two sets of varied boundary limits were simulated: (1) square soil blocks corresponding to the same X and Y horizontal soil limits: 83 m X 83 m, 98 m X 98 m, 113 m X 113 m, 150 m X 150 m and 180 m X 180 m and (X direction X Y direction) and (2) rectangular soil blocks with different X and Y soil limits: 150 m X 30 m, 150 m X 75 m and 150 m X 150 m. The results of the 10B and 12B cases are very close. In addition, increasing the soil limit from 4R to 9R (5.5B to 12B) leads to a 28% difference in lateral defection results. In Fig. (3), the results show the importance of modelling enough soil limit in the direction perpendicular to the earthquake load. Square soil blocks present higher lateral deflections than rectangular soil blocks. In fact, the 75 and 30 m limits do not allow enough distance for reflexive wave effects. Therefore, a soil boundary limit equal to 10B in both horizontal directions was adopted in the analysis. Note that these values are greater than the recommended ones given by Ghosh and Wilson [51] and Rayhani and El-Naggar [45]. Ghosh and Wilson [51] proved that the distance from the centre of the foundation to the soil horizontal boundary should be 3-4 times the foundation radius and to the vertical boundary 2-3 times the foundation radius to obtain insignificant reflexive wave effects. In addition, Rayhani and El-Naggar [45] showed that most ground motion amplification occurs within the first 30 m of the soil profile and increasing the soil boundary from 5 to 10 times the width of the structure leads only to a 5% difference in the results.
In this paper, as a result of the assumptions and parameters presented in this section, every 3D time history model that was conducted in ABAQUS took around 60 hours to be completed using fast computational facilities at Université Saint-Joseph de Beyrouth.
| - | Fundamental Period (s) | |||
| Reference Name- | C0.5X0.5m | C0.5X1m | EC8: T=0.075H3/4 [56] | ASCE 7-10: T=0.0466H0.9 [55] |
| S15 | 2.128 | 1.852 | 1.303 | 1.433 |
| S15-e-1.5m | 2.703 | 2.439 | 1.303 | 1.433 |
| S12 | 1.667 | 1.496 | 1.102 | 1.172 |
| S12-e-1.2m | 2.128 | 2.042 | 1.102 | 1.172 |
| S10 | 1.471 | 1.282 | 0.961 | 0.995 |
| S10-e-1m | 2.041 | 2.023 | 0.961 | 0.995 |
| S7 | 0.935 | 0.829 | 0.736 | 0.722 |
| S7-e-0.7m | 2.000 | 2.018 | 0.736 | 0.722 |
| S5 | 0.926 | 0.811 | 0.572 | 0.533 |
| S5-e-0.5m | 2.000 | 2.016 | 0.572 | 0.533 |
| S15-1.3B | 2.703 | 2.439 | 1.303 | 1.433 |
| S15-1.5B | 2.564 | 2.381 | 1.303 | 1.433 |
| S15-2B | 2.439 | 2.273 | 1.303 | 1.433 |
| S15-e-2m | 2.703 | 2.439 | 1.303 | 1.433 |
| S15-e-1.5m | 2.703 | 1.961 | 1.303 | 1.433 |
| S15-e-1m | 2.703 | 2.439 | 1.303 | 1.433 |
3. RESULTS AND ANALYSIS
3D finite elements using ABAQUS were performed to assess the dynamic behaviour of midrise concrete frame structures rested on silty sandy soil. The effect of the structure’s number of storeys as well as the raft foundation dimension, thickness and size, were analysed for two different column sizes as detailed in Table 2. The storey lateral deflection, inter-storey drift, shear force, foundation rocking and response spectrum were reported and calculated for all modelled structures.
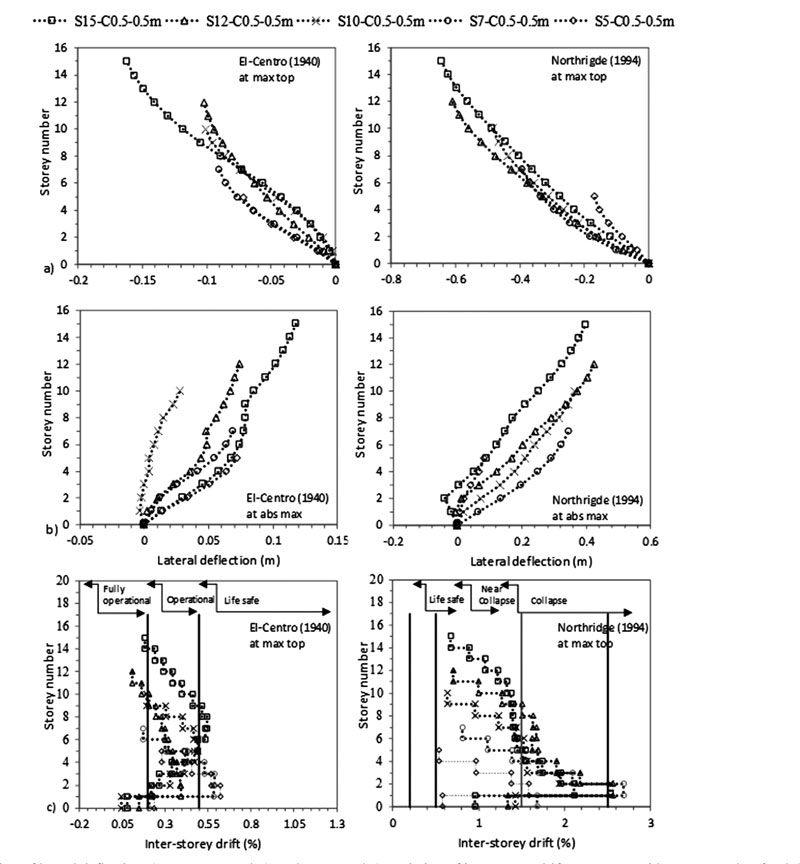
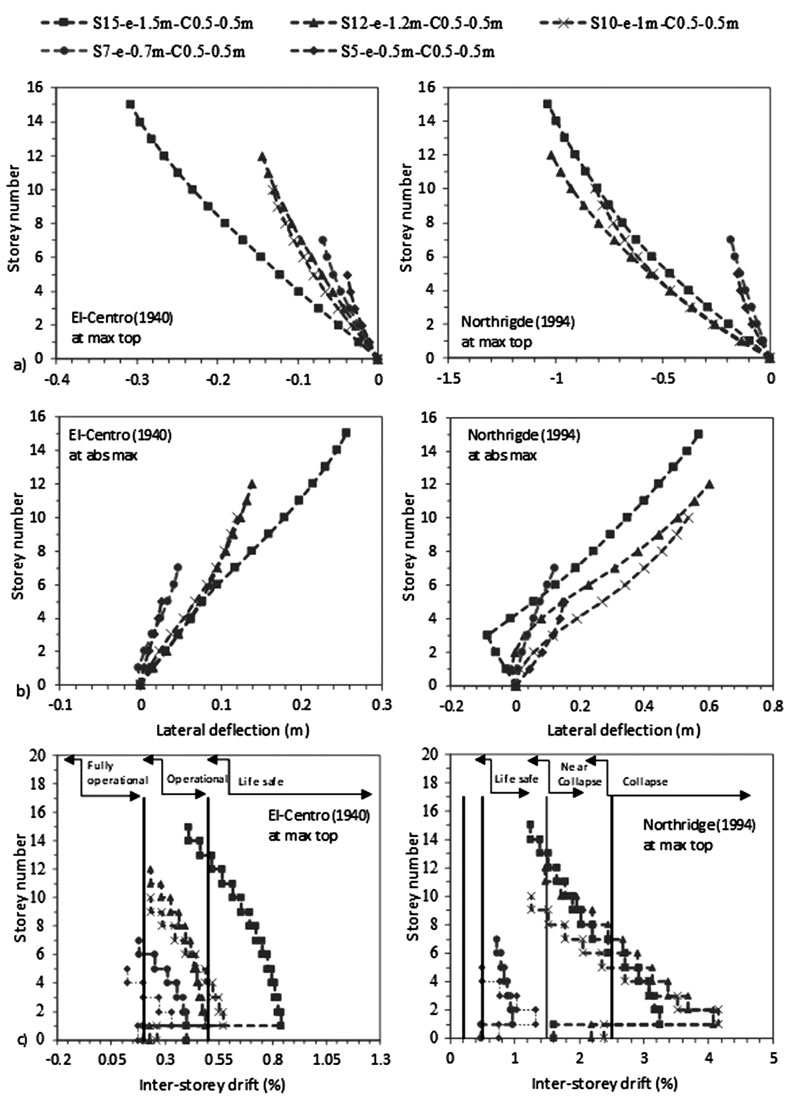
The lateral deflection at each storey was measured relative to the lateral deflection at the base of the structure. Based on Hokmabadi et al. [29], the lateral deflection was extracted (1) when the maximum lateral deflection occurred at top of the structure, referred to as “max top”, and (2) when the maximum absolute lateral deflection occurred at each storey regardless the time it occurred, referred to as “abs max”.
To report the level of damage produced by an earthquake and to guarantee meeting deformation-base criteria, seismic codes calculate inter-storey drift values [52-56]. In this study, inter-storey drifts were calculated by subtracting the deflections of two successive storeys and then normalizing it by the storey height.
Foundation rocking, through its rocking and distortion components, happens when the inertial forces in a structure cause compression on one side of the foundation and tension on the other side. In this study, the foundation rocking was calculated by subtracting the uplift raft displacement in the seismic load direction (X direction) and then dividing it by the raft width. Note that it is expressed in units of degrees.
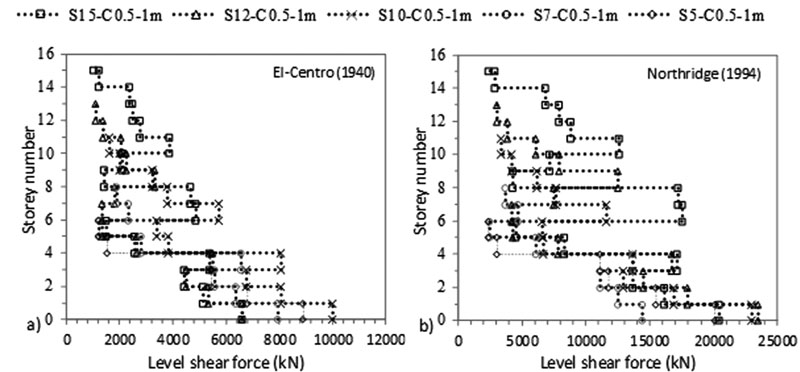
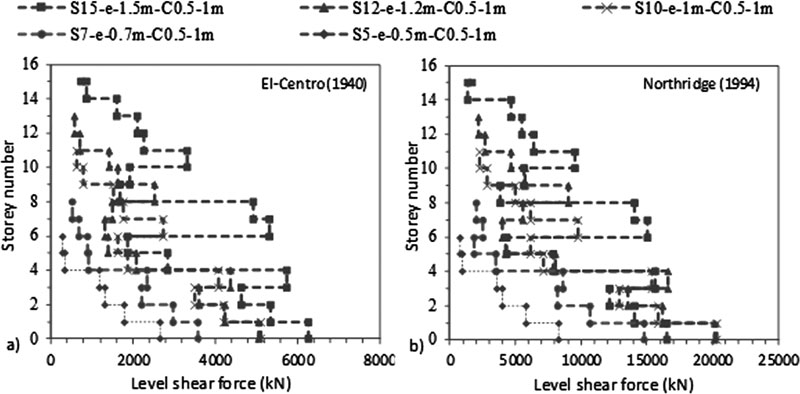
The maximum absolute shear force at every level was obtained by summing up shear forces produced by every column at that storey during the time history analysis. In addition, using FORTRAN code, pseudo-acceleration response spectrum (Sa) plots were created at 5% structural damping for horizontal accelerations at the base of the modelled structures. Finally, Fourier transformations at 5% structural damping were produced using MATLAB [57] for different strong ground motions accelerations: earthquake input, top of the soil profile (Free Field: FF) and base of the structure-foundation model.
| Ax (m/s2) | El-Centro (1940) | Northridge (1994) | |||||||
| Reference Name | Input EQ | FF | Base | Top | Input EQ | FF | Base | Top | |
| C0.5X0.5m | S15 | 3.13 | - | 3.13 | 3.46 | 8.24 | - | 8.24 | 8.69 |
| S15-e-1.5m | 3.13 | 0.783 | 1.33 | 4.08 | 8.24 | 3.13 | 5.31 | 6.92 | |
| S12 | 3.13 | - | 3.13 | 4.46 | 8.24 | - | 8.24 | 11.22 | |
| S12-e-1.2m | 3.13 | 0.78 | 1.3 | 3.06 | 8.24 | 3.13 | 5.06 | 9.19 | |
| S10 | 3.13 | - | 3.13 | 4.89 | 8.24 | - | 8.24 | 12.07 | |
| S10-e-1m | 3.13 | 0.783 | 1.32 | 2.72 | 8.24 | 3.13 | 4.99 | 10.11 | |
| S7 | 3.13 | - | 3.13 | 6.83 | 8.24 | - | 8.24 | 15.19 | |
| S7-e-0.7m | 3.13 | 0.783 | 1.32 | 3.07 | 8.24 | 3.13 | 5.58 | 9.97 | |
| S5 | 3.13 | - | 3.13 | 8.51 | 8.24 | - | 8.24 | 16.75 | |
| S5-e-0.5m | 3.13 | 0.783 | 1.32 | 3.4 | 8.24 | 3.13 | 5.77 | 8.15 | |
| C0.5X1m | S15 | 3.13 | - | 3.13 | 5.37 | 8.24 | - | 8.24 | 13.68 |
| S15-e-1.5m | 3.13 | 0.783 | 1.30 | 3.14 | 8.24 | 3.13 | 4.96 | 9.41 | |
| S12 | 3.13 | - | 3.13 | 5.35 | 8.24 | - | 8.24 | 14.80 | |
| S12-e-1.2m | 3.13 | 0.78 | 1.30 | 2.74 | 8.24 | 3.13 | 4.87 | 10.56 | |
| S10 | 3.13 | - | 3.13 | 7.51 | 8.24 | - | 8.24 | 16.91 | |
| S10-e-1m | 3.13 | 0.783 | 1.30 | 2.98 | 8.24 | 3.13 | 5.18 | 10.97 | |
| S7 | 3.13 | - | 3.13 | 10.0 | 8.24 | - | 8.24 | 20.0 | |
| S7-e-0.7m | 3.13 | 0.783 | 1.30 | 2.60 | 8.24 | 3.13 | 5.67 | 9.44 | |
| S5 | 3.13 | - | 3.13 | 12.59 | 8.24 | - | 8.24 | 24.46 | |
| S5-e-0.5m | 3.13 | 0.783 | 1.29 | 2.84 | 8.24 | 3.13 | 5.57 | 6.82 | |
3.1. Effect of Varying Structure’s Number of Storeys with Column Size
Seismic codes divide buildings into three categories: low (N < 5), medium (5 ≤ N ≤ 15) and high-rise (N > 15) depending on the number of storeys (N). Given the range of number of storeys within medium-rise category (5 ≤ N ≤ 15), the effect of N was investigated for N of 5, 7, 10, 12 and 15 for two column sizes: 0.5 X 0.5 m and 0.5 X 1m, as detailed in Table 2.
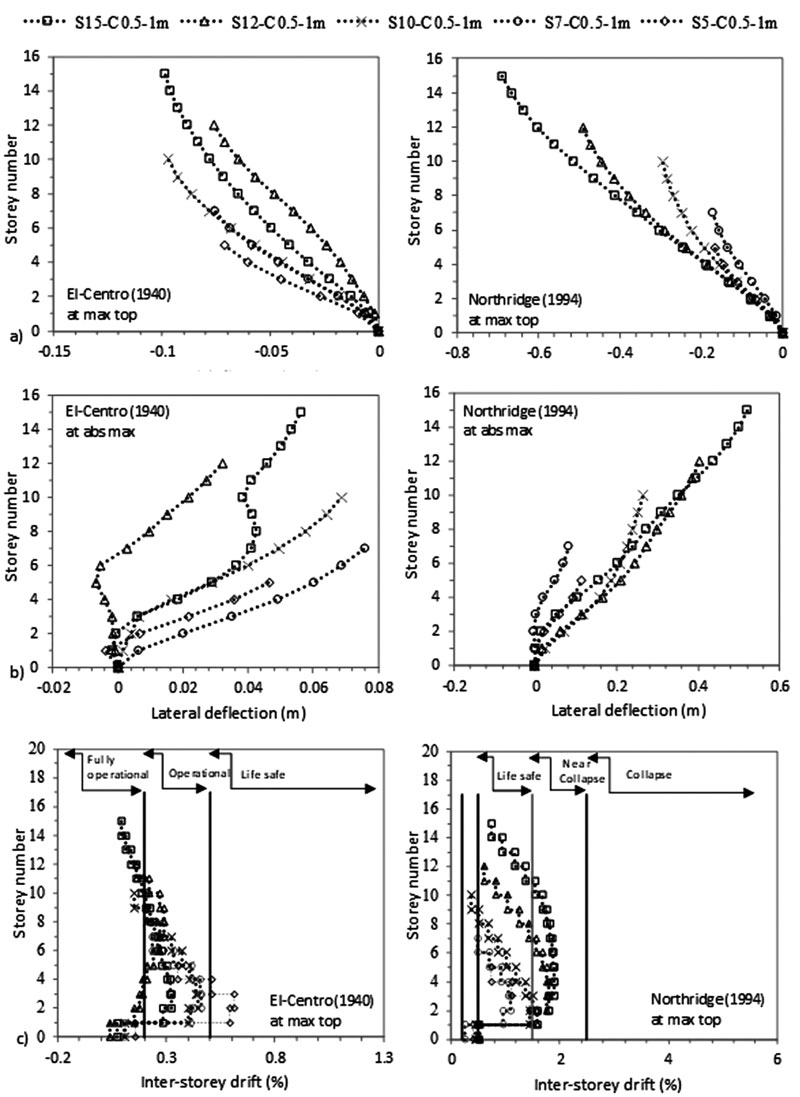
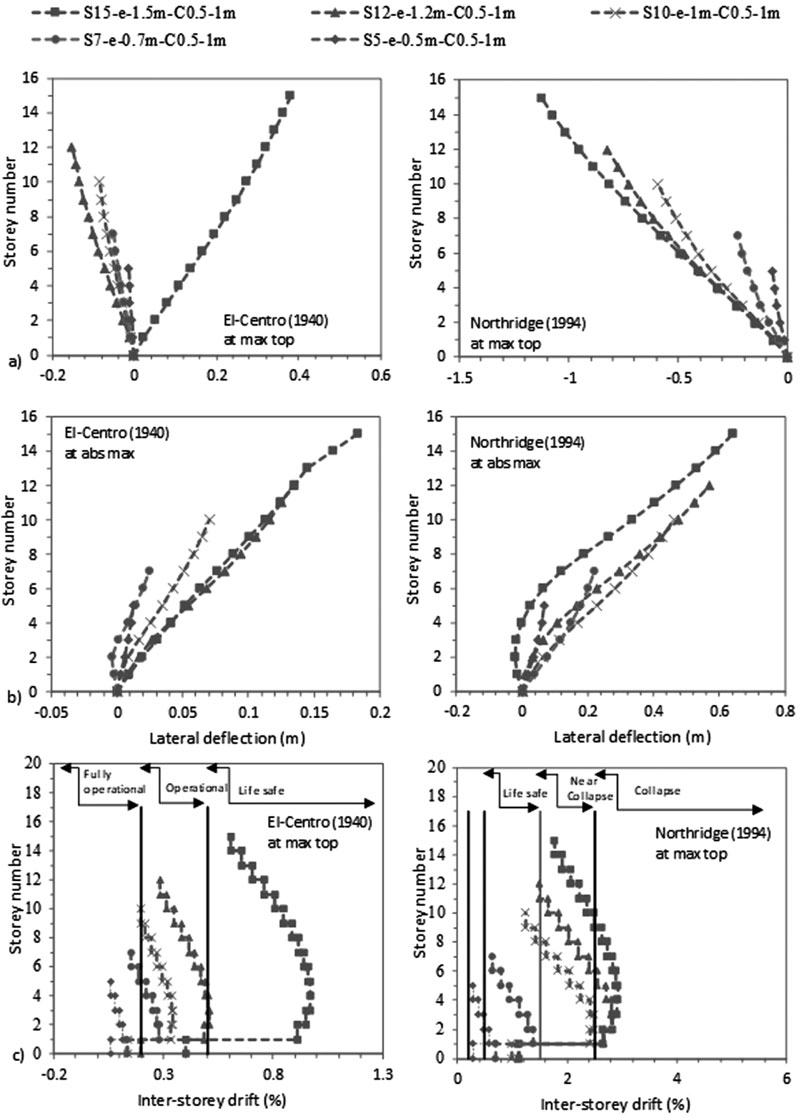
The FE results, plotted on Figs. (4-7), indicate that the increase in the number of storeys N causes an increase in lateral deflection and an increase in the difference in lateral displacement between flexible and fixed-based structures. For example, at abs max at the 5th level, the lateral deflection of S5 to S15 flexible cases is amplified from 0.0257 m to 0.0679 m for C 0.5 X 0.5 m and from 0.0126 m to 0.0518 m for C 0.5 X 1m under El-Centro (1940). Note that even though a shear wall-based structure design should be used for structures having more than 10 storeys as well as for structures under Northridge (1994) earthquake, we modelled these cases on moment frame structures to compare with the behaviour of the frame structures under El-Centro (1940) excitation.
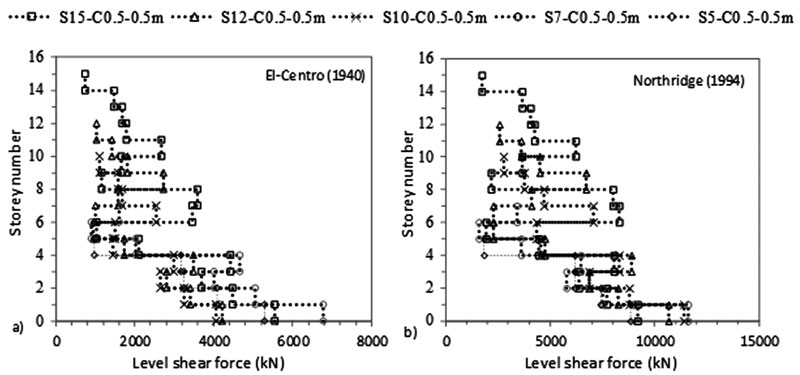
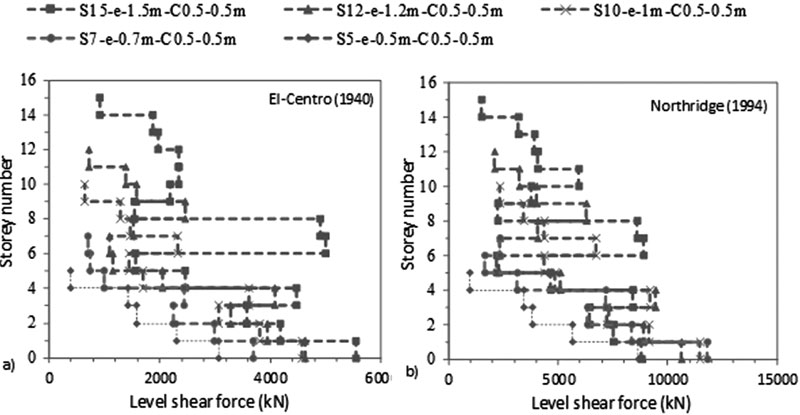
As shown in Figs. (4-11), an increase in N results in an increase in lateral deflection and levelling shear force results under both C sizes. For C 0.5 X 0.5 m, midrise structures having 5 ≤ N ≤ 15 are divided into two categories: (1) 5 ≤ N < 10 and (2) 10 ≤ N ≤ 15. This categorization is modified for C 0.5 X 1 m to become 5 ≤ N ≤ 10 and 10 < N ≤ 15 under El-Centro (1940) and 5 ≤ N < 7 and 7≤ N ≤ 15 under Northridge (1994). As detailed in Table 3, the ratio of flexible to fixed-based structures lateral deflection is lower than one for the first category and greater than one for the second category. Therefore, SSI is beneficial to the first category and detrimental to the second. In the second category, the seismic behaviour of frame structures founded on silty sandy soil is similar to the behaviour of structures rested on soft soils [3, 14, 35]. In the literature, Farghali et al. [14], Shehata et al. [3] and Nadar et al. [35] obtained an increase in storey displacement and drift with SSI cases. In addition, they showed that the storey number amplifies SSI effects. This amplification was described by higher storey displacement responses, mostly affected at the lower and the upper storeys. In this study, this behaviour can be clearly detected under Northridge (1994) excitation at abs max where the lateral displacement of the different structures increases with N until the 5th and the 6th level. The lateral displacement then changes direction and re-increases with the increase in N to hit the maximum displacement at the upper storey level (Figs. 4b-7b).
In this study, results show that within the second structures’ category, as N increases, the ratio of flexible to fixed based structures’ base shear decreases. In general, the structure's base shear tends to increase or decrease depending on the stiffness of the structure and the properties of the soil. Therefore, when the lateral deflection decreased, we observed an increase in base shear values for fixed based-structures and a decrease in base shear values for flexible structures when C increased from 0.5 X 0.5 m to 0.5 X 1 m (Table 3). In Figs. (8-11), the results show that for the same level, the increase in N amplifies the ratio of flexible to fixed cases shear forces. For example, for C 0.5 X 0.5 m, at the 5th level, the level shear force ratio increases from 0.40 to 0.98 to 1.52 under El-Centro (1940) and from 0.51 to 1.01 to 1.14 under Northridge (1994) for S5 to S10 to S15 respectively. In Figs. (4c-7c), the results show the important effects of N and C on the performance of midrise structures. In fact, the increase in storey number and decrease in column size lead to shifts in inter-storey drift curves to life-threatening and hazardous categories. In addition, lateral deflections and therefore inter-storey drift results are more affected by the higher PGA Northridge (1994) earthquake than the lower PGA El-Centro (1940) earthquake even though both seismic loads have similar magnitudes. For example, based on the performance limit categories set by the Australian Earthquake code [54], S10, S12 and S15 structures shift from “life safe” category under El-Centro (1940) earthquake to “near collapse” and “collapse” categories under Northridge (1994) earthquake. Note that this code considers “life safe” as the acceptable limit category.
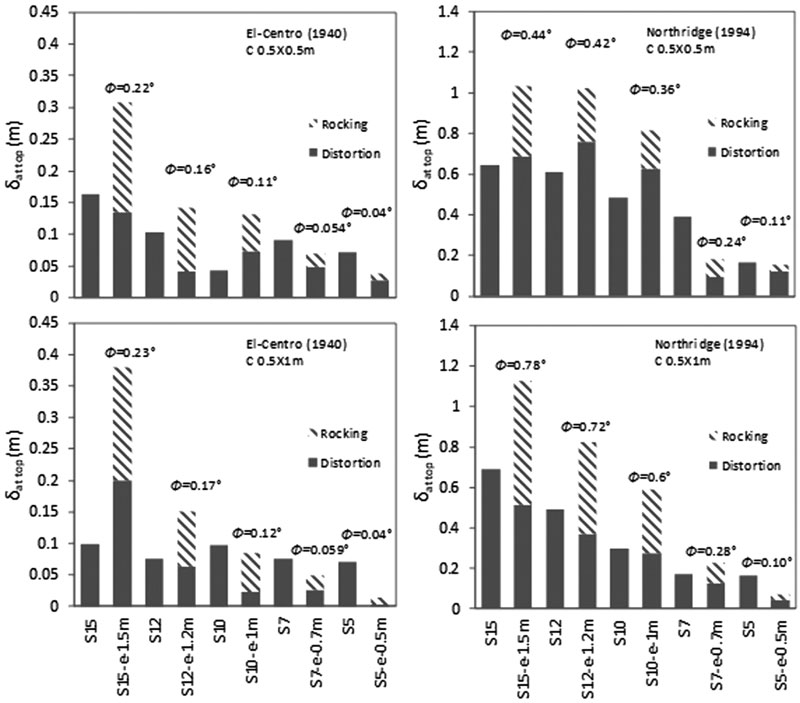
In this paper, the amount of distortion and rocking components were calculated based on Trifunace et al. [58, 59] relationships. These components are a function of the maximum foundation rocking angle and lateral deflections at the top of flexible and fixed-based structures. The results indicate that as N and C increase, foundation rocking angle increases (Fig. 12). This increase is more ostensible under Northridge (1994) than under El-Centro (1940) and more under C 0.5 X 1 m than under C 0.5 X 0.5 m. In addition, results show that these effects are more pronounced for second structures’ category. This is in line with Torabi and Rayhani [37] who found that rigid slender structures are highly affected by SSI effects displayed in their foundation rocking angle. For illustration, foundation rocking angle increases from 0.11 ° to 0.44 ° for C 0.5 X 0.5 m and from 0.10 ° to 0.78 ° for C 0.5 X 1 m for S5 to S15 flexible structures under the influence of Northridge (1994) earthquake. The increase in foundation rocking angle is reflected by an increase in the amount of rocking component. While the amount of distortion component depends on lateral deflection values at top of flexible and fixed-based structures. For example, under Northridge (1994) earthquake for C 0.5 X 1 m., foundation rocking angle increases from 0.10 ° to 0.78 ° for S5 to S15. Therefore, the lateral deflection at the top of S5 structure for C 0.5 X 1 m equal to 0.0699 m is divided into 0.029 m rocking component and 0.045 m distortion component, while S5 fixed-base structure lateral deflection is equal to 0.167 m and is due entirely to distortion component.
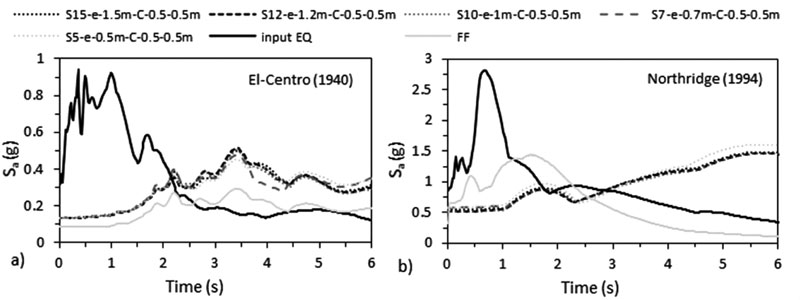
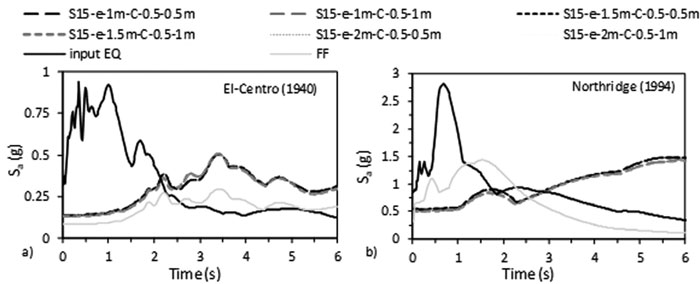
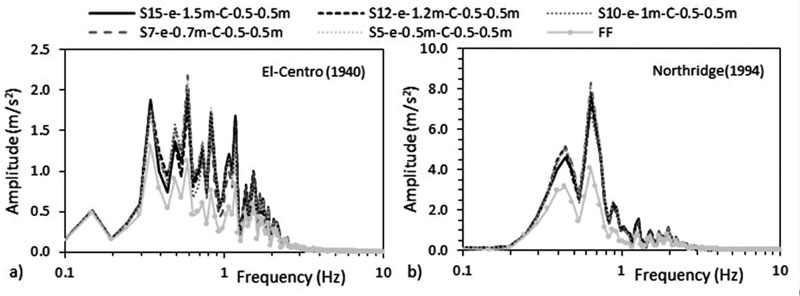
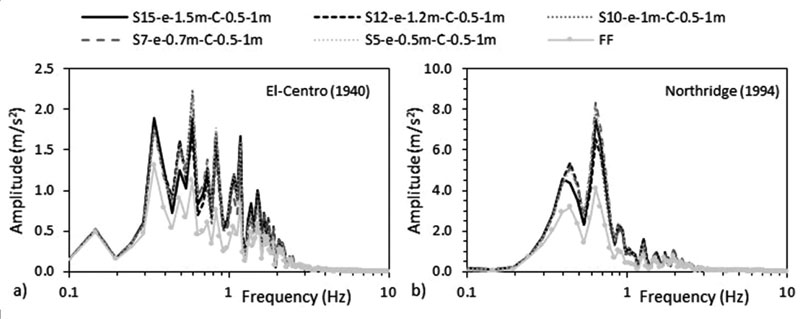
Response spectrum curves, plotted on Figs. (13 & 14), are usually used in seismic codes designs to calculate base shear values as a function of the structure-foundation-soil frequency. In this study, the results show that response spectra amplitude Sa is higher for waves beneath structures compared to FF waves even though these waves are not affected by the variation of N by more than 10% under C. Note that when C increases, the acceleration at the base of the structure-foundation slightly increases. This is directly related to the natural frequencies of the structures and soil. Note that the obtained natural frequencies/ fundamental periods from ABAQUS differ from the periods calculated using different codes (Table 4). Seismic codes underestimate the building fundamental period that is a function of the height of the building and not the characteristics or geometries of the beams, columns, etc. that form the structure. For example, EC-8 [56] and ASCE-7 [55] estimate the fundamental period of S10 and S10-e-1m structures as 0.961 s and 0.995 s respectively, while the fundamental period obtained from ABAQUS for S10 case is equal to 1.47 s for C 0.5 X 0.5 m and 1.282 s for C 0.5 X 1 m and for S10-e-1m case, it is equal to 2.041 s for C 0.5 X 0.5 m and 2.023 s for C 0.5 X 1 m (Table 4). This is similar to the results obtained by Shehata et al. [3] who proved that codes are conservative and underestimate the structural period that is a function of SSI. In addition, as shown in Table 4, the results are in accordance with Farghali et al. [14], Shehata et al. [3] and Nadar et al. [35] who obtained an increase in the structural time period with SSI cases.
SSI effects are divided into inertial and kinematic interactions. Inertial interactions are related to the structure and foundation parameters; i.e. linked to the increase in the mass of the structure-foundation system. On the other hand, kinematic effects are related to the structure’s base motions that depend on the soil properties and the earthquake characteristics (magnitude and PGA). The significant contribution of the number of storeys may be due to the extra mass produced by an increase of N that causes an increase in inertial effects. This mass alters the dynamic characteristics of the structure-foundation-soil system and affects the energy absorbed by the structure [36]. The increase in C is expected to decrease the structure’s lateral deflection. Nevertheless, even though fixed-based structures’ lateral deflection decreases with the increase in C, flexible structures’ lateral deflection only decreases in S5, S7 and S10 under El-Centro (1940) while only decreasing in S5 under Northridge (1994). In addition, a decrease in the ratio of flexible to fixed-based structures base shear is obtained in all simulated cases when C increases.
In this study, we observed that as N and C increase, inertial effect in the form of absorbed energy by the structure increases and causes excessive lateral deflection. This absorbed energy depends not only on N and C but also on the earthquake’s characteristics. The lateral defection results are in accordance with wave acceleration results summarized in Table 5 . As N and C increase, the mass of the structure increases. Therefore, bigger column sizes C 0.5 X 1 m cases exhibit higher accelerations at top of the fixed structures than C 0.5 X 0.5 m, reflecting the energy absorbed by the structure. For example, for the S15-C0.5X0.5m case under Northridge (1994), the maximum acceleration increases from 5.31 m/s 2 at the base to 6.92 m/s 2 at the top in the flexible case while increasing to 8.69 m/s 2 at the top of the fixed case. In addition, results indicate that the maximum wave acceleration value decreases from fixed to flexible cases under all scenarios, reflecting SSI effects.
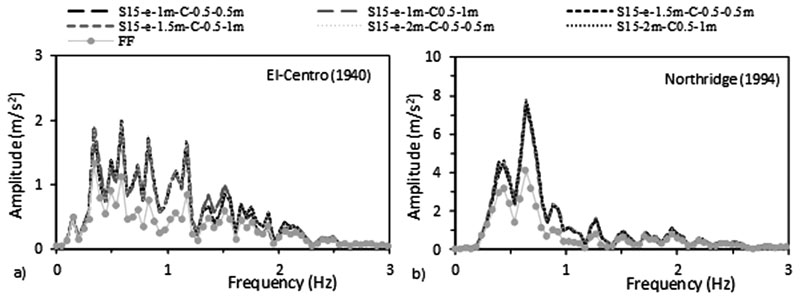
To evaluate the influence of kinematic effects on the foundation input/wave acceleration, the accelerations beneath the structure-foundation system are compared to the FF response. In Figs. (15 & 16), we notice that accelerations beneath structure-foundation systems are always higher than accelerations of FF under both seismic events, showing the effect of SSI. In general, the motion at the base of the structure-foundation system is divided between translation and rotation. The translational component is related to the base slab averaging while the rotational component is related to the rocking of the foundation. Kramer [1] argued that the variation between the base motion and FF is linked to the inability of the foundation to match FF deformation, i.e. kinematic interaction. Then, depending on SSI, the motion at the base of the structure-foundation system can be greater or weaker than FF motion. Similar to the results of Rayhani and El Naggar [45], the effect of kinematic interaction was manifested in this study by the amplification of the wave below the structure compared to FF motion (Table 5). On the other hand, the effect of soil type used (silty sand) was detected by the attenuation of the wave when it reached FF under both earthquakes. Therefore, the results found in this paper are not aligned with Farghaly and Ahmed [14], Hokmabadi et al. [28], Tabatabaiefar et al. [41] and Fatahi and Tabatabaiefar [46] who used clayey soil and obtained an amplification of the wave at FF under different seismic loads.
Building codes consider, through simplified methods, that the base excitation is the same as FF motion. Kim and Stewart [60] provided an analytical solution that calculates the ratio of the response spectral ordinate imposed on the foundation to the free-field (FF) spectral ordinate “RRS” for surface shallow foundation. This relationship was later reflected in FEMA-440 [61] and ASCE 41-06 [62] as follows:
 |
(3) |
where: be refers to the effective foundation size (ft) and Teq refers to the effective period of the foundation-structure system considering any lengthening due to foundation flexibility or structural yielding.
To evaluate the effectiveness of this relationship on FE results, the RRS of the different simulated models were calculated. As illustrated in Table 6 , the use of the relationship in Eq. (3) on surface shallow foundation structures underestimates the RRS ratio, especially for low frequency structures (S5 and S7). In fact, RRS varies between 1.4 and 1.72 for El-Centro (1940) simulations and between 1.6 and 2.05 for Northridge (1994) simulations while RRS calculated using Eq. (3) is around 1. Therefore, the high RRS value indicates the important contribution of the kinematic effect. Results show that even though the peak frequencies of the simulated models are almost the same for each earthquake, the first and second mode natural frequencies of flexible S10 and S12 cases are very close to the peak response frequencies obtained from Fourier Analysis. This causes kinematic effects to be the least significant in S10 and S12 models having the lowest RRS values. For illustration, for C 0.5 X 0.5 m under Northridge (1994), RRS is equal to 1.91, 1.81, 1.66, 2.03 and 2.01 for S15-e-1.5m, S12-e-1.2m, S10-e-1m, S7-e-0.7m and S5-e-0.5m respectively. As N increases and C decreases, the structure’s fundamental period increases [63]. This is in line with Luco and Wong [64] and Velestos et al. [65] who found that SSI effects are more significant for high frequencies (short period) than low frequencies (long period) of excitation structures. In addition, results are in line with Aviles and Perez-Rocha [66] who proved that SSI effects are larger for tall and slender structures than for short and squat structures of the same period. As C increases to 0.5 X 1m, RRS decreases to 1.83, 1.6, 1.94, 2.05 and 2.0 for S15-e-1.5m, S12-e-1.2m, S10-e-1m, S7-e-0.7m and S5-e-0.5m respectively. Therefore, the deviation in the natural frequencies of the structure and soil leads to the deviation in SSI effects between the different models. As a result, as N and C increase, inertial effect dominates the kinematic effect and causes the categorization within medium rise building category.
| El-Centro (1940) | Northridge (1994) | Ratio (Fourier Amplitude/FF) (after Kim and Stewart (2003) | |||||||||
| Reference name | Amplitude (m/s2) | Ratio (Fourier Amplitude/FF) calculated from FE | Amplitude (m/s2) | Ratio (Fourier Amplitude/FF) calculated from FE | |||||||
| FF | 1.31 | - | 4.08 | - | - | ||||||
| C 0.5 X 0.5 m | S15-e-1.5m | 2 | 1.53 | 7.8 | 1.91 | 0.998 | |||||
| S12-e-1.2m | 1.83 | 1.40 | 7.4 | 1.81 | 0.998 | ||||||
| S10-e-1m | 1.88 | 1.44 | 6.77 | 1.66 | 0.998 | ||||||
| S7-e-0.7m | 2.18 | 1.66 | 8.29 | 2.03 | 0.998 | ||||||
| S5-e-0.5m | 2.13 | 1.63 | 8.19 | 2.01 | 0.998 | ||||||
| S15-1.3B | 2 | 1.53 | 7.8 | 1.91 | 0.998 | ||||||
| S15-1.5B | 2 | 1.53 | 7.78 | 1.91 | 0.998 | ||||||
| S15-2B | 2.03 | 1.55 | 7.9 | 1.94 | 0.997 | ||||||
| S15-e-2m | 2.02 | 1.54 | 7.88 | 1.93 | 0.998 | ||||||
| S15-e-1.5m | 2 | 1.53 | 7.8 | 1.91 | 0.998 | ||||||
| S15-e-1m | 1.98 | 1.51 | 7.74 | 1.90 | 0.998 | ||||||
| C 0.5 X 1m | S15-e-1.5m | 1.9 | 1.45 | 7.47 | 1.83 | 0.998 | |||||
| S12-e-1.2m | 1.83 | 1.40 | 6.52 | 1.60 | 0.998 | ||||||
| S10-e-1m | 2.25 | 1.72 | 7.93 | 1.94 | 0.998 | ||||||
| S7-e-0.7m | 2.18 | 1.66 | 8.37 | 2.05 | 0.998 | ||||||
| S5-e-0.5m | 2.13 | 1.63 | 8.17 | 2.00 | 0.998 | ||||||
| S15-1.3B | 1.9 | 1.45 | 7.47 | 1.83 | 0.998 | ||||||
| S15-1.5B | 2 | 1.53 | 8.01 | 1.96 | 0.998 | ||||||
| S15-2B | 1.85 | 1.41 | 7.5 | 1.84 | 0.997 | ||||||
| S15-e-2m | 1.91 | 1.46 | 7.53 | 1.85 | 0.998 | ||||||
| S15-e-1.5m | 1.9 | 1.45 | 7.47 | 1.83 | 0.998 | ||||||
| S15-e-1m | 1.89 | 1.44 | 7.42 | 1.82 | 0.998 | ||||||
| - | Reference Name | El-Centro (1940) | Northridge (1994) | ||||||
|
Max δ (m) |
δflexible/ δfixed |
V (kN) |
Vflexible/ Vfixed |
Max δ (m) |
δflexible/ δfixed |
V (kN) |
Vflexible/ Vfixed |
||
| C0.5X0.5m | S15 | 0.162 | - | 5557.20 | - | 0.644 | - | 9173.95 | - |
| S15-1.3B | 0.308 | 1.90 | 5550.69 | 1.00 | 1.034 | 1.61 | 8788.61 | 0.96 | |
| S15-1.5B | 0.424 | 2.61 | 6267.88 | 1.13 | 1.151 | 1.79 | 9169.22 | 1.00 | |
| S15-2B | 0.431 | 2.66 | 6679.10 | 1.20 | 1.160 | 1.80 | 9318.50 | 1.02 | |
| C0.5X1m | S15 | 0.099 | - | 6619.64 | - | 0.688 | - | 20425.9 | - |
| S15-1.3B | 0.380 | 3.85 | 6281.49 | 0.95 | 1.125 | 1.64 | 16529.5 | 0.81 | |
| S15-1.5B | 0.332 | 3.36 | 6708.11 | 1.01 | 1.116 | 1.62 | 19312.5 | 0.95 | |
| S15-2B | 0.215 | 2.18 | 6742.03 | 1.01 | 1.084 | 1.58 | 21304.7 | 1.04 | |
| - | Reference Name | El-Centro (1940) | Northridge (1994) | ||||||
|
Max δ (m) |
δflexible/ δfixed |
V (kN) |
Vflexible/ Vfixed |
Max δ (m) |
δflexible/ δfixed |
V (kN) |
Vflexible/ Vfixed |
||
| C0.5X0.5m | S15 | 0.162 | - | 5557.20 | - | 0.644 | - | 9173.95 | - |
| S15-e-2m | 0.321 | 1.98 | 5674.16 | 1.02 | 1.055 | 1.64 | 8837.06 | 0.96 | |
| S15-e-1.5m | 0.308 | 1.90 | 5550.69 | 1.00 | 1.034 | 1.61 | 8786.61 | 0.96 | |
| S15-e-1m | 0.309 | 1.90 | 5450.31 | 0.98 | 1.026 | 1.59 | 8747.63 | 0.95 | |
| C0.5X1m | S15 | 0.099 | - | 6619.64 | - | 0.688 | - | 20425.9 | - |
| S15-e-2m | 0.379 | 3.84 | 6328.87 | 0.96 | 1.124 | 1.63 | 16841.5 | 0.82 | |
| S15-e-1.5m | 0.380 | 3.85 | 6281.49 | 0.95 | 1.125 | 1.64 | 16529.5 | 0.81 | |
| S15-e-1m | 0.380 | 3.85 | 6182.16 | 0.93 | 1.126 | 1.64 | 16192.8 | 0.79 | |
| Ax (m/s2) | El-Centro (1940) | Northridge (1994) | |||||||
| Reference Name | Input EQ | FF | Base | Top | Input EQ | FF | Base | Top | |
| C 0.5X0.5m | S15 | 3.13 | - | 3.13 | 3.46 | 8.24 | - | 8.24 | 8.69 |
| S15-1.3B | 3.13 | 0.78 | 1.33 | 4.08 | 8.24 | 3.13 | 5.31 | 6.92 | |
| S15-1.5B | 3.13 | 0.78 | 1.35 | 3.9 | 8.24 | 3.13 | 5.32 | 7.13 | |
| S15-2B | 3.13 | 0.78 | 1.36 | 3.65 | 8.24 | 3.13 | 5.38 | 7.23 | |
| C 0.5X1m | S15 | 3.13 | - | 3.13 | 5.37 | 8.24 | - | 8.24 | 13.68 |
| S15-1.3B | 3.13 | 0.78 | 1.28 | 3.14 | 8.24 | 3.13 | 4.96 | 9.41 | |
| S15-1.5B | 3.13 | 0.78 | 1.29 | 3 | 8.24 | 3.13 | 5.09 | 10.65 | |
| S15-2B | 3.13 | 0.78 | 1.31 | 3.01 | 8.24 | 3.13 | 5.1 | 11.15 | |
3.2. Effect of varying raft foundation dimension with column size
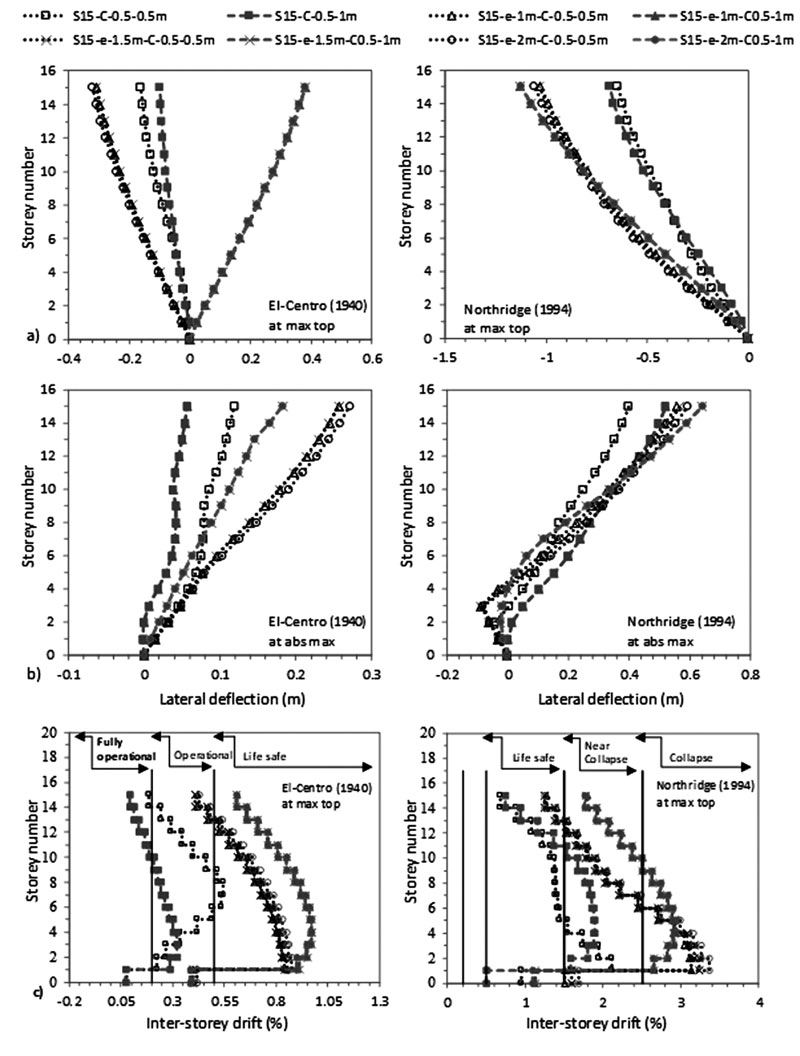
In order to address and quantify the effects of varying the geometry of the raft foundation, a baseline case of 15 storey midrise concrete frame structure was considered. For a 1.5 m raft thickness, the raft size was varied between 1.3, 1.5 and 2B (S15-xB) with xB referring to the width of the structure corresponding to 20 m (1.3B), 22.5 m (1.5B) and 30 m (2B) (B=15 m). Afterwards, for a 20 m width raft size, raft thicknesses were varied between 1, 1.5 and 2 m (S15-e-y) with e-y referring to the thickness. Note that the effects of raft size and thickness were tested for 0.5 X 0.5 m and 0.5 X 1 m column sizes (Table 2).
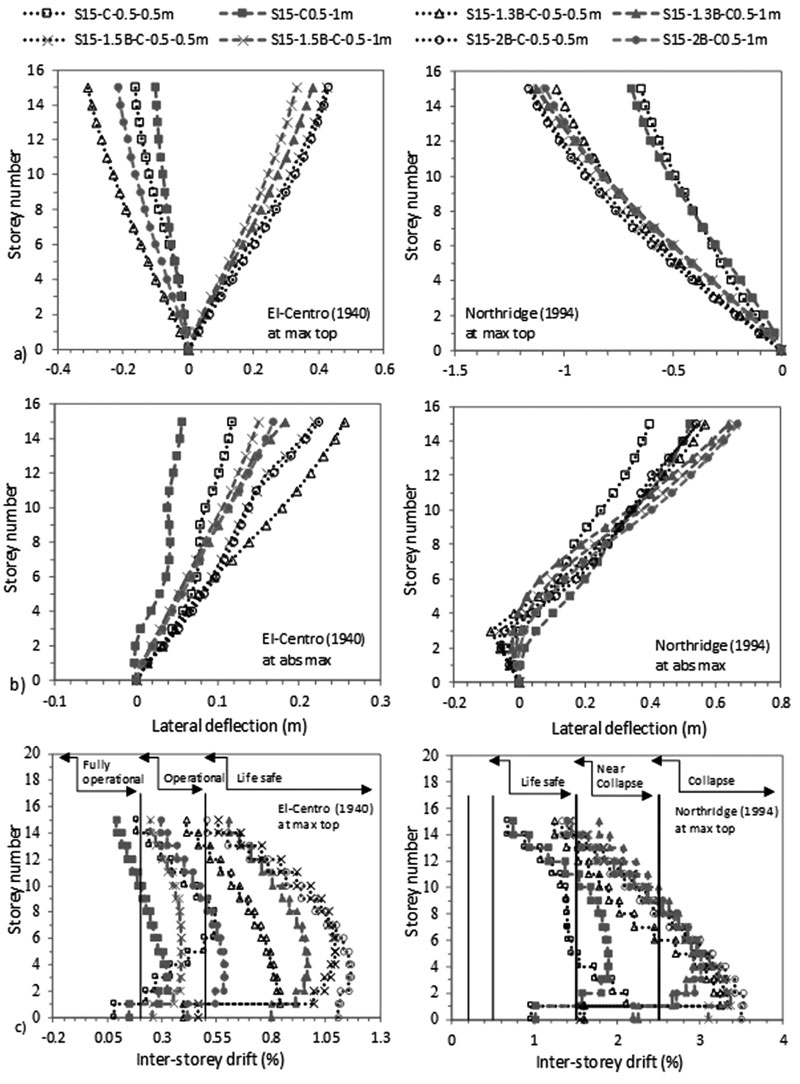
Increasing the dimension of the raft foundation alters the dynamic characteristics of the structure-raft-soil system. In fact, the structure-raft-soil system absorbs more energy from the seismic load when the contact between the raft foundation and surrounding soil increases. This energy is then transferred to the structure and affects the seismic structural response. The FE results show that for the effect of raft dimension, column size strongly affects the behaviour of S15 flexible structures. This trend is more ostensive under raft size than under raft thickness.
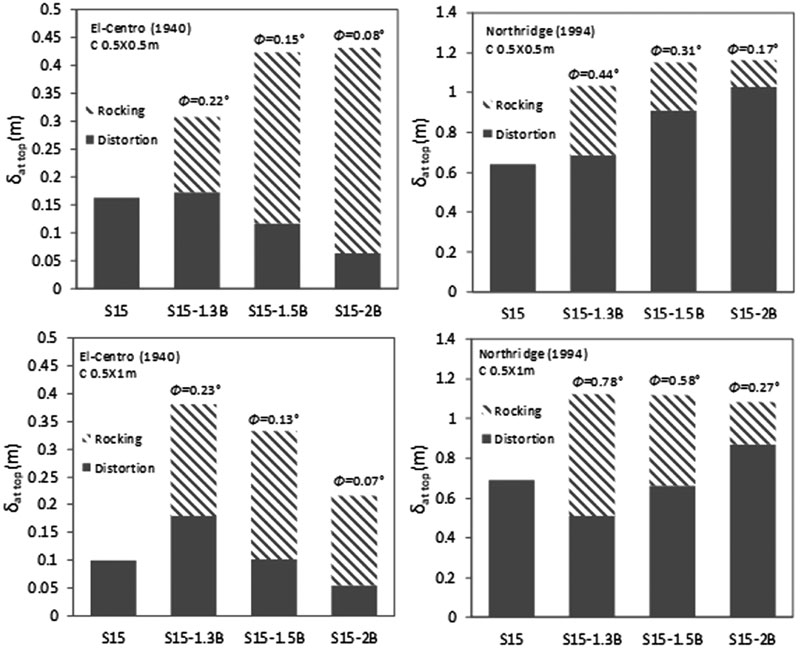
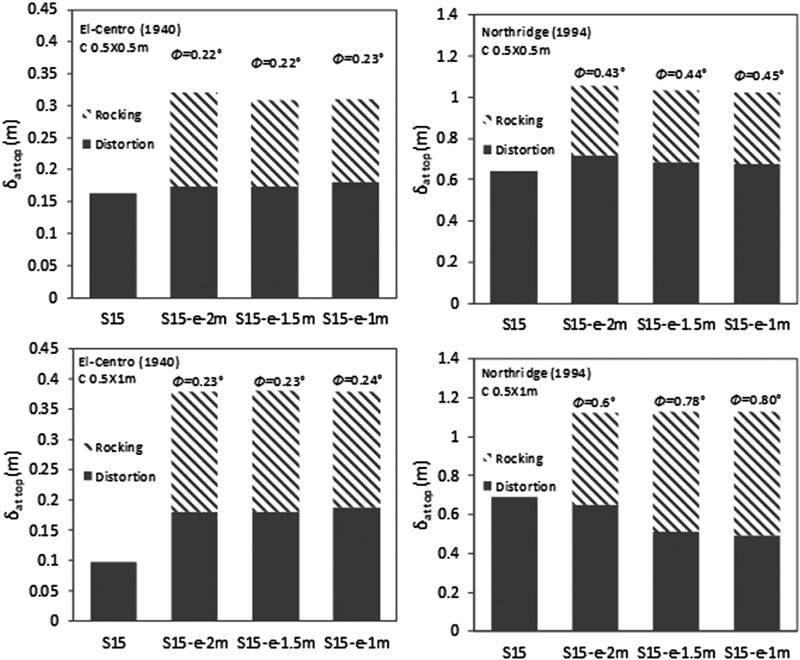
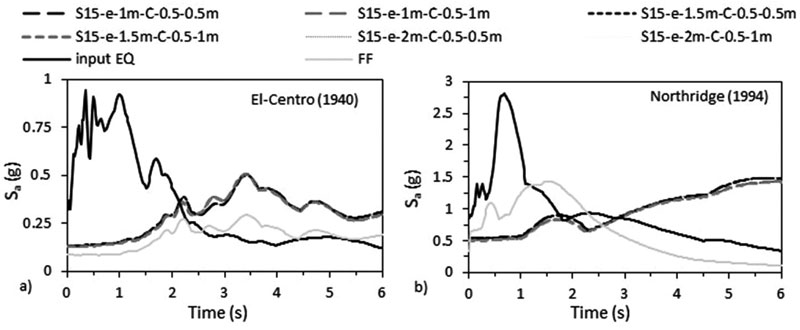
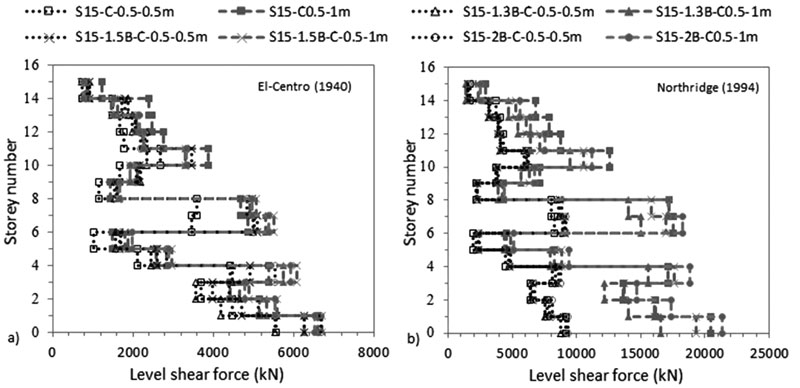
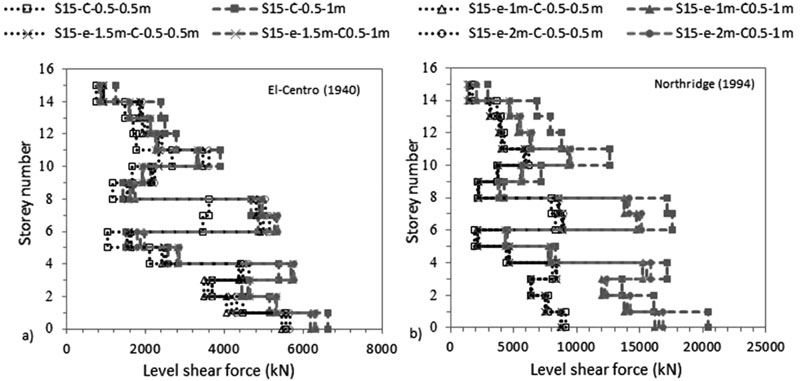
The results, in Figs. (17 & 18) and in Tables 7 and 8, show that increasing the size of the raft amplifies the ratio of lateral deflection of flexible to fixed base δflexible /δfixed S15 structures for C 0.5 X 0.5 m and attenuates this ratio for C 0.5 X 1 m. Furthermore, the results indicate that for the same 1.3B raft size (including different raft thicknesses), δflexible (C 0.5 X 0.5 m) is lower than δflexible (C 0.5 X 1 m) while for 1.5B and 2B raft sizes, δflexible (C 0.5 X 0.5 m) is greater than δflexible (C 0.5 X 1 m). The decrease in lateral deflections is reflected in inter-storey drifts results where structures move to lower and safer categories (Fig. 17c). The results show that increasing the raft thickness from 1 to 2 m only increases δflexible /δfixed from 1.9 to 1.98 and from 1.59 to 1.64 for C 0.5 X 0.5 m under El-Centro (1940) and Northridge (1994) respectively. Nevertheless, δflexible /δfixed is slightly affected by the change in raft thickness for C 0.5 X 1 m under both earthquakes. As a result, raft thicknesses within the same column size slightly affects lateral deflection and inter-storey drift results (Fig. 18).
Results indicate that accelerations of the seismic waves at the base and top of the flexible structures decrease with the increase in column size under both seismic loads (Tables 9 and 10). In addition, for fixed structures, as the column size increases, the accelerations of the seismic waves increase while lateral deflections at top of these structures decrease. Therefore, we note that increasing the column size in the direction of the earthquake load is beneficial to structures. The contribution associated with column size is more apparent under El-Centro (1940) than under Northridge (1994). In addition, it is more ostensive for 1.5B and 2B raft sizes cases than for 1.3B raft size case. The extra mass coming from both columns and raft sizes as well as the extra contact coming from the size of the raft foundation leads to an important inertial effect rise ending in a reduction in the structures’ lateral deflections. This is in line with Nguyen et al. [33] who obtained a reduction in lateral deflection curves for flexible structures rested on clayey soil when they increased the raft sizes from 1.1B to 2B for 4 different earthquake loads.
The numerical results show that as the column size increases and the raft size and thickness decrease, foundation rocking angle increases (Figs. 19-20). In addition, under El-Centro (1940) for both column sizes, the increase in raft dimension leads to a decrease in the amount of distortion component and an increase in the amount of rocking component. However, the opposite behaviour is obtained under Northridge (1994) earthquake. It is worth noting that minimal changes in the amount of distortions and rocking components are obtained for the effect of raft thickness caused by the small changes obtained in foundation rocking angles. For illustration, under Northridge (1994) earthquake for 1.3B case, foundation rocking angle increases from 0.44 ° to 0.78 ° when increasing column size from C 0.5 X 0.5 m to C 0.5 X 1 m. Therefore, the lateral deflection at the top of the structure for C 0.5 X 0.5 m equal to 1.034 m is divided into 0.346 m rocking component and 0.688 m distortion component. On the other hand, the lateral deflection at the top of the structure for C 0.5 X 1 m increases to 1.055 m and is divided into 0.338 m rocking component and 0.718 m distortion component. In addition, for 1.3B cases, increasing the raft thickness from 1 m to 2 m for C 0.5 X 1 m only attenuates the rocking angle from 0.24 ° to 0.23 ° under El-Centro (1940) earthquake while the rocking angle is attenuated from 0.8 ° to 0.6 ° under Northridge (1994) earthquake, thus reflecting the impact of the seismic excitation. Since foundation rocking angle is not related to the structure’s failure, an increase in its value can have a beneficial effect on flexible structures. For the effect of raft size for C 0.5 X 0.5 m and the effect of raft thickness, the increase in foundation rocking angle is accompanied by a reduction in levelling shear force and lateral deflection.
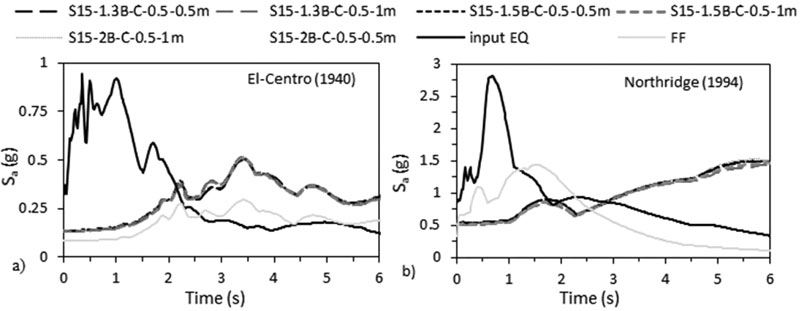
In this paper, the results show that, in line with Nguyen et al. [33], Sa is slightly affected by the increase in raft size (Figs. 21 & 22). In addition, Sa is slightly affected by the increase in column size. This is related to the natural frequencies of the tested models that did not quite differ between the different tested models. In fact, 2B to 1.3B C 0.5 X 0.5 m and C 0.5 X 1 m, Sa rises only 1.57% and 2.17% under El-Centro (1940) and 2.84% and 2.79% under Northridge (1994) respectively. Therefore, the slight increase in Sa leads to a small increase in the base shear results. The obtained results indicate that base shear ratio of flexible to fixed-based structures increases with the increase in raft dimensions under both column sizes (Figs. 23 & 24) and (Tables 7 and 8). It is worth noting that this increase is more apparent between 1.3B and 1.5B cases than between 1.5B and 2B cases. Therefore, bigger raft sizes result in safer design when SSI is considered. The bigger the contact between the raft and the soil and the larger the column size, the more SSI effect divided between inertial and kinematic is pronounced. For example, under the influence of El-Centro (1940), base shear ratio of 1.3B and 2B increases from 1.0 to 1.2 for C 0.5 X 0.5 m and from 0.95 to 1.01 for C 0.5 X 1 m (Table 7). While base shear ratio of 1 m and 2 m raft sizes also under El-Centro (1940) increases from 0.98 to 1.02 for C 0.5 X 0.5 m and from 0.93 to 0.96 for C 0.5 X 1 m (Table 8).
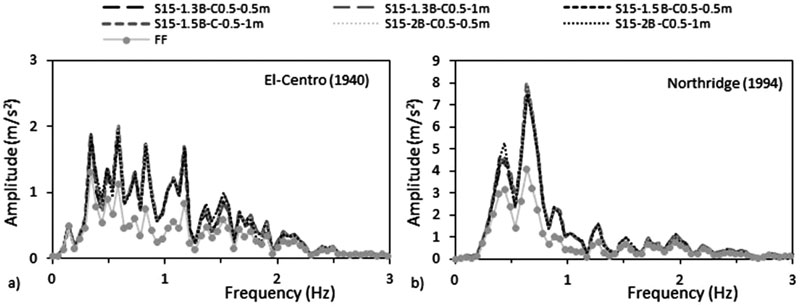
The accelerations response spectrum curves show that similar to the effect of structure’s number of storeys, the accelerations beneath structure-foundation systems are always higher than acceleration at FF under both seismic events, therefore showing the effect of SSI (Figs. 25 & 26). In addition, the fundamental periods obtained from ABAQUS are larger than the fundamental periods obtained from the different seismic codes (Table 4). Finally, the RRS obtained from FE is greater than the calculated RRS based on Eq. (3) (Table 6).
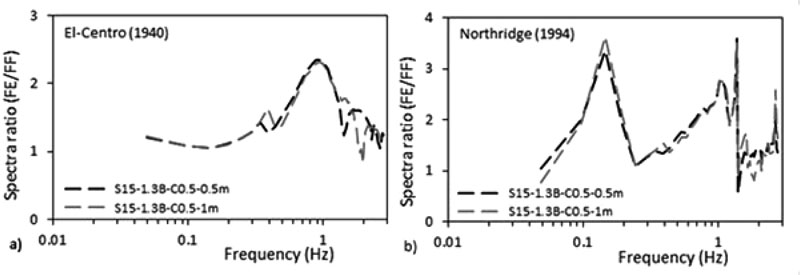
To assess which frequencies have detrimental effects on the tested S15 structure, the ratio of spectral acceleration at the base of the structure to the spectral acceleration at FF condition S a,FE / S a,FF was calculated. Results indicate that even though the peak frequencies of the different simulated models are very close to FF condition for both seismic loads, the response spectra ratio (Sa,FE/Sa,FF) is in the order of 2.29 over the frequency range 0.44-2.59 Hz under El-Centro (1940) and it is in the order of 3.5 over the frequency range 0.1-1.41 Hz under Northridge (1994). As shown in Fig. (27), SSI has detrimental effects on S15 flexible structures cases since the natural frequencies of the simulated models are within these frequencies’ ranges. Similar results were obtained by Rayhani and El-Naggar [45] who obtained that seismic SSI has unfavourable effects on horizontal ground motions for frequencies between 3 and 6 Hz.
As a result, based on overall structural stability and failure, engineers should optimize their design between column size and raft dimension. An increase in raft dimension for the adopted soil properties attracts more shear force and lateral deformation for C 0.5 X 0.5 m. For C 0.5 X 1 m, the raft dimension attracts more shear force and less lateral deformation. In addition, under both column sizes, foundation rocking angle decreases when the raft dimension increases.
| Ax (m/s2) | El-Centro (1940) | Northridge (1994) | |||||||
| Reference name | Input EQ | FF | Base | Top | Input EQ | FF | Base | Top | |
| C 0.5X0.5m | S15 | 3.13 | - | 3.13 | 3.46 | 8.24 | - | 8.24 | 8.69 |
| S15-e-1m | 3.13 | 0.783 | 1.33 | 4.04 | 8.24 | 3.13 | 5.33 | 6.79 | |
| S15-e-1.5m | 3.13 | 0.783 | 1.33 | 4.08 | 8.24 | 3.13 | 5.31 | 6.92 | |
| S15-e-2m | 3.13 | 0.783 | 1.33 | 4.17 | 8.24 | 3.13 | 5.31 | 7.03 | |
| C 0.5X1m | S15 | 3.13 | - | 3.13 | 5.37 | 8.24 | - | 8.24 | 13.68 |
| S15-e-1m | 3.13 | 0.783 | 1.29 | 3.12 | 8.24 | 3.13 | 4.97 | 9.27 | |
| S15-e-1.5m | 3.13 | 0.783 | 1.28 | 3.14 | 8.24 | 3.13 | 4.96 | 9.41 | |
| S15-e-2m | 3.13 | 0.783 | 1.28 | 3.15 | 8.24 | 3.13 | 4.95 | 9.48 | |
CONCLUSION
In this paper, the effects of different parameters on the seismic response of midrise concrete frame structures were examined by performing a three-dimensional finite element analysis using ABAQUS. The main contribution is in investigating the response of midrise concrete frame structures rested on silty sandy soil using realistic 3-dimensional infinite elements in both soil horizontal directions. Flexible and fixed-base structures, hit at the bottom by two strong ground motions, were simulated and tested for the effects of structure number of storeys as well as raft dimension: size and thickness for two different column sizes.
The results showed that square soil block models presented higher lateral deflection results than rectangular soil block models. Therefore, it is important to model enough soil limit in both horizontal directions in the direction perpendicular to the earthquake load. In addition, the results indicated that for the effect of the structure’s number of storeys, midrise structures can be divided into two categories based on SSI effects. In terms of lateral deflection and base shear, for C 0.5 X 0.5 m, SSI was beneficial to structures with 5 ≤ N < 10 and detrimental to structures with 10 ≤ N ≤ 15. Increasing the column size to C 0.5 X 1 m showed that the SSI became beneficial for structures with 5 ≤ N ≤ 10 under El-Centro (1940) and for structures with 5 ≤ N < 7 under Northridge (1994), and detrimental for structures with 10 < N ≤ 15 under El-Centro (1940) and for structures with 7≤ N ≤ 15 under Northridge (1994). This categorization was attributed to the contribution of inertial and kinematic effects. As N and C increased, inertial effects increased and dominated kinematic effects.
With respect to foundation rocking angle, our study showed that the foundation rocking angle increased while response spectra amplitude Sa slightly varied with the increase in the structure’s number of storeys and column size. As for the effect of raft dimension, the results showed that raft thicknesses within the same column size slightly affected the response of S15 structures. The ratio δflexible /δfixed for S15 structures increased for C 0.5 X 0.5 m and decreased for C 0.5 X 1 m with the increase in raft size. The base shear ratio Vflexible/Vfixed increased with the increase in raft dimensions under both column sizes. This increase was more apparent between 1.3B and 1.5B cases than between 1.5B and 2B cases. In addition, the foundation rocking angle increased while response spectra amplitude Sa slightly varied with the decrease in the size and thickness of the raft foundation as well as in the column size. It should be noted that an increase in foundation rocking angle can have a favourable effect on flexible structures and be accompanied by a reduction in structures’ lateral deflections and levelling shear forces.
In this study, results showed that seismic codes underestimate the structures’ fundamental periods. In addition, accelerations at FF cannot be used as accelerations at the base of the structure-foundation system. The RRS equation provided by Kim and Stewart [ 60 ] underestimates the amplification of the seismic wave, in particular for low-frequency structures, ending in misestimating the seismic behaviour of structures.
The results showed that the effect of inertial interaction, displayed by an increase in the form of absorbed energy by the structure, led to excessive lateral deflection. This energy depended on the structure’s number of storeys, column size, the contact between the raft foundation and soil medium as well as the earthquake’s characteristics. On the other hand, the effect of kinematic interaction was manifested by the amplification of the earthquake wave below the structure compared to FF motion. In addition, the effect of soil type used (silty sand) was detected by the attenuation of the wave when it reached FF under both earthquakes.
To conclude, the FE results showed that the behaviour of structures rested on silty sandy soil cannot be generalized as in the case with structures rested on clayey soil. Therefore, we recommend that engineers optimize their design between the different parameters that were tested to provide overall structure stability. In future work, we plan to investigate the inclusion of shear walls and basements while considering earthquake loads in 3 directions, in addition to evaluating the effects of soil denseness, layering and water table.
CONSENT FOR PUBLICATION
Not applicable.
AVAILABILITY OF DATA AND MATERIALS
Not applicable.
FUNDING
None.
CONFLICT OF INTEREST
The authors declare no conflict of interest, financial or otherwise.
ACKNOWLEDGEMENTS
Declared none


