All published articles of this journal are available on ScienceDirect.

Integrated Empirical-mechanical Seismic Vulnerability Analysis Method for Masonry Buildings in Timișoara: Validation based on the 2009 Italian Earthquake
Authors Info & Affiliations
Abstract
Background:
Timisoara is one of the most important Romanina cities, located in the Banat area and characterised by shallow earthquakes with high ground motion vertical component. The seismicity of the area, in accordance with the P-100 Romanian Code, is affected by medium-high hazard level with an expected maximum PGA of 0.20 g.
From a historical-artistic point of view, the city of Timisoara is full of monumental buildings of inestimable values and it was declared as the European Capital of Culture for 2021.
Aims:
The present work aims to investigate the seismic vulnerability of masonry buildings located in the districts of Fabric and Iosefin, which were grouped in typology classes based on the EMS-98 scale according to their geometrical and structural characteristics.
Methods:
The performed vulnerability analysis is based on a combined empirical-mechanical procedure to estimate the propensity at the damage of the buildings surveyed.
Results:
A specific formulation was proposed for typological vulnerability curves of building classes of the examined area, which were calibrated on the basis of the damages detected after occurred earthquakes.
Conclusion:
The proposed formulation was validated from the application to an urban sector of the municipality of San Pio delle Camere (Italy), which was damaged after the 2009 Abruzzo earthquake.
1. INTRODUCTION
The building heritage represents the historical value and authenticity of each community, the crossroads between old and new and, without any doubt, an outstanding testimony to be safeguarded. Timisoara is one of the biggest and most important city located in the Western part of Romania. It is a very ancient city, since the first origin dated back to the Neolithic. The first official recognition of the town went back to the 13th century when it was configurated as a rectangular fortress surrounded by water and was under the jurisdiction of the Hungarian administration. At the beginning of the 14th century, King Carol Robert de Anjou visited the city and ordered to build a royal palace there.
The establishment of the royal court in this place led to a conspicuous demographic increase in the area. Consequently, it became an important commercial and political centre, which remained under the Hungarian administration until the year 1552 [1]. Starting from the year 1552, the city was part of the Ottoman Empire, which led to the progressive development of the social and urban fabric. In fact, the city was characterised by the first urban development strategy: divided into the main districts and ten slums, in the suburbs. Several adobe and wooden buildings were erected in that period. Starting from 1716, and for the following three years, Timisoara passed under the Habsburg administration. It was the capital of the Banat region until 1781 when it became a free royal city. A new fortress in the Vauban architectural style was built. This compressed inside the historic town, called Cetate and maintained a strategic defence distance from the periphery, called Iosefin and Fabric [1].
Nowadays, Timisoara has a population higher than 300000 inhabitants and has an undisputed historical and artistic heritage mainly based on the secessionist architecture. This cultural and artistic aspect was intrinsically due to the influences of dominations that occurred over the centuries, which erected fascinating historical areas with buildings mainly made of masonry having Secession, Art Nouveau and Baroque architectural styles. Moreover, Timisoara was selected as the European capital of culture in 2021. So, the local authorities will organise events able to connect visitors with the resident community. Most of the events will be hosted in the city centre and some historical areas, such as Iosefin and Fabric. As a consequence, given the presence of significant building stock, there will be a need to assess for the first time the seismic vulnerability of these areas to appraise the response of buildings against an earthquake scenario. As several similar studies were conducted in Europe [2-4] and New Zealand [5], the vulnerability analysis method herein proposed is based on a combined empirical-mechanical procedure used to estimate the propensity at the damage of buildings according to the EMS-98 scale. In particular, this research work aims to propose a new empirical formula to define the typological vulnerability curves of some building classes, located in areas identified as case studies, which are calibrated on previous seismic damages detected there. Basically, the proposal for a new formulation is mainly based on two main aspects. First of all, from a typological and structural point of view, the buildings located in the study areas are formally different from those on which the formulation proposed by another study [6] is based. In fact, as reported in a study [6], the non linear damage law has been calibrated on a large dataset of Italian building typologies and historical earthquakes.
Secondly, based on the seismic hazard, the Banat Region is considered one of the most important medium-high seismic zones, characterized mainly by near-field earthquakes. As is known, near-field earthquakes are of the impulsive type, generally related to focal reverse fault mechanisms, all amplified by the presence of soft soils. These seismic events are characterized by strong vertical accelerations near the seismogenic source in which the ratio between the maximum vertical (V) and horizontal (H) accelerations is greater than unity. These effects are not negligible since their absence in vulnerability analyses would lead to a deficit in terms of seismic response capacity (stiffness, strength and ductility) of buildings sample. In fact, as properly analysed by a few studies [7-9] the near-field effects are not negligible as they cause strong increases of both, displacement and rotational effects, respectively, up to 25 km from the source.
It is clear that the calibration of an ad-hoc empirical formulation for existing masonry buildings in Timisoara is essential in order to effectively take into account all of these aspects and, therefore, correctly foresee the expected damage scenario.
In this perspective, the proposed formulation was applied to an urban sector of the Italian municipality of San Pio delle Camere, hit by the 2009 Abruzzo seismic sequence. In this city, a masonry building compound was selected as a case study and the efficiency of the proposed formulation was tested. Specifically, the damage forecast deriving from the proposed formula was compared to the really detected seismic damages. The good forecast of the real damage level reached allowed to consider the formulation reliable enough to predict the possible damages suffered by the Romanian building heritage under seismic actions, so to be considered as a useful tool to define a priority ranking to implement appropriate seismic prevention measures.
2. MATERIALS AND METHODS
2.1. Seismicity of Banat Region
The Western and Southern-Western parts of Romania, well known as the Banat Region, is undoubtedly one of the most seismically active regions of the country, characterised by crustal earthquakes. Due to the presence of multiple vulnerability factors, such as old houses, high population density, unprotected historic buildings, factories, etc., the seismic risk of the region is very high.
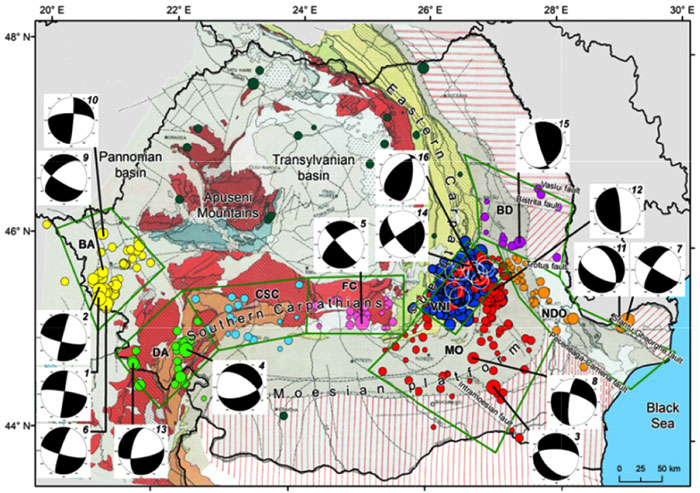
Generally, the earthquakes in the Banat region occurred at the contact between the Carpathian and Pannonian plates (from Timisoara to S-W Jebel and Banloc and north of the Bega canal) and at the contact among irregular structures straddling Sânnicolau Mare, Nădlag-Jimbolia, Arad-Vinga- Calacea and Timis Valley in Faget. Moreover, the distributions of focal mechanisms associated with the earthquakes that occurred in the South-West of Romania showed a reverse and strike faults or the combination of the two. The focal depths of earthquakes in the western areas of Oltenia and Banat-Danube were between 5 and 33 km deep (Fig. 1) [10].
The most significant earthquakes that occurred in the Banat Seismic Region (BSR) were the two seismic events detected in Banloc in 1991 characterised by moment magnitude, Mw, of 5.5 and 5.6, respectively. In particular, the accelerometer records, taken by INCERC Research Institute, for the cities of Timişoara and Banloc, have highlighted earthquakes with the following characteristics: (i) relatively short duration of 9-24 s and (ii) significant spectral values in the range 0.1-0.3 s, which extends up to 0.7 s for the Timişoara record and up to 1.2 s for the Banloc one [11].
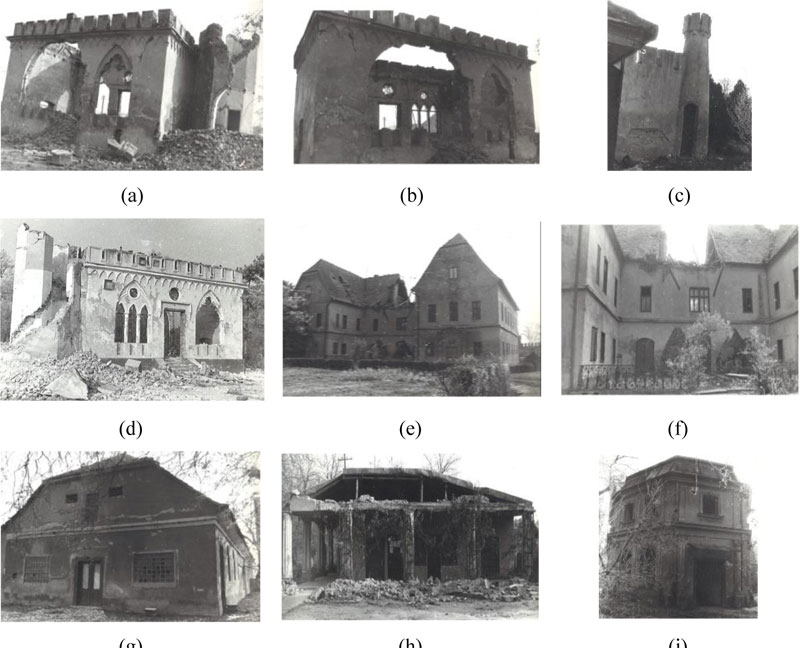
The damages observed after the 1991 earthquakes have shown that the Type of failure mechanisms occurred in the epicentral area (cities: Banloc, Voiteni and Ciacova, located 30-50 km far from Timisoara) have been characterised by a high level of damages to vaults, arches, towers and chimneys, as reported in Fig. (2) [12].
Moreover, the city of Timisoara is the biggest city located in the Banat seismic region, which is the second most important seismic zone of Romania (Fig. 3a), with an expected PGA equal to 0.20 g considering a return period, Tr, of 475 years [13, 14]. In Timisoara, there are two active seismic faults, as reported in Fig. (3b), both concentrated in the western part of the city.
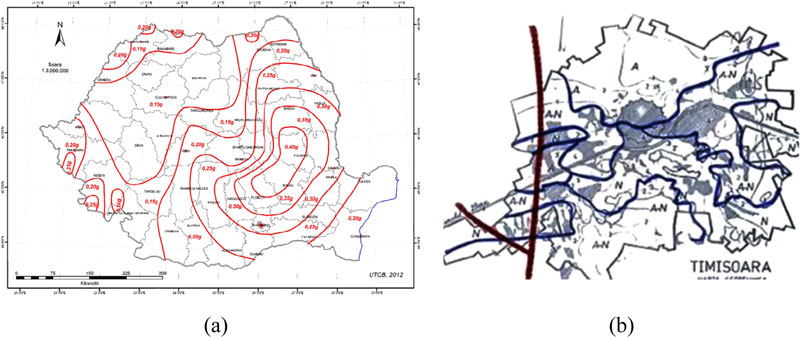
From the previous figure, it is evident that the seismic hazard of Timisoara is very high due to the seismogenic faults present in the area. Furthermore, most of the buildings located in the historic areas of the city were designed without anti-seismic criteria. For these reasons, it is essential to provide appropriate vulnerability studies to limit expected losses and to implement a systematic seismic risk mitigation plan.
3. RESULTS
3.1. Iosefin and Fabric Urban Districts
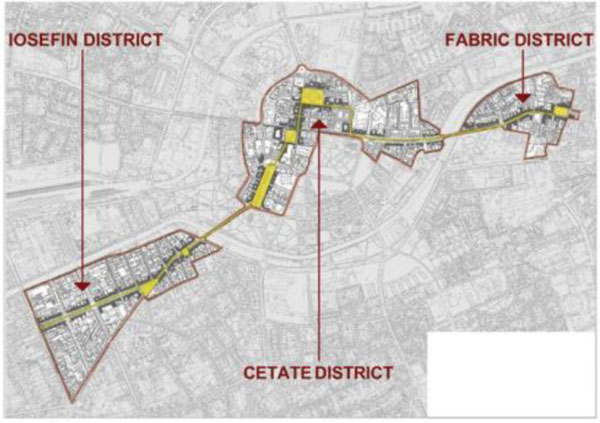
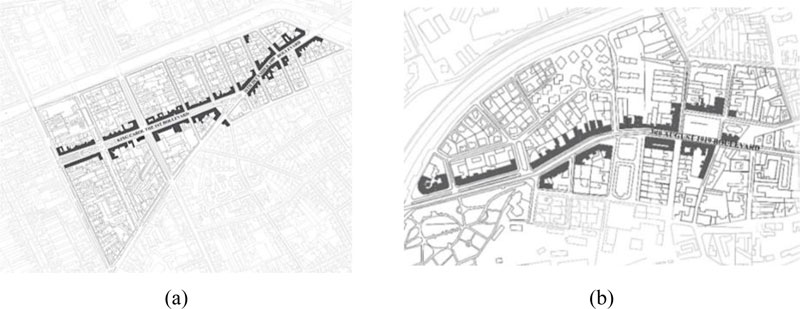
Nowadays, the city of Timisoara is the result of urban decision-making that were taken in the past. At the moment, three main historic districts can be identified. The most important is the district of Cetate, followed by Iosefin and Traian, the latter denominated as Fabric (Fig. 4) [15]. One of the most important aspects is that the district of Cetate is not so homogeneous today due to the high number of new buildings, rehabilitation works, or expansions of existing buildings. For this reason, the areas investigated are Iosefin and Fabric, which have maintained their architectural authenticity.
Furthermore, the study areas have been chosen based on a proposed cultural promenade, which outlined the main public places that could host cultural events considering that, in 2021, Timisoara will be the European Capital of Culture.
The selected districts have a reasonably homogeneous architectural distribution from typological and structural points of view. In particular, the buildings were built in the late 19th and early 20th centuries and they are characterised by vertical structures made of solid brick masonry walls and horizontal structures composed of masonry vaults and wooden floors. The total number of buildings surveyed is 105, of which 68 are located in Iosefin and 37 in Fabric (Fig. 5).
More specifically, the Iosefin area was initially designed as a village for German colonists, on both sides of the Bega river, with large houses and luxurious gardens. The district took its name from the visit of Emperor Joseph II of Habsburg, in the year 1773. From a typological point of view, only 27% of the buildings analysed have one level above the basement, 37% have two levels, 33% have three levels and finally, 3% of cases have four levels above the basement.
After on-site inspection, it was noted that most of the buildings are continuously defined on the main road, forming closed areas with common internal courtyards. At least, 35% of the building’s stock is placed in a corner position in the aggregate, while only 3% of buildings are built as isolated constructions (Fig. 6) [15, 16].
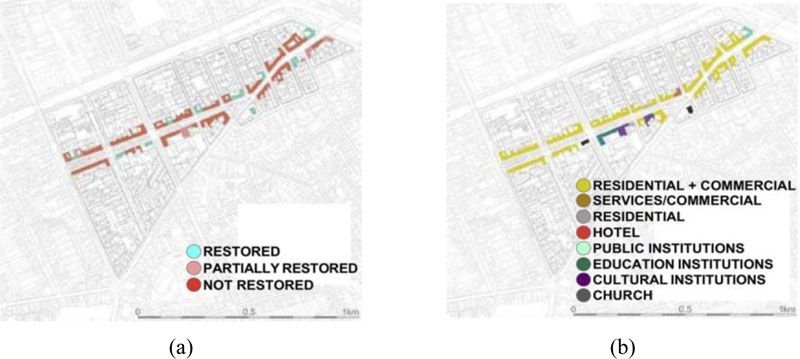
Most of the buildings (75% of the cases) are in a medium-low state of conservation, with problems due to the lack of adequate maintenance, only 15% have been recently restored. In comparison, almost 10% were only partially restored (Fig. 7a) [15, 16]. The dynamism of the area is highlighted by the commercial promenade, that connects all the commercial spaces located on the ground floor of the buildings; only 3% of the total number of buildings is residential, while 3% represent cultural, educational and eclectic buildings, similar to the percentage of public buildings and hotels, distributed along the main avenues in the area, King Carol on 1st and 16th December 1989 (Fig. 7b) [15, 16].

Similarly, the Fabric area was not inhabited until the year 1716 and its history began during the Habsburg administration. At that time, the production functions were located in the eastern part of the city, in today's Fabric district. Small workers' houses were also built and the most extensive development in the region was recorded in the middle of that century when more than 50% of the city's population lived in the Fabric area. Along with this densification, the buildings were expanded and new, larger and taller ones were built.
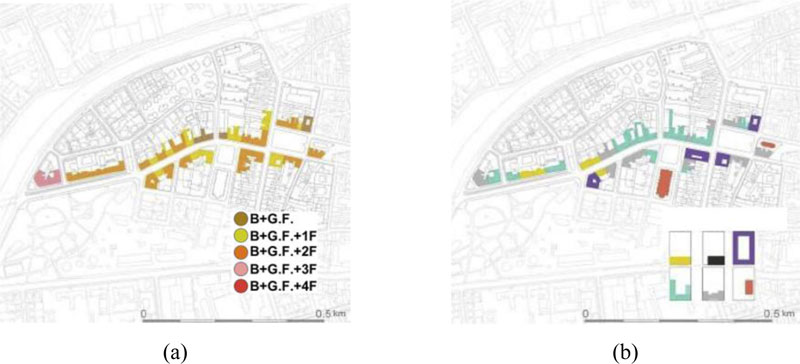
The on-site inspection has shown that most of the buildings in the area have three levels above the basement (> 50%), while 35% of buildings have two levels, 10% have one level and only 5% of the cases have four levels above the basement.
Moreover, more than 40% of the buildings are located in a corner position in the aggregate, closing perimeters and forming common internal courtyards (Fig. 8) [15, 16].
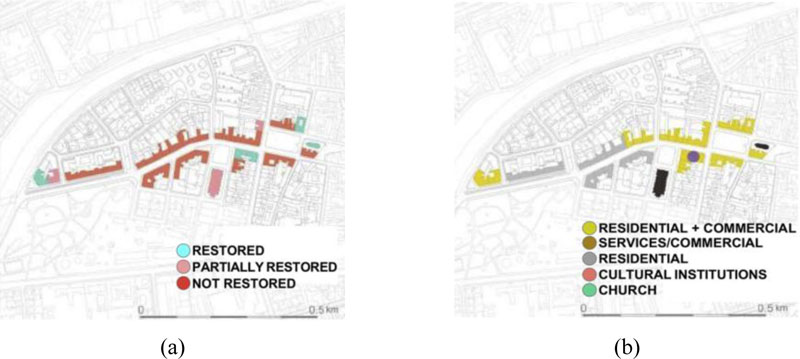
Furthermore, only 10% of the buildings have been comp- letely rehabilitated, 8% are partially restored, while 82% are in a medium-low state of conservation. On the other hand, the central pole of activity is located in Traian square, where more than 55% of the buildings have commercial spaces on the ground floor, as reported in Fig. (9) [15].
3.2. Typological Characterisation of the Building Stock
The structural and typological characterisation is to be considered indispensable for the census of the buildings exposed at risk, which is used for classification purposes into typological classes. In particular, this analysis has been herein used in order to detect the prevalent ordinary building typo- logies in the Iosefin and Fabric districts, characterised by typological and structural homogeneity. Most of the buildings surveyed are made of brick masonry and lime mortar, which form massive walls, with a thickness ranging from 40 cm to 80 cm. The most common arrangement of buildings is with the long façade oriented parallel to the street front (X direction) and the short façade perpendicular to the street front (Y direction).
In fact, the buildings have substantial structural walls that are parallel to the main road, and a massive longitudinal structural wall in the middle part of the building with the thickness of 80 cm in the basement and 40 cm at the top floor. In most cases, there are few structural transversal walls, most of which with a thickness from 10 to 15 cm, to delimit the functional areas. However, since these are historical buildings, in general, the longitudinal walls are not connected to the transverse walls; therefore, there is a high risk that the out-of-plane failure mechanism could be activated.
The horizontal structures are made of masonry vaults, usually above the basement level with a thickness of 15-20 cm, and wooden floors for the other levels, with a single or double layer of wooden beams [17-20]. The wooden structure of the roof is usually very rigid and complex, typical of the constructive and technological influences of the German construction practice.
Based on the geometric and structural features, it has been possible to make a classification properly conceived for the historical areas analysed. This typological classification con- sists of dividing the buildings into three main classes based on the number of levels above the basement, from one to more than three (i.e. typology class I, typology class II and typology class III), as reported in Fig. (10) [16].
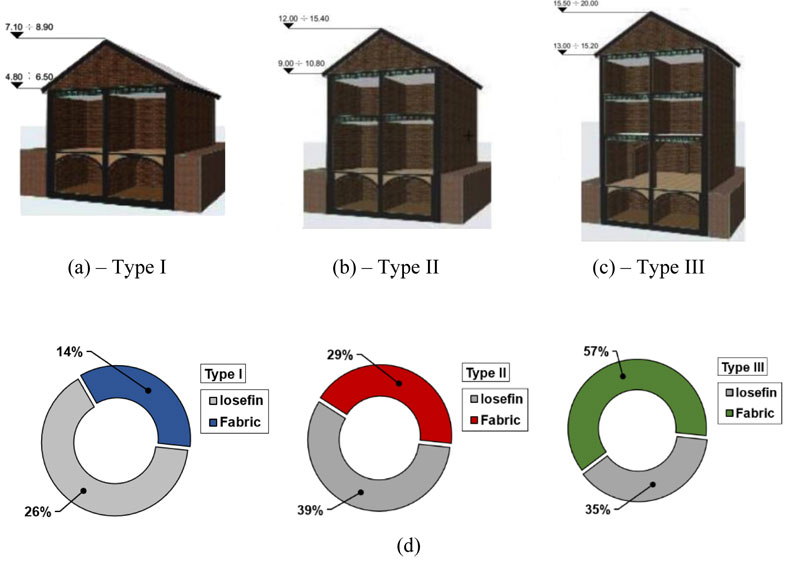
| Number of Levels above Basement | Typology Class | Percentage of each Class in Iosefin District | Percentage of each Class in Fabric District |
|---|---|---|---|
| One | Type I | 26% | 14% |
| Two | Type II | 39% | 29% |
| Three or more | Type III | 35% | 57% |
In detail, the surveyed results have been suitably summarised in Table 1.
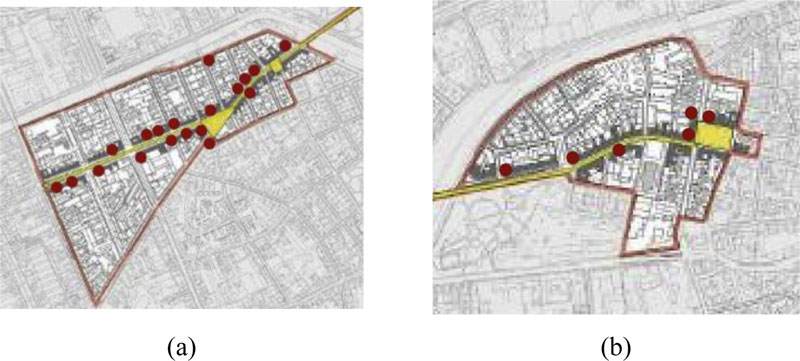
From the obtained results it can be seen that in the Iosefin district about 26% of the buildings belong to the typology class I, 39% to typology class II and 35% to the typology class III. Similarly, for the Fabric district, most of the buildings belong to typology class III. Furthermore, only 4% of the total number of buildings with four levels above the basement, i.e. ground floor and three other floors, are presented in the area and they are included in the typology class III. As mentioned in Section 2.2, a detailed survey activity has been conducted on 67 buildings located in Iosefin area and on 37 buildings in the Fabric district. However, this macroscopic analysis has been extended only to 25 buildings, intended as representative of the typology classes present in the two examined historical areas. The identification of the building’s sample is depicted in Fig. (11), where the red circle has been used to identify the selected case study buildings in which detailed investigations have been made.
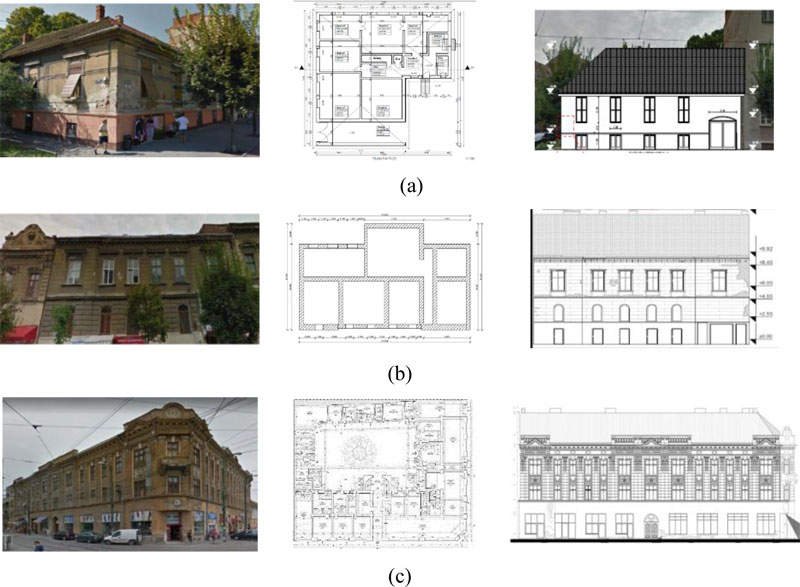
Specifically, the typology class I buildings, represented by six constructions (24% of the cases), have a basement and ground floor, masonry vaults above the basement and wooden floor above the ground floor and, generally, are provided with very few decorations not always maintained in the architectural style of the area. The in-plane and in-elevation configurations are regular. Small masses characterise these buildings, and the degradation source is mainly represented by the enlargements of the façade and by the internal modifications/interventions made recently, that influenced their bearing capacity. Typology class II buildings (12 constructions, that is 48% of the sample) are characterised by a basement, a ground floor and a first floor, with masonry vaults above the basement and wooden floors above the other levels. The main problems are guaran- teed by the lack of proper maintenance and modifications, as well as the decay of the facade material. The plan layout is based on either rectangular or L shapes. Also, in-elevation configurations are regular without changes in the wall thickness along the heights of buildings. Finally, typology class III buildings are represented by seven historic constructions (28% of the sample).
These buildings are characterised by large masses and massive walls, basement, ground floor and two other levels, brick vaults above the basement and wooden floors above the other levels. The wooden roof structure is complex and robust. The main problems are similar to those of Type II buildings, such as lack of adequate maintenance, structural alterations of commercial spaces and deterioration of facade materials. The plan configuration is complex (usually U-shaped or L-shaped) and the elevation is regular, with small alterations due to the reduced thickness of the walls along the height of buildings. Some examples of the investigated typological classes are shown in Fig. (12) [16].
3.3. Seismic Vulnerability Assessment Method
3.3.1. Empirical Approach
A seismic vulnerability assessment at an urban scale has been implemented to evaluate the propensity at the damage of buildings exposed at earthquakes. In this context, a vul- nerability index-based method has been adopted. The peculiarity of this method, proposed in a study [21, 22], is the possibility of investigating the seismic vulnerability of build- ings grouped in compounds through the vulnerability form depicted in Table 2.
| Parameters | Class Score, Si | Weight, Wi |
|||
|---|---|---|---|---|---|
| A | B | C | D | ||
| 1. Organization of vertical structures | 0 | 5 | 20 | 45 | 1.00 |
| 2. Nature of vertical structures | 0 | 5 | 25 | 45 | 0.25 |
| 3. Location of the building and type of foundation | 0 | 5 | 25 | 45 | 0.75 |
| 4. Distribution of plan resisting elements | 0 | 5 | 25 | 45 | 1.50 |
| 5. In-plane regularity | 0 | 5 | 25 | 45 | 0.50 |
| 6. Vertical regularity | 0 | 5 | 25 | 45 | 1.00 |
| 7. Type of floor | 0 | 5 | 15 | 45 | 1.00 |
| 8. Roofing | 0 | 15 | 25 | 45 | 0.75 |
| 9. Details | 0 | 0 | 25 | 45 | 0.25 |
| 10. Physical conditions | 0 | 5 | 25 | 45 | 1.00 |
| 11. Presence of adjacent building with different height | −20 | 0 | 15 | 45 | 1.00 |
| 12. Position of the building in the aggregate | −45 | −25 | −15 | 0 | 1.50 |
| 13. Number of staggered floors | 0 | 15 | 25 | 45 | 0.50 |
| 14. Structural or typological heterogeneity among adjacent S.U. | −15 | −10 | 0 | 45 | 1.20 |
| 15. Percentage difference of opening areas among adjacent facades | −20 | 0 | 25 | 45 | 1.00 |
This form, based on the original method proposed by Benedetti and Petrini some decades ago [23], has been appropriately extended to masonry building aggregates by Formisano et al. (2015) [21] using five new additional para- meters, which take into account the effects of mutual interaction among aggregated Structural Units (S.Us) under earthquakes.
Methodologically, the vulnerability index, IV, is calculated for each S.U. as the weighted sum of the class selected for each of the 15 parameters listed in Table 1 multiplied by the respective weight. The estimated parameters are grouped in 4 vulnerability classes (A, B, C and D, from the best to the worst), characterised by a specific score (also with a negative sign in case of vulnerability reduction), which a correspondent weight, Wi, is assigned to, it being variable from a minimum of 0.25 for the less important parameters up to a maximum of 1.50 for the most important one [16, 24].
Thus, the vulnerability index, IV, is calculated according to the following equation:
 |
(1) |
where, Si, is the score associated to the i-th parameter, and Wi is the i-th parameter weight. Subsequently, the vulnerability index value IV is normalised in the range [0−1] by means of Equation (2), assuming, from this moment, the notation VI [16]:
 |
(2) |
where Iv is the vulnerability index evaluated according to the previously Equation (1), IV,min is the minimum vulnerability index achieved selecting the best class (A) for each parameter and IV,max is the maximum vulnerability index calculated choosing the worst class (D) for each parameter.
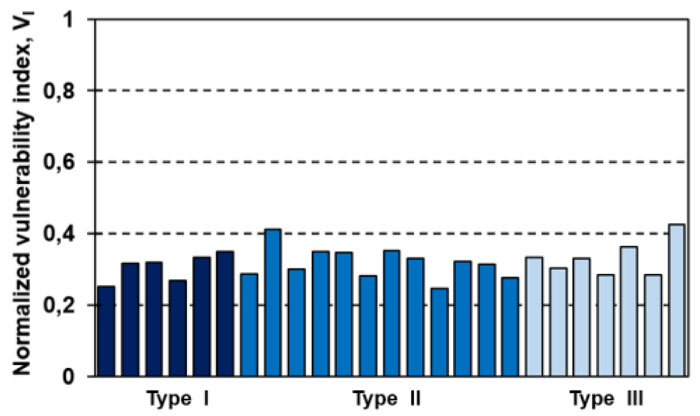
Thus, considering the sample of 25 buildings in the two districts, the distribution of the typological vulnerability is represented in Fig. (13).
As it is seen in the previous figure, the distribution of the vulnerability results is quite homogeneous, with an expected moderate vulnerability level. Moreover, the maximum vulne- rability index, VI, equal to 0.41, is associated with both the typological classes II and III.
Subsequently, vulnerability curves have been obtained to estimate the propensity at the damage of the analysed building typologies (Fig. 14). In particular, the vulnerability curves [25, 26]correlate the level of the expected damage that a building could reach under a given seismic intensity “IEMS-98”, which is defined according to the European Macroseismic Scale EMS-98 [27]. In particular, as proposed in a study [14], earthquakes with an epicentre magnitude, Mw, of 5.6 - 5.8 occurred 20-25 km far from the city of Timisoara [14], which the most probable macroseismic intensity equal to IX according to the European Macroseismic Scale [27] was assigned to.
The vulnerability curves, depending on the vulnerability index (VI), on the seismic hazard, expressed in terms of macroseismic intensity (IEMS-98), and on the ductility factor Q, which is representative of the ductility of masonry buildings and assumes, as specified in a study [6, 28], the value of 2.3, are calculated according to the following relationship.
 |
(3) |
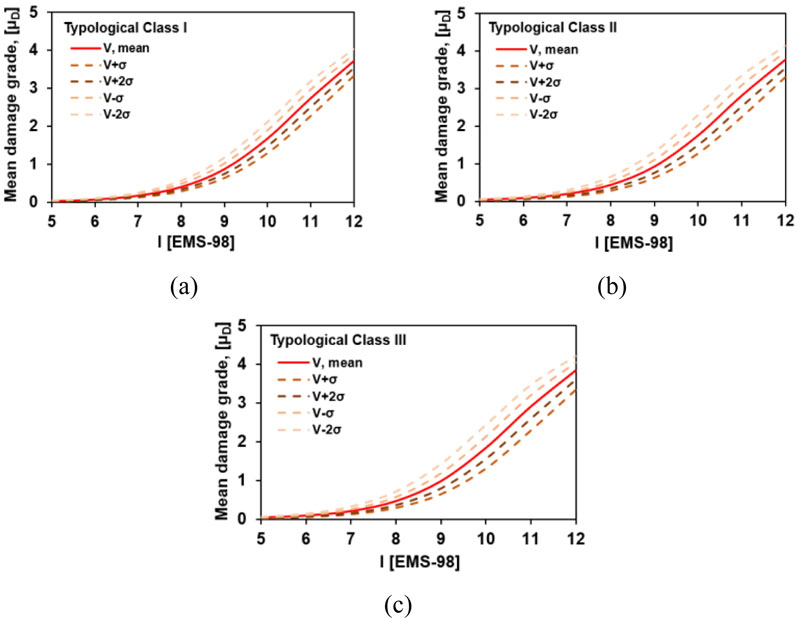
As reported in the previous figure, the vulnerability curves are derived for a sample of buildings representative of the construction types found in the inspected areas. However, for a more accurate representation of the expected damage, the mean typological vulnerability curves have been represented together with other curves taking into account the statistical variability of damage in the vulnerability range (Vm−σ, Vm+σ; Vm+2σ, Vm−2σ) [16, 26, 28, 29].
Extending this methodology to all historic buildings in the two districts inspected, it has been possible to define the scenario of expected damage in terms of Damage Probability Matrix (DPM), as shown in Fig. (15) [28].
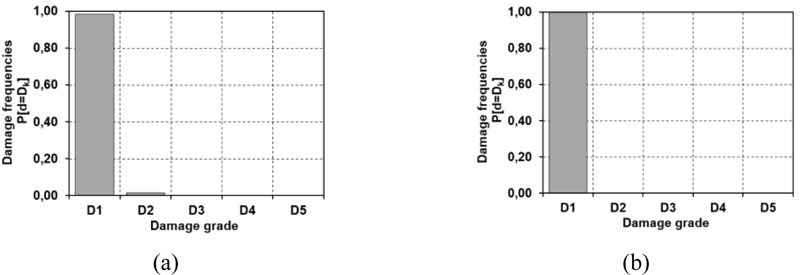
Therefore, analysing the results obtained through an empirical-observational approach, it can be noted that a macroseismic intensity of IX EMS-98 would not be dangerous for the historic masonry buildings in the city of Timisoara, leading to no damage neither to structural and non-structural elements.
On the contrary, the earthquake occurred in Banloc, in conditions entirely analogous for the proposed seismic scenario, causing significant damage to historic masonry buildings having the same features of those herein investigated. For this reason, it seems essential to perform numerical analysis to evaluate in a more detailed way the possible seismic damages of constructions, so to calibrate the empirical methodology based on these results [16].
3.3.2. Mechanical Approach
The empirical methodology has anticipated a mechanical-based approach performed to more appropriately evaluate both the overall seismic capacity of the typologies examined and the possible expected failure mechanisms. However, being nece- ssary for an on-site inspection of constructions for mechanical analysis, only the most representative 25 buildings within the three buildings classes have been examined.
Nonlinear analyses on these buildings have been made using the 3Muri software [30, 31]. The input data have required the knowledge of the structural elements, such as Type of floors, vaults and roofs, thickness and Type of masonry walls, etc. The investigation has been performed considering only in-plane failure mechanisms, considering that the out-of-plane failure mechanisms were less recurring in the study area under the recorded earthquakes.
In order to assess the mechanical properties of the masonry of the investigated buildings, several experimental tests on similar masonry historical buildings from Timisoara have been examined [32-35]. These buildings had geometrical, structural and typological characteristics similar to those of the constructions herein inspected [16]. The mechanical properties used for nonlinear analyses have been summarised in Table 3.
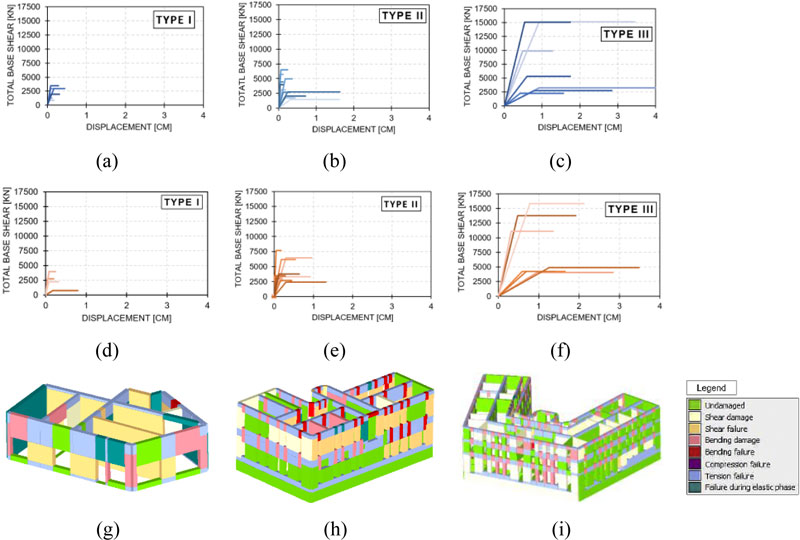
The analysis has been performed on each of the 25 masonry buildings, considered as an individual structural unit. Generally, the structural model is based on the equivalent frame model, assuming that the masonry wall with openings can be modelled by a set of single-dimensional elements, such as columns, beams and nodes. In the pushover analyses, the inter-storey drift threshold has been considered as equal to 0.5% for the damage limit state [36]. To evaluate the seismic demand, the specific seismic spectrum characteristic of the Banat seismic region has been defined. Therefore, the capacity curves of SDoF systems have been obtained for each building of the Type I, Type II and Type III classes [16 and the specific in-plane failure mechanisms for the three buildings representative of the three classes examined have been shown, as reported in Fig. (16).
Based on the nonlinear analysis performed, the parameters representative of the pushover curves of examined buildings and the related mechanical vulnerability indexes IMEC have been calculated [16], as depicted in Table 4.
The results obtained have shown that the mechanical vulnerability indexes are lower than 1. Therefore, since the seismic demand is lower than the seismic capacity, the buildings are able to withstand the design earthquake at a life safety limit state. In particular, in X direction, the vulnerability indexes are very homogeneous; instead in Y direction larger scatters are detected among three buildings. More in detail, the lowest mechanical vulnerability index is associated with the typological class I building, which has IMEC=0.26, probably due to the small height and masses. Buildings of typological classes II and III have indexes about 8% and 30% larger than the Type I building ones.
| Mechanical Properties | fK [MPa] | fVK0 [MPa] | E [MPa] | G [MPa] | Density [KN/m3] |
|---|---|---|---|---|---|
| URM type | 2.35 | 0.06 | 2350 | 940 | 18 |
| Typological Class | Dy [cm] | Du [cm] | Fmax [KN] | IMEC | ||||
|---|---|---|---|---|---|---|---|---|
| X dir. | Y dir. | X dir. | Y dir. | X dir. | Y dir. | X dir. | Y dir. | |
| Type I | 0.09 | 0.09 | 0.31 | 0.60 | 1982 | 2232 | 0.30 | 0.26 |
| Type II | 0.14 | 0.13 | 0.52 | 0.48 | 3443 | 4000 | 0.33 | 0.28 |
| Type III | 0.67 | 0.73 | 2.40 | 2.11 | 7633 | 8304 | 0.30 | 0.34 |
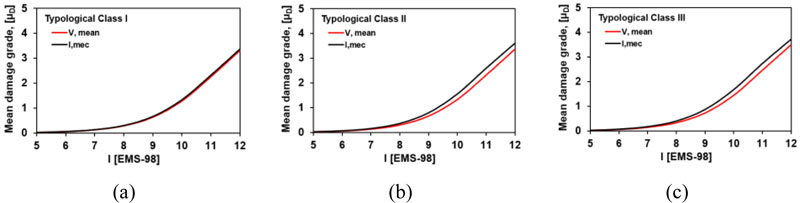
Consequently, to obtain a single synthetic parameter for mechanical vulnerability assessment, an average vulnerability index for each building class has been calculated. Operation- ally, for each analysis direction, it has been evaluated as the average value among indexes of all buildings of the three typological classes investigated. Afterwards, the maximum value between the two mean mechanical vulnerability indexes in the two directions has been selected as representative of the global behaviour of the building class. Thus, for typological class I, the mean vulnerability index has been calculated as equal to 0.31, while for typological classes II and III, it assumes values of 0.35 and 0.37, respectively. Starting from these vulnerability indexes, changing the macroseismic intensity, the mechanical vulnerability curves have been plotted, as depicted in Fig. (17). In the same figure, the comparison between the macroseismic and mechanical appr- oaches, in terms of mean damage grade, µD, has been presented [6].
The comparison between the applied methodologies shows how the two approaches are comparable, providing approxi- mately the same level of expected damage. Nevertheless, as shown in Fig. (16), the mechanical approach offers a clear indication of the possible failure mechanisms that occurred for both structural and non-structural elements, entirely neglected by the macroseismic method [16]. Moreover, the formulation of the mean damage grade, µD, proposed in a study [6] provides a damage level not on the safe side in predicting the numerical analysis one and, therefore, it needs to be adapted to historic masonry buildings located in the Banat Seismic Region.
3.4. Calibration of Typological Vulnerability Curves for Banat Seismic Region (BSR)
The proposed method aims at calibrating the typological vulnerability curves based on the results derived from mecha- nical analysis. As observed in Section 3.2, the mechanical analysis provides clear and exhaustive indications on the effective level of damage that could occur for a given earthquake scenario. The empirical analysis has shown rapid applicability, but a substantial underestimation, of the level of expected damage, being very restrictive. These significant differences can be related to the intrinsic uncertainties of the basic methodology, since the results are obtained based on visual inspections, without very detailed measurements and without accurately determining the mechanical properties of the materials or the precise seismic actions.
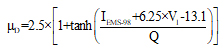
Based on these considerations, it is clear that the proposed calibration of the typological vulnerability curves for near-field areas is desirable since they represent a useful tool for the evaluation of the damage induced by a seismic event through a synthetic parameter, i.e. the mean damage grade (µD) [28]. Therefore, the main aspect to consider is to identify a mathe- matical law that could increase the expected damage level, to reach a damage threshold equal to D2-D3 for macroseismic intensity of IX of the EMS-98 scale, as indicated by the performed nonlinear analysis [37].
The mathematic expression of the proposed law is given by the following equation:
 |
(4) |
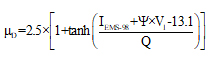
where, the seismic hazard is always expressed in terms of macroseismic intensity (IEMS-98), the ψ-factor has been assumed equal to 12.50, it is related to the variation of the slope of the curve and, finally, the ductility factor Q, which describes the ductility of masonry typological classes, has been assumed to be equal to 2.3 [16, 6]. Thus, a representation of the damage-intensity curve has been provided, as illustrated in Fig. (18).
From the results depicted in Fig. (18) it is possible to notice that for each class of buildings, for the same seismic intensity level, there is a difference of at least one state of damage. The empirical formulation, as it is noted, tends to underestimate the expected damage. Therefore, the most probable damage states of D1-D2 indicated by the vulnerability curves are not reliable, indicating the fact that the damage estimate formula (Equation 3) cannot be adapted to the specific Banat Seismic Region.
Finally, the proposed mathematical formulation has been validated by the application to the municipality of San Pio delle Camere (province of L'Aquila, Italy), which was damaged by the seismic sequence that affected the Abruzzo Italian region in 2009, as shown in the next section.
4. DISCUSSION
4.1. The Municipality of San Pio Delle Camere (AQ)
4.1.1. Historical Background and Typological Characte- risation of the Built-Up
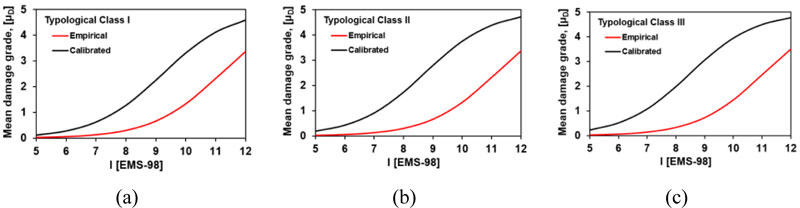
San Pio delle Camere is an Italian town of 586 inhabitants in the province of L'Aquila in Abruzzo (Fig. 19). It rises on the slopes of Monte Gentile and dominates the Tratturo Magno. The first testimony of the town dates back to 1001, while the name refers to the patron saint Saint Pius I, pope and martyr. In the Middle Ages, it was called Sanctus Pius, then Santo Pio and, finally, S. Pio.
The town was built around the main church dedicated to San Pio, destroyed by the troops of Braccio da Montone in 1424 and rebuilt in the mid-sixteenth century. The buildings in the historic centre dated back to the 15th century and were developed along narrow streets.
Nowadays, San Pio delle Camere is made up of two parts: the old one, the historic centre, and the more recently built one, still under development. The historic centre, being erected in medieval time, is located in an elevated position compared to new buildings and underwent invasive restorations over the centuries, especially in recent decades.
The building of S. Pio delle Camere, for the most part, are located on land with steep slopes. They belong to a counter-ridge settlement, which develops on an articulated mountainous side, with a very diversified entity of the slope.
The structures develop parallel to the contour lines (Fig. 20) on a steep slope and are configured as a homogeneous building agglomeration with one of the main elevations facing downstream.
The aggregates, thus distributed according to functional needs, developed according to the so-called “proffered house” configuration. Specifically, this building was characterised by two or three superimposed cells, in which the ground floor, also having a private entrance, was intended for storage or animal shelter and was separated from the upper levels.
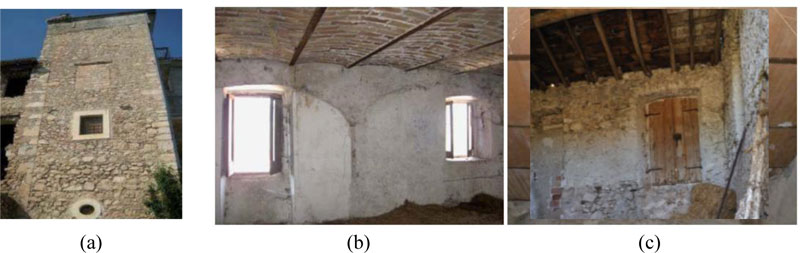
In general, the historical centre consists of buildings with heights up to three floors and, in rare cases, four floors. The vertical structures are in rough stone (thicknesses of 60 cm) with the basement used for commercial or pastoral activities, while the upper floors are for private use. The horizontal structures are typically made up of masonry vaults or, in some cases, of wooden beams (Fig. 21).

4.1.2. Post-earthquake Survey after 2009 Seismic Event
The earthquake that occurred on 2009 April 6th was characterised by moment magnitude, Mw, equal to 6.3 with the epicentre localised near the city of L’Aquila. The seismic event produced greater damage to buildings, especially in areas near the Paganica surface fault system, with an epicentre intensity, Is, of VII according to the MCS scale. This seismic area is highly vulnerable since it was subjected to local amplification effects connected to the particular soil type detected.
The same situation also occurred in the town of San Pio delle Camere. Still, the buildings suffered damages less than those of other nearby places (such as the urban district of Castelnuovo), since the buildings sample were constructed on the bedrock. This circumstance showed how the buildings, erected on the bedrock basement, were not affected by the local amplification phenomena, which instead happened for areas with sedimentary soil deposits.
The analysis of the damage occurred was done by the research unit of the University of Naples “Federico II”, coordinated by Prof. Formisano, in the framework of the Italian research project ReLUIS 2011-2014 financed by the Italian Civil Protection Department. The damage analysis mainly referred to the masonry buildings of the historical centre for residential use. In the first instance, from a general analysis conducted on the historical part of the municipality, few partial or total collapses of the buildings were observed. Contrary, serious damages were mainly concentrated in the masonry vaults and walls, as reported in Fig. (22) [38, 39].

From the previous figure, it seems evident that the damage occurred is greatly influenced by the nature of the type of earthquake. Generally, these failure mechanisms are attri- butable to the effects induced by the ground motion vertical component, which, especially in the case of near-field pheno- mena, are consistent, as also reported in a few study [40, 41].
4.1.3. Vulnerability Assessment and Damage Validation
Aiming at assessing the damages caused by the 2009 April 6th earthquake, the seismic vulnerability levels of the aggre- gates of San Pio delle Camere have been estimated using the empirical methodology previously examined in Section 3.1. The results presented in a study [39] allowed to both have a classification of the building heritage and to identify the damage that occurred in terms of the mean damage grade, µD. The vulnerability and damage maps of the historic urban sector of San Pio delle Camere are shown in Fig. (23).
Subsequently, to limit the uncertainties associated with the applied empirical methodology and considering the real global structural response of the structure, the validation of the proposed formulation for near-field events (see Eq. 4) has been done investigating the mechanical approach of a masonry aggregate located in the historic centre.
The selected building aggregate is composed of six individual structural units (S.U.) from A to F (Figs. 24a and 24b). It is representative of the building typologies present in the urban sector. The urban delimitation of this row building aggregate, as most of the common typologies within Italian historical centres, is given by street layout [38].
The building aggregate has a total plane area of 319.5 m2 and a total volume of 4535 m3. The wall thickness of structural units varies approximately between 0.50 and 1.10 meters, while storey height ranges between 2.60 and 3.20 meters.
The north façade has two underground storeys, represen- ting approximately 15.5% of the total volume of the aggregate, so having a higher stiffness than that of the opposite façade. The building, following the 2009 earthquake, suffered a damage level D3 according to the EMS-98 macro-seismic scale. Nonetheless, the building was declared unusable accor- ding to the Post-Earthquake Damage and Safety Assessment (AeDES) form.
Regarding structural materials, this building aggregate is mainly made of stone masonry blocks having mechanical parameters reported in [38, 39].
The Macro-element model, developed by the 3Muri analysis program [30], has been used to model the masonry compound, as depicted in Fig. (24c) [38]. The site is charac- terised by a PGA of 0.26 g, which a macroseismic intensity of VII corresponds to.


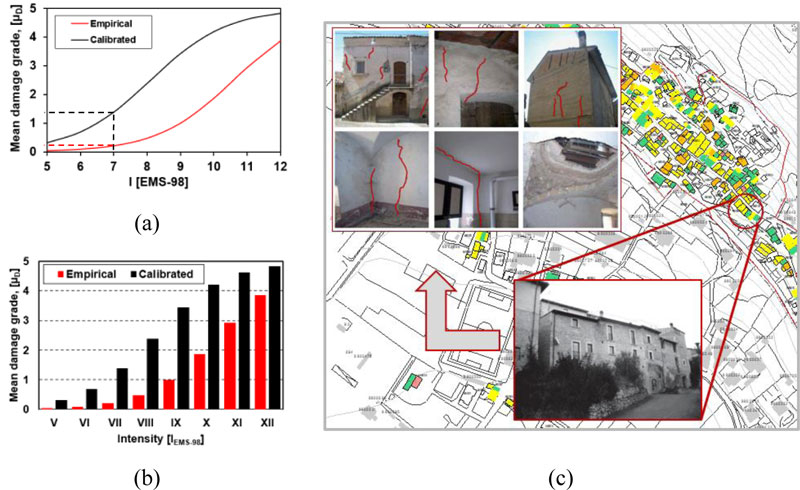
From pushover analyses performed on the masonry aggregate [16], a mechanical vulnerability index, IMEC, equal to 0.40 has been derived for the whole aggregate. Once the mechanical vulnerability index has been assessed, the next step is to compare the mechanical index with the expected mean damage grade, µD, derived from both empirical and calibrated formulations in order to take into account the effectiveness of the simplified approach in predicting the structural damage. To this purpose, a direct comparison of the above-mentioned formulations is presented in Figs. (25a and 25b).
From the results obtained, it is evident that considering the damage scale between 0 and 1, for a macroseismic intensity of VII, the empirical formulation discussed in a study [6] provides a damage level of about 0.05, while the new calibrated curve gives a damage level of about 0.3. Therefore, considering that the mechanical index is 0.40, it appears that the original empirical formula tends to underestimate too much the expected damage. In contrast, the new method, even if it is not on the safe side, allows to predict the same damage level (equal to 2, as shown in Figs. (25a and 25b), depicted in reality in Fig. (25c), which has been attained by more complex numerical analyses.
CONCLUSIONS
The proposed article provides a clear reading of the seismic vulnerability of historical masonry buildings within the Banat Seismic Region (BSR), which is one of the seismically active regions of the whole Romanian territory. To this purpose, two different historical areas of the city of Timisoara, namely Iosefin and Fabric, have been selected as case studies.
First of all, a direct and exhaustive typological classifi- cation of the buildings present in the study areas was carried out. The total number of buildings surveyed was 105 (68 for the Iosefin district and 37 for the Fabric district). These buildings were classified according to their structural and architectural peculiarities into three different classes called Type I, Type II and Type III.
In the first step, the seismic vulnerability assessment has been conducted by means of empirical and mechanical appro- aches to foresee better the behaviour of historic masonry buildings of the Banat Region. In this context, 25 buildings have been selected as reference cases of the two urban districts of Iosefin and Fabric. The main outlines deriving from the applied methodologies are summarised as follows:
- − for historic buildings in Timisoara, the empirical methodology is more restrictive than mechanical analysis, since it tends to underestimate the expected damage levels. In fact, it has been observed that, based on the seismicity of the Banat area, the empirical model provides a maximum level of damage equal to D1 (no damage) for both structural and non-structural elements. Furthermore, from the results obtained by numerical analysis, it can be seen how the damage obtained, considering the original empirical formu- lation, provides a damage threshold not comparable with the empirical method. However, this formulation does not provide the adequate damage level reached by the mechanical analysis, but it is more restrictive;
- the mechanical methodology, applied to the three of building classes, fully captures the in-plane-failure mechanisms for different structural elements and provides in all case seismic safety conditions;
- the formulation proposed for estimating the mean damage grade, µD, was calibrated based on the mechanical analysis performed and according to the earthquakes that occurred in the Banat area. Methodologically, the main aspect of the proposed formula was to correlate the damage achieved from numerical analysis to the real ones detected after 1991 Banloc earthquake. Thus, the theoretical formula available from literature was slightly modified in order to calibrate the experimental evidence in terms of damage. To this purpose, a value equal to 12.50 has been associated to the coefficient ψ, that affects the slope of the curve.
In the second step, the proposed formulation was applied and validated in an urban sector of the municipality of San Pio delle Camere (Italy) damaged after the strong seismic sequence that affected the Abruzzo region in 2009.
This historical centre was investigated by the research unit coordinated by A. Formisano in the framework of three-year Italian research project ReLUIS-DPC 2011-2014. Generally, the damages occurred were greatly influenced by the nature and type of earthquake.
The detected failure mechanisms were attributable to the effects induced by the ground motion vertical component, which, especially in the case of near-field phenomena, are significant. In order to predict better the seismic damages that occurred in the historical centre of San Pio delle Camere, a historical masonry aggregate was selected as a reference case study and nonlinear static analyses were performed. The main results are presented as follows:
- − the empirical analysis conducted on the whole historic centre denotes a moderate level of both vulnerability and damage;
- − a numerical analysis, performed on the case study aggregate, provides a medium-low mechanical vulnerability level, with an index of 0.40;
- − in terms of damage, it was estimated that the proposed formulation provides satisfactory results compared to the mechanical damages. Moreover, the proposed empirical relationship, even if calibrated on Romanian buildings, provides for the investigated Italian masonry compound a damage level close to the real one detected after the 2009 seismic event.
In conclusion, the work presented represents an important starting point for large-scale vulnerability assessment and risk analysis of buildings belonging to the Banat Seismic Region of Romania, which is considered to be effective also for Italian historical centres. To this purpose, the methodology could be further developed in accordance with the other different masonry buildings detected in the inspected Romanian area in order to predict at a larger extension the expected damage and planning an effective seismic risk mitigation interventions.
CONSENT FOR PUBLICATION
Not applicable
AVAILABILITY OF DATA AND MATERIALS
Not applicable.
FUNDING
None.
CONFLICT OF INTEREST
The authors declare no conflict of interest, financial or otherwise.
ACKNOWLEDGEMENTS
Declared none.

