All published articles of this journal are available on ScienceDirect.
Asphalt Binder Performance Grading for the Republic of Yemen Based on Superpave Asphalt Mix-Design
Abstract
Background:
The asphalt binder is considered a temperature-sensitive viscoelastic material. Temperature can cause some common distress of asphalt pavement, such as rutting (permanent deformation), which correlated with high-temperature environments, and thermal cracking, which correlated with low-temperature environments.
Objective:
This study aimed to establish asphalt binder Performance Grades (PGs) in the Yemeni region to ensure that the asphalt pavement design can effectively resist the distresses of rutting and cracking that occurred due to seasonal temperature changes.
Methods:
In order to determine the performance grades, the temperature zoning was performed by obtaining the last 10 years temperature data of 19 cities in Yemen gathered by the Yemeni Meteorological Authority. The collected data were analyzed based on the trend and statistical reliability. Three air-pavement temperature prediction models of Superpave, LTPP, and Oman model were used to predict air pavement temperatures. The local performance grades were computed using reliability levels of 50% and 98%. Since the dependent variables of latitude in the Superpave equation can more reflect the geographical locations of Yemeni regions rather than the other models, this study strongly approved the SHARP Superpave model to be used to determine the performance grades.
Results:
Based on the Superpave model with reliability analyses, performance grade maps were drawn. The most common performance grades recommended in this study for low traffic volume roads were PG64-10, and PG52-10.
Conclusion:
The findings of this study are highly significant and provide valuable decision support for pavement management and improve the transportation system in the Republic of Yemen.
1. INTRODUCTION
The transportation sector with its various branches is considered an important component of the infrastructure of the Yemeni economy due to its impact on other economic sectors such as the industrial sector, the trading sector, and the tourism sector. Based on the official statistics 2010, the total length of the road network system in the Republic of Yemen was 34,447.1 km, of which 16347.1 km are paved, and 18,100 km are unpaved roads. From 2005 to 2010, the growth rate of asphalt roads reached to 43.46%. The asphalt binder is a temperature-sensitive viscoelastic material; the temperature can cause some common distress of asphalt pavement [1]. Due to the viscoelastic material property, asphalt pavement is susceptible to rutting at high temperatures and subject to cracking due to shrinkage of the binder at low temperatures [2]. Establishing asphalt pavement binder quality standards is a prerequisite for the new highway construction and quality enhancement for the existing asphalt pavements in Yemen. The asphalt binder selection system currently used in Yemen is a penetration grading. The penetration test has been used to determine only one grade of 60-70. Since the test conducted at a single temperature of 25 0°C, it is hard to evaluate asphalt binder rheology properties at low and high temperatures and to determine the temperatures of mixing and compaction of the asphalt that the Superpave PG system can provide. Therefore, it is necessary to analyze the trends of climate data for minimum and maximum temperatures of cities in Yemen and determine asphalt binder grades via predicting the possible changes in temperatures through the statistical reliability techniques.
On such bases, this study aimed to determine the acceptable asphalt binder Performance Grades (PGs) in the Republic of Yemen based on the historic collected air temperature data to predict high and low asphalt pavement temperatures. The study also determined the asphalt binder performance grading maps with 98% and 50% reliability levels. Finally, the most common performance grades were proposed for the Yemeni region. The finding of this study would expand the relevant literature to determine the scientific developments in the field. Moreover, this study could also certainly clarify further research to be developed and conducted on pavement performance at a wide range of climate conditions.
2. BACKGROUND
From October 1987 to March 1993, the US Congress funded a five years program with $ 150 million to develop a new method for testing and designing asphalt materials and enhancing the durability, safety, effectiveness, and highways productivity system in the US [3]. This program was named the highway strategy research program (SHARP). SHARP established the Long-Term Pavement Monitoring Program (LTPP) in 1987 to support an extensive pavement performance analysis, thereby improving engineering tools for designing, managing, and constructing pavements [4].
The Seasonal Monitoring Program (SMP) was proposed in 1991 as a component of LTPP to check and assess the influences of temperature and moisture fluctuations on the performance of pavements and verify the existing models which developed to select the proper asphalt binder based on the SMP data. The minimum air temperature is used as an alternative to the lowest pavement temperature in the actual binder specification, while the LTPP data verify that the low pavement temperature cannot be lower than the lowest air temperature [5].
Based on the initial SHARP testing and SMP data, many pavement temperature approaches were properly established in order to select the proper asphalt binder PGs [6]. Based on the theory of heat and energy transfer, Solaimanian and Kennedy [7, 8] developed an analytical approach, as well as Shao et al. [9]. Proposed a procedure to estimate pavement temperatures. Other researchers [10, 11] developed a regression approach based on collected data sets. Based on the heat transfer approaches given in Solaimanian and Kennedy [12, 13], a simulation model was proposed to determine the pavement temperatures during the summer.
Between 1994 and 1997, two studies were conducted in two different regions by Al-Abdul Wahhab et al. [14, 15]. The first study was manually carried out in Saudi Arabia to measure pavement temperatures in various pavement sections. This study showed that the maximum pavement temperatures ranged from 3 to 72°C in arid environments and from 4 to 65°C in coastal areas. The second study was conducted for the entire Gulf area and suggested five performance graded binder zones. The study also recommended that the currently used asphalt binders should be modified to accommodate the proposed grade.
In 2005, Hassan et al. conducted an extensive two-year study in Oman to develop a temperature model for asphalt pavement [16]. In this study, a monitoring station was set up to measure air and road pavement temperatures. The collected data were analyzed, and a linear regression model was obtained to predict high and low pavement temperatures. Hassan et al. were further improved the above model [17], based on collecting more temperature databases. This study used the Oman model and compared it with the other two models to predict the asphalt binder Performance Grades (PGs) in Yemen because Oman and Yemen have a common border with each other. Therefore, the temperature in Oman is close to those in Yemen.
2.1. Temperature Grade
According to the SUPERPAVE system, the asphalt binder is determined based on the highest and lowest pavement design temperature, where the asphalt binder is expected to serve. The requirements of binder physical properties still the same, but the temperature differs from one binder to another at which the binders accomplish its properties with corresponding to the highest and lowest pavement design temperature. For instance, a binder graded as PG64-10 means that the binder should meet the desired properties, up to a maximum pavement temperature with a value of 64°C and a minimum pavement temperature with a value of -10°C
Table 1 represents the conventional binder grades as stipulated by SUPERPAVE specifications. The maximum temperature of 58°C has a similar low temperature of -16, -22, -28, -34-40°C resulting in PG58-16, PG58-22, PG58-28, PG58-34, and PG58-40. The performance grades are not limited to those provided in Table 1, and it is possible to obtain PG58-10.
| High-Temperature Grade °C | Low-Temperature Grade °C |
|---|---|
| PG46 | ˗34, -40, -46 |
| PG52 | -10, -16, -22, -28, -34, -40, -46 |
| PG58 | -16, -22, -28, -34, -40 |
| PG64 | -10, -16, -22, -28, -34, -40 |
| PG70 | -10, -16, -22, -28, -34, -40 |
| PG76 | -10, -16, -22, -28, -34 |
| PG82 | -10, -16, -22, -28, -34, -40 |
2.2. Selection of PG Based on Traffic Volume and Speed
The selection of asphalt binder in accordance with SUPERPAVE is based on an assumed traffic volume, including the design of the fast-transient load number. For different traffic conditions, the loading speed has supplemental effects on the pavement’s ability to withstand rutting (permanent deformation) under high-temperature conditions. Therefore, binder grades must increase with one grade for the high pavement temperature design, which is equal to 6 °C. One level shift is typically used for slow-moving, while two grades are used for standing design load conditions, as shown in Table 2.
For a very high number of heavy traffic loads, there is an additional shift. It is recommended that the design lane traffic is expected to exceed 10 million Equivalent Single Axle Load (ESAL), defined as an 18,000 pound (KN) four-tire dual axle. In addition, if the designed traffic is expected to be between (10-30) million ESAL, may consider shifting one high-temperature asphalt binder grade that is higher than the once selected based on climate condition. However, If the design traffic is expected to exceed 30 million ESAL, then the binder should be shifted with one grade higher [18]. Table 2 presents Super-pave high-temperature design grade adjustment specifications based on traffic and speed conditions.
3. RESEARCH METHODOLOGY
In order to achieve the objectives of this study and determine the asphalt binder PGs, several procedures were applied as follows:
(1) The air temperature data collected for this study covered approximately 10 years (2006-2015) for 19 Yemeni cities representing all the unique areas of Yemen. All stations are presented in Table 3. For every single station, the following parameters were extracted from the station's database to be used as preliminary data, the maximum daily temperature selected as the maximum temperature recording for 24 hours, the minimum daily temperature selected as the minimum temperature recording for 24 hours and the latitude for each of nineteen specific weather stations.
| Design ESALs (Million) |
Adjustment to Binder PG Grade | |||
|---|---|---|---|---|
| Traffic Load Rate | ||||
| Standing (Avg. Speed < 20 Km/hr |
Slow (Avg. Speed 20 to 70 Km/hr |
Standard (Avg. Speed › 70 km/hr | ||
| < 0.3 | - | - | - | |
| 0.3 to < 3 | 2 | 1 | - | |
| 3 to <10 | 2 | 1 | - | |
| 10 to < 30 | 2 | 1 | - | |
| > 30 | 2 | 1 | 1 | |
| Cities in Yemen | Max. Air Temperature (°C) | Min. Air Temperature (°C) | ||||
|---|---|---|---|---|---|---|
| Highest | Mean | St. dev. | Lowest | Mean | St. dev | |
| Sana'a | 28.4 | 27.05 | 1.05 | -1 | 0.91 | 1.04 |
| Amran | 28.4 | 26.39 | 1.28 | 1 | 1.97 | 0.74 |
| Dhale | 31.3 | 29.27 | 1.61 | 7.8 | 8.92 | 0.76 |
| Al Hudaydah | 40.3 | 39.1 | 0.96 | 20.1 | 21.29 | 0.84 |
| AL Jawf | 35.3 | 33.53 | 1.46 | 12.1 | 13.09 | 0.67 |
| AL Mahwit | 29.1 | 27.765 | 0.98 | 9.1 | 10.69 | 0.89 |
| Dhamar | 26.8 | 24.83 | 1.20 | -2.5 | 0.38 | 1.47 |
| Ibb | 30.4 | 28.62 | 1.20 | 3.5 | 6.35 | 2.02 |
| Ma’rib | 37.2 | 36.29 | 0.77 | 11.7 | 12.60 | 0.76 |
| Sadah | 30.1 | 28.56 | 0.82 | 5.9 | 7.12 | 1.12 |
| Taiz | 33.8 | 32.455 | 1.19 | 11.1 | 11.93 | 0.61 |
| Aden | 39.7 | 38.01 | 1.05 | 19.85 | 21.35 | 1.27 |
| Abyan | 37.7 | 37.08 | 0.67 | 19.6 | 20.44 | 0.83 |
| Al Mahrah | 37.8 | 37.05 | 0.51 | 20.1 | 21.20 | 0.89 |
| Hadhramaut | 38.7 | 37.97 | 0.57 | 21.9 | 22.70 | 0.63 |
| Socotra | 33.3 | 31.08 | 1.15 | 16.1 | 18.33 | 1.35 |
| Lahij | 39.2 | 38.17 | 0.78 | 20.9 | 22.12 | 0.84 |
| Shabwah | 38.5 | 37.195 | 0.54 | 21.3 | 22.39 | 0.79 |
| Hajjah | 31.3 | 30.17 | 0.70 | 4.3 | 6.26 | 0.91 |
(2) Yemen was divided into different climatic zones based on the highest and lowest pavement temperature. Nineteen cities across Yemen were chosen to be used in this paper. At each year of the study period (2006-2015), the hottest and lowest temperature is identified, and the average maximum air temperature for consecutive seven-days and the minimum air temperature for 1-day is calculated.
(3) After determining the maximum and minimum air temperature of each year, the mean and standard deviation were computed to determine the high and low temperature at 98% and 50% reliability level by using three models of SHARP, LTPP, and Oman model. Oman model was used due to the common border between Yemen and Oman. Therefore, the weather is almost the same . According to the SUPERPAVE, reliability can be defined as the percentage of probability in a single year when the actual temperature (minimum temperature of one day or high temperature of seven-days) will not exceed the degree of design temperature. Reliability with a higher percent means lower risk and mainly depends on traffic volume, binder cost as well as the functional class of the road. 98%-reliability must be used for heavy traffic, while 50% for summer.
(4) The temperature trends analyzed to determine whether temperature varies could be predicted.
(5) Use the hottest and coldest pavement temperatures to determine a reliable asphalt binder PG through a temperature change prediction model or statistical analysis.
(6) Showing the asphalt binder PGs maps of Yemen with the reliability of 50% and 98% based on the SHARP model.
(7) Proposed the most common asphalt binder grades (PGs) for Yemen
3.1. Analysis of Air Temperature Data
Firstly, the collected data from 19 cities were finalized to get a clear picture of temperature changes in every single city. After that, the maximum and minimum air temperatures collected were recorded in each city. The mean and standard deviation of the maximum and minimum temperatures in each city for different years were also recorded, as presented in Table 3. The highest temperature varies between 26.8°C and 40.3°C, while the lowest temperature varies between -2.5°C and 21.9 °C
3.1.1. Average 7-days Maximum and Minimum Temperature
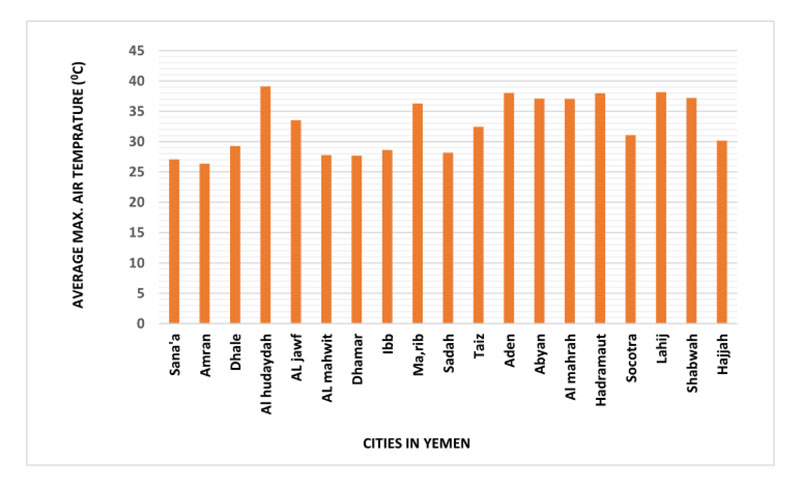
In this paper, the average 7-days maximum temperature and minimum temperature in 19 regions of Yemen during 10 years period from 2006 to 2015 were filtered from the collected temperature database. Fig. (1) shows the average 7-days maximum air temperatures during the summertime of 19 cities in Yemen over the past 10 years, the highest temperature was 39.1°C in Al Hudaydah city, and the lowest temperature was 26.39°C in Amran city.
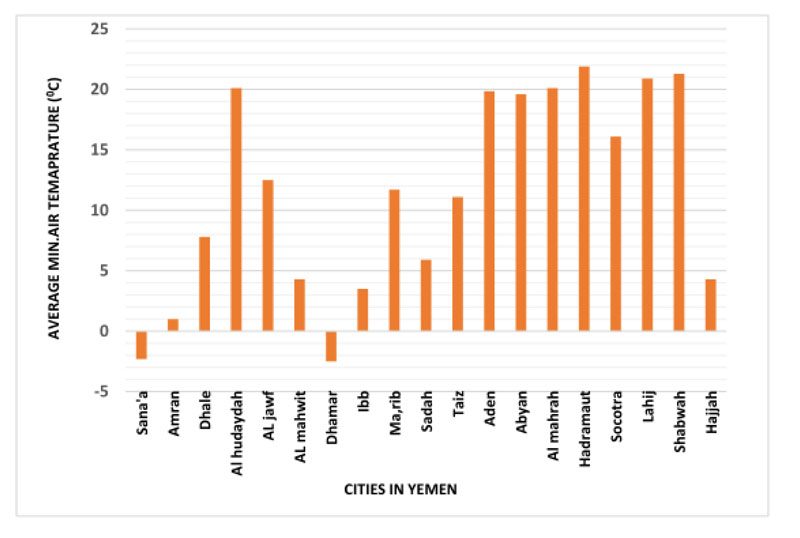
The average minimum air temperature for most of the cities in Yemen in the past 10 years was shown in Fig. (2); only two cities (Dhamar and Sana’a) hit the lowest temperature of -2.5°C, and -1°C, respectively, while the highest of 21.9°C in Hadhramaut. As indicated in Figs. (1 and 2), the results show that it is warm in the cities located along the coastline plus some cities in the highland plateau, and it is cold in the mountain highlands region. The temperature difference between the minimum and maximum is about 13.5°C during summertime and 24.4°C during wintertime. This large seasonal temperature difference in winter indicates that different asphalt binder for low temperature cracking resistance levels used, if the low temperature falls below zero degrees, but if the value ranged between -2.5°C and 21.9°C, for Yemeni region, the predicted min pavement temperature is much higher than the min required for a PG grade, therefore, the low temperature implemented for all PG grade is -10°C.
3.1.2. Trend Analysis of Temperature Variation
Fig. (3) shows the temperature variations of Al Hudaydah and Amran. The two cities reach the average maximum and minimum air temperatures, respectively, in summer. The linear regression analysis of the overall temperature trend showed that the average temperature of Al Hudaydah increased by 0.04°C and Amran decreases by -0.13°C each year. Fig (4) shows the temperature variations in Dhamar and Hadhramaut, in which two cities reach the average maximum and minimum air temperatures, respectively, in winter. According to the results of linear regression analysis, it can be found that the annual average temperature of Dhamar increases by 0.22°C and Hadhramaut decreases 0.06°C.
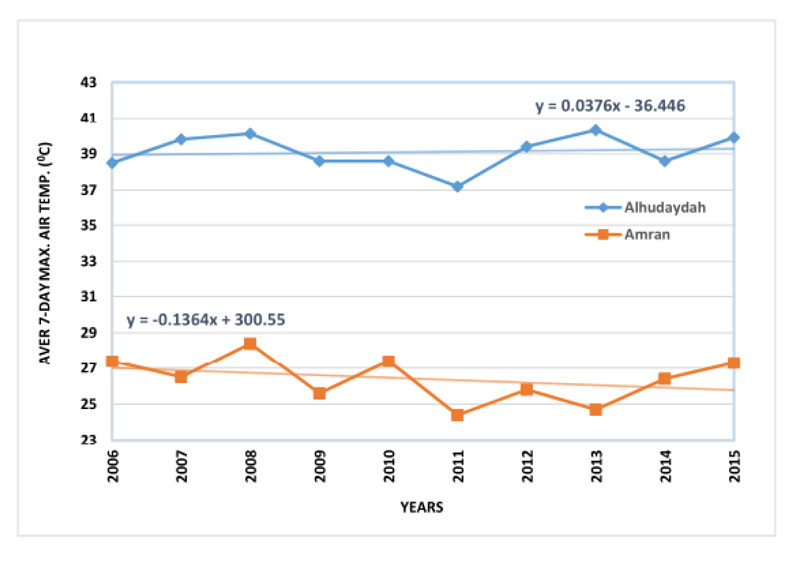
The linear regression models of average 7-days maximum and minimum air temperature vary, as shown in Figs. (3 and 4), while the linear trends of remaining cities also vary are illustrated in Figs. (5 and 6) to verify the average maximum and minimum air temperature increases or decreases during the past 10 years by the value of -0.03 and 0.07, respectively. It is observed that during the summer, Aden experienced the largest increase in the average 7-days maximum temperature, while in Dhamar, the temperatures tended to drop. In winter, Sana’a and Ibb experienced the largest drop and increment, respectively, in the minimum air temperature, as shown in Figs. (5 and 6).
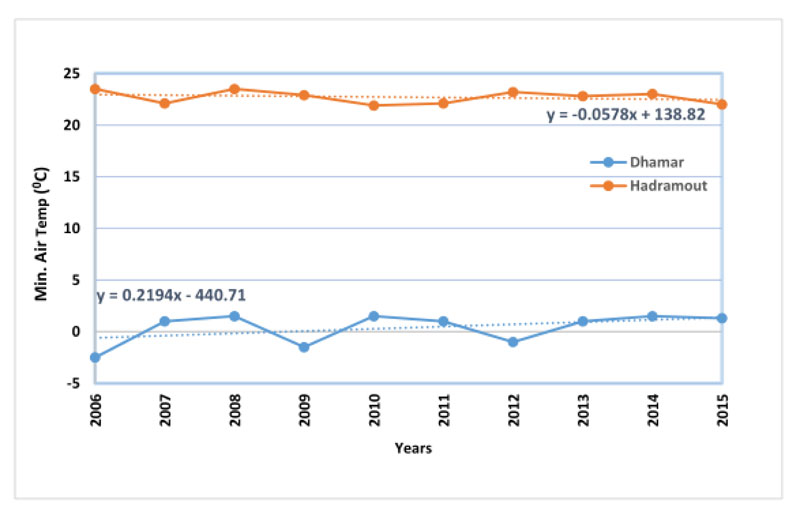
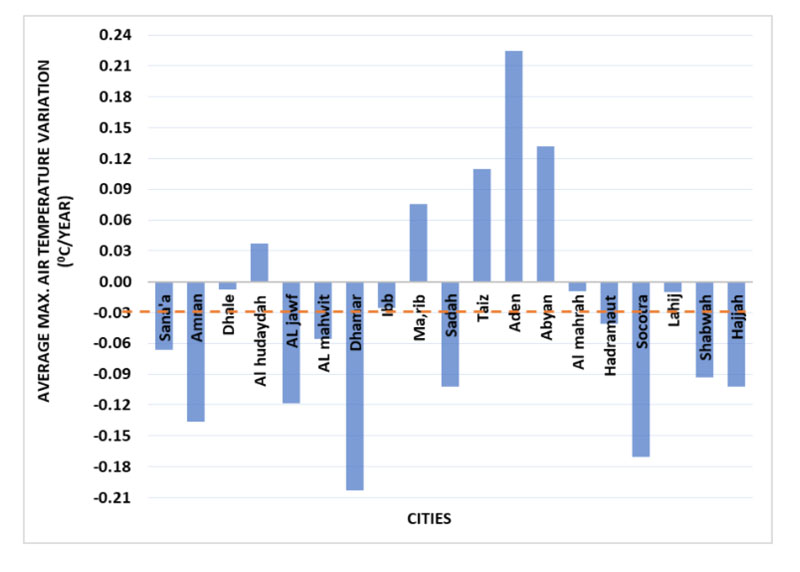
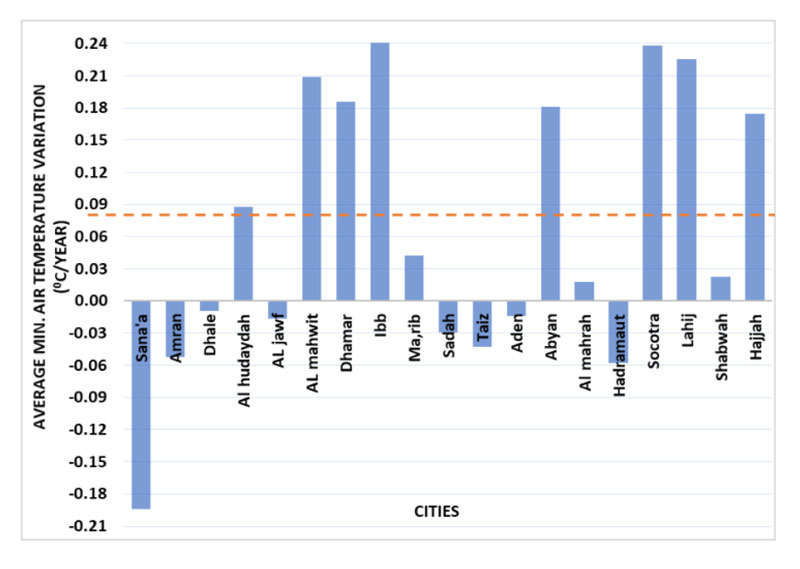
As shown in Fig. (3) through Fig. (6), Yemenis’ seasonal maximum and minimum air temperatures over the past 10 years have fluctuated unpredictably, rising and falling repeatedly, which makes it difficult to develop a regression analysis formula and then predict the future pavement temperature. Therefore, it is considered to use the mean and standard deviations of air temperature in the past for Yemen to predict air temperature using statistical reliability techniques.
3.2. Prediction of Pavement Temperature
Several models and algorithms could be used to compute the high temperature of pavement at any depth [17]. In this paper, the common depth of 20 mm beneath the pavement surface is computed for the high pavement temperature, while the low pavement temperature is computed at the pavement surface. The Superpave asphalt performance grade is determined based on actual asphalt pavement temperatures. Most countries have determined such models based on the air and pavement temperature. These models are used for asphalt mix design. Since it is difficult to gather the actual pavement temperatures from field surveys at specific locations in Yemen, this study utilized relationship equations for countries with a similar climate to Yemen, such as Oman, besides SHARP and LTPP models.
3.2.1. Air-pavement Temperature based on SHARP and LTPP Model
The relationship equations between the highest pavement temperature at 20 mm depth below the pavement surface and the average 7-days maximum air temperature using SHARP Superpave and LTPP system is shown as in Eq. (1) and Eq. (2), respectively. It is found that the relationship between air and pavement temperature varies by the latitude, as presented in Eq. (1).
 |
(1) |
 |
(2) |
Where
T20mm = High pavement temperature at a depth of 20 mm,°C
Tair = the highest average air temperature of 7-days,°C
Lat = the weather station’s latitude in degree
Tpav = Hight pavement temperature at depth H from the surface,°C
H = Pavement depth from the surface, mm
While the minimum pavement design temperature on the asphalt pavement surface is equal to the one-day low air temperature because the air temperature is approximately the same as the pavement surface temperature. Eq. (3) and (4) present the model established under the SHARP and LTPP program, respectively.
 |
(3) |
 |
(4) |
Where
Tmin = Minimum pavement temperature,°C
Tair = the low air temperature,°C
Lat = the weather station’s latitude in degree
H = Pavement depth from the surface, mm
3.2.2. Air-pavement Temperature Based on Oman Model
Oman model was firstly developed [16] and further enhanced [19] after gathering more weather data. The final Oman model for the high and the low pavement temperature is expressed, as shown in Eqs. (5) and (6), respectively.
 |
(5) |
 |
(6) |
Where
T20mm = High pavement temperature at a depth of 20mm,°C
Tmin = Minimum pavement temperature,°C
Tair = the highest average air temperature of 7-days,°C
3.3 Comparison of three prediction models
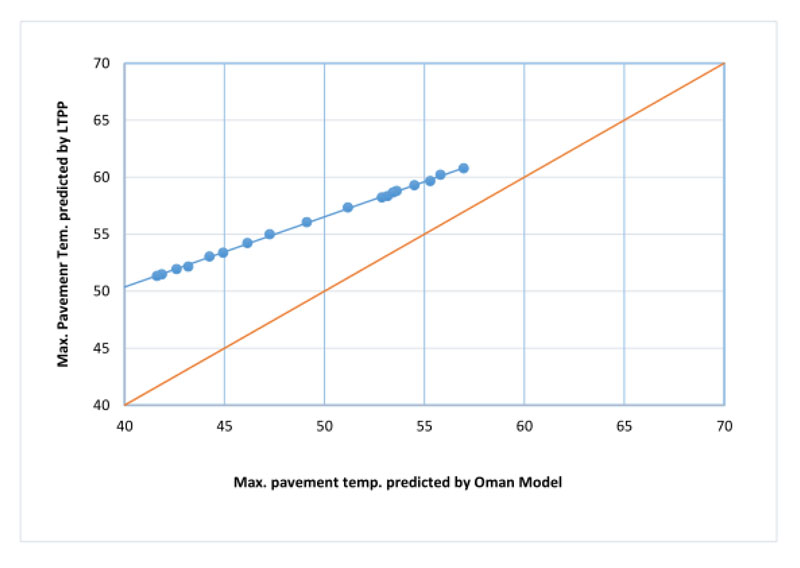
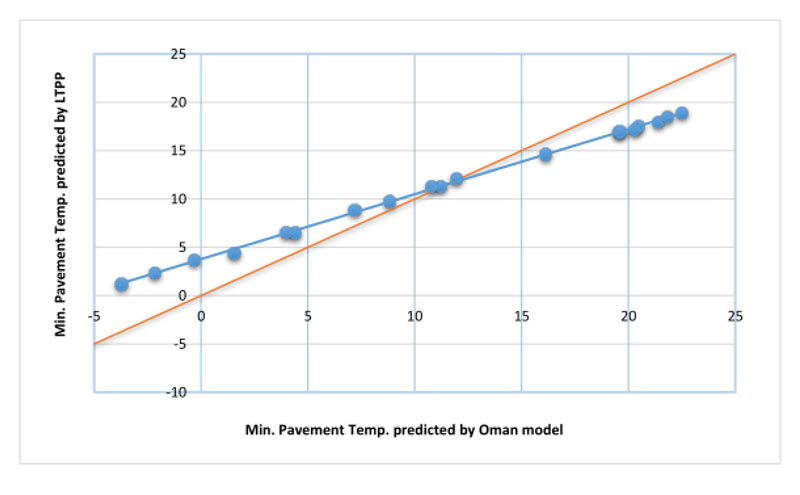
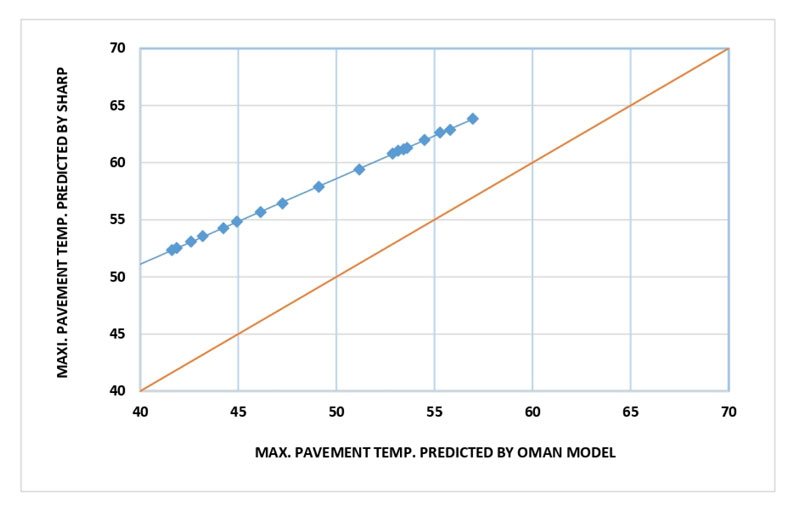
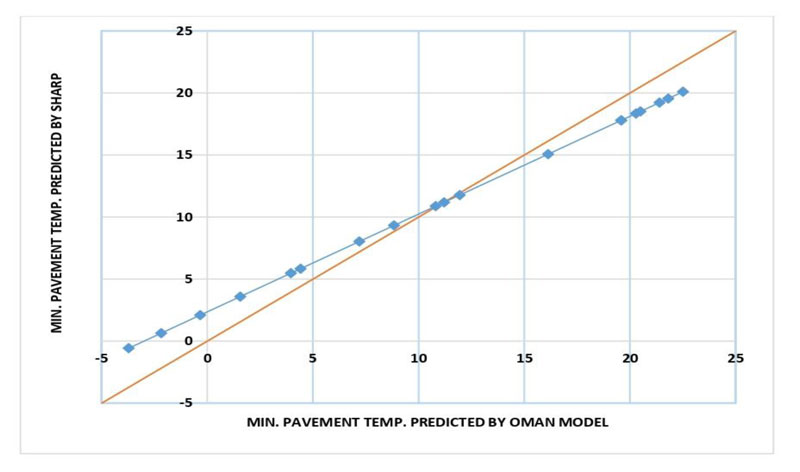
As illustrated in Fig. (7) through Fig. (10), the Oman relationship model was graphically compared with other models of LTPP and SHARP in terms of the average 7-days maximum and minimum pavement temperatures using the equality lines. The three models were used to compare the maximum and minimum pavement temperatures of 19 cities in Yemen over the past 10 years.
By comparing the three models, the Oman model is in good agreement with the maximum pavement temperature of SHARP and LTPP models, indicating that the pavement temperature obtained by Oman model is lower than that obtained by SHARP and LTPP models. The reason behind the large difference in pavement high temperature could be due to the poor fitting quality of Oman model. However, the maximum pavement temperature obtained using SHARP's equations exhibited slightly higher values compared with that obtained using LTPP's equations, as shown in Figs. (7 and 9). On the other hand, for the minimum temperature, there is no good fit and the graph shows large variations between Oman model and the other two models of SHARP and LTPP, as presented in Figs. (8 and 10). In this paper, the SHARP’s model was adopted to compute the pavement temperatures of the asphalt binder performance level in Yemen, due to the fact that, this model used the dependent variable of latitude that can better reflect the geographical locations of the Yemeni region rather than other models.
4. RESULTS AND DISCUSSION
4.1. Temperature Zoning for Developing PG Map
4.1.1. Reliability Analysis Approach
In this paper, the use of the maximum and minimum air temperatures attributes to the mean of the average 7-days maximum temperature and the mean of the minimum temperature, respectively, recorded at each weather station. These two means were computed from (n) observations obtained in the (n) years at each station, as presented in Table 4 under the reliability level of 50%. The reliability level of 95% and 98% for the max and min air temperature was calculated based on the standard deviations for the reliability of 50%. In detail, the max temperature at the reliability of 95% is determined as the combination of the mean temperature at the reliability of 50% plus 1.65 multiply by the standard deviation. At the same time, the max temperature at the reliability of 98% is calculated as the combination of the mean temperature at the reliability of 50%, adding 2.055 multiply by the standard deviation. On the other hand, the min temperatures at the reliability of 95% and 98% were calculated in the same way, except that reduction is made from the mean temperature rather than by addition at the reliability of 50%.
The asphalt binder PGs were computed based on the two-reliability level of 50% and 98% considered in this study rather than using the reliability of 95% since the values of 95% and 98% reliability levels were almost the same. PGs with 50% reliability is much chapter than those of 98% reliability, but it is more likely prone to temperature-causing pavement damage. Based on the pavement design method of the Superpave implemented by most states in the US. Through using the cost-benefit analysis, the asphalt binder PGs were determined with the reliability of 98%. However, due to the economic situation in Yemen, PGs with the reliability of 50% might be used in the low-traffic volume road.
4.1.2. Air Temperature Reliability Analysis Results
The analysis results of 50% and 98% reliability at the average of 7-days maximum and minimum air temperatures are shown in Table 4. The asphalt pavement temperatures were determined by converting the average 7-days max and min air temperature using the above mentioned three models (Eqs. 1 to 6) and discussed earlier in the “Prediction of Pavement Temperature” section, then the obtained results presented in Table 5.
4.1.3. Analysis Result of 50% and 98% Reliability
Table 6 shows a comparison of the asphalt binder grades PGs computed by using three models of SHARP, LTTP, and Oman model of average 7-day maximum and minimum pavement temperatures for the specified cities in Yemen at 50%, and 98% reliability.
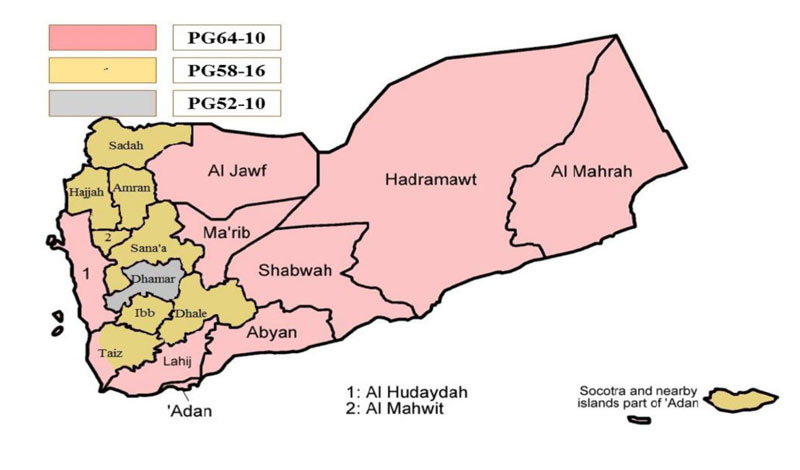
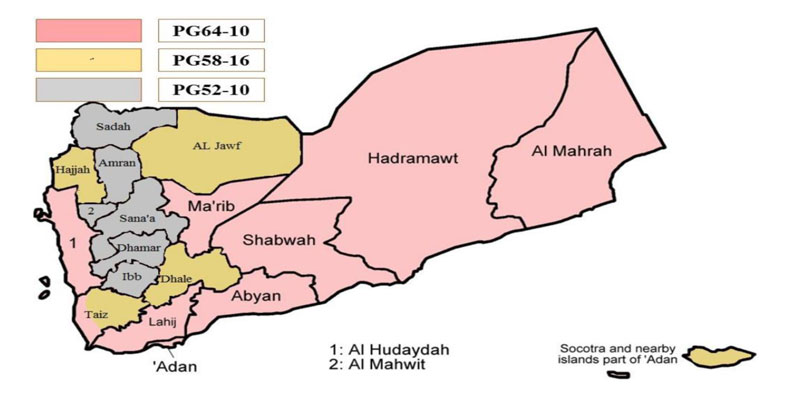
The results obtained from the SHARP and LTPP model at 50% reliability analysis indicated that the Yemeni region requires three different asphalt binder PGs: PG52-10 (1), PG58-16 (2), and PG 64-10(3), as well as Oman model, requires three different asphalt binder PGs. The 98% reliability analysis results were also similar to those of the 50% reliability analysis, which indicated that the Yemeni region requires three different PGs. However, the pavement temperatures predicted by the SHARP model were relatively higher than those predicted by the other models, especially for maximum pavement temperatures. Moreover, the results showed that the Oman model has a lower pavement temperature than SHARP and LTPP models. The reason for the large difference in high temperatures can be attributed to the low quality of fit of the Oman model. Due to that, the dependent variables of latitude in the Superpave equation can more reflect the geographical locations of Yemeni regions rather than the other models. The SHARP model found out to be more practical than other models from the perspective of the required binder PGs in Yemen. The findings of this study are consistent with those of the other overseas studies. Hassan et al. [ 19 ] and Balushi et al. [ 20 ] tested the SHARP and LTPP models against actual measurements of air and pavement temperatures and concluded that the LTPP model produced closer results to actual temperatures; the authors believe that the LTPP and SHARP models would be more appropriate to be used while the Oman model showed the least quality.
4.1.4. Proposed PG Map
In order to prevent pavement damage due to seasonal temperature variations (which may expose the pavement), the asphalt binder PGs determined through statistical reliability analysis [21].
As shown in Figs. (11 and 12), the asphalt binder PGs map of the Yemeni region was derived from the SHARP model, with a reliability level of 50%, and 98%, respectively. In this study, the most common PGs recommended for low volume roads and heavy traffic volume at 50% and 98% reliability level, respectively, are PG52-10, PG58-16, and PG64-10 (Table 6).
4.2. Traffic Speed and Loading Effect in the Selection of Performance Grade
Table 7 shows the selected PGs that should be shifted up using the SHARP model with a 98% reliability level after traffic adjustments for the asphalt binder grades in accordance with traffic speed and loading rate. For example, PG with slow traffic speed should be shifted with one grade from the selected performance grade.
| Cities in Yemen | Lat. | 7-days Max Air Temperature (°C) | Min Air Temperature (°C) | ||||||
|---|---|---|---|---|---|---|---|---|---|
| Reliability | Reliability | ||||||||
| 50% | 95% | 98% | 50% | 95% | 98% | ||||
| Mean | St. dev | Mean | Mean | Mean | St. dev | Mean | Mean | ||
| Sana'a | 15.35 | 27.05 | 1.05 | 28.78 | 29.21 | 0.91 | 1.04 | -0.81 | -1.24 |
| Amran | 15.25 | 26.39 | 1.28 | 28.50 | 29.02 | 1.97 | 0.74 | 0.75 | 0.45 |
| Dhale | 13.70 | 29.27 | 1.61 | 31.92 | 32.57 | 8.92 | 0.76 | 7.67 | 7.36 |
| Al Hudaydah | 14.80 | 39.10 | 0.96 | 40.69 | 41.08 | 21.29 | 0.84 | 19.91 | 19.57 |
| AL Jawf | 13.10 | 33.53 | 1.46 | 35.94 | 36.53 | 13.09 | 0.67 | 11.99 | 11.72 |
| AL Mahwit | 15.28 | 27.77 | 0.98 | 29.39 | 29.78 | 10.69 | 0.89 | 9.23 | 8.87 |
| Dhamar | 14.55 | 24.83 | 1.20 | 26.81 | 27.30 | 0.38 | 1.47 | -2.05 | -2.64 |
| Ibb | 13.97 | 28.62 | 1.20 | 30.60 | 31.08 | 6.35 | 2.02 | 3.01 | 2.19 |
| Ma’rib | 15.46 | 36.29 | 0.77 | 37.55 | 37.87 | 12.60 | 0.76 | 11.35 | 11.04 |
| Sadah | 16.93 | 28.56 | 0.82 | 29.92 | 30.25 | 7.12 | 1.12 | 5.27 | 4.81 |
| Taiz | 13.58 | 32.46 | 1.19 | 34.43 | 34.91 | 11.93 | 0.61 | 10.92 | 10.67 |
| Aden | 12.81 | 38.01 | 1.05 | 39.75 | 40.17 | 21.35 | 1.27 | 19.25 | 18.73 |
| Abyan | 13.88 | 37.08 | 0.67 | 38.18 | 38.45 | 20.44 | 0.83 | 19.07 | 18.73 |
| Al Mahrah | 16.21 | 37.05 | 0.51 | 37.88 | 38.09 | 21.20 | 0.89 | 19.73 | 19.37 |
| Hadhramaut | 14.53 | 37.97 | 0.57 | 38.91 | 39.14 | 22.70 | 0.63 | 21.67 | 21.41 |
| Socotra | 12.47 | 31.08 | 1.15 | 32.98 | 33.45 | 18.33 | 1.35 | 16.10 | 15.56 |
| Lahij | 16.12 | 38.17 | 0.78 | 39.45 | 39.77 | 22.12 | 0.84 | 20.73 | 20.39 |
| Shabwah | 14.32 | 37.20 | 0.54 | 38.09 | 38.30 | 22.39 | 0.79 | 21.09 | 20.78 |
| Hajjah | 15.25 | 30.17 | 0.70 | 31.33 | 31.62 | 6.26 | 0.91 | 4.76 | 4.39 |
| Cities in Yemen | LTTP Model | SHARP Model | Oman Model | |||||||||
|---|---|---|---|---|---|---|---|---|---|---|---|---|
| Reliability of 50% |
Reliability of 98% |
Reliability of 50% |
Reliability of 98% |
Reliability of 50% |
Reliability of 98% |
|||||||
| Max | Min | Max | Min | Max | Min | Max | Min | Max | Min | Max | Min | |
| Sana'a | 49.80 | 8.50 | 51.48 | 2.38 | 50.47 | 2.48 | 52.53 | 0.64 | 39.13 | 0.16 | 41.87 | -2.18 |
| Amran | 49.29 | 9.28 | 51.34 | 3.74 | 49.84 | 3.39 | 52.35 | 2.09 | 38.29 | 1.32 | 41.63 | -0.33 |
| Dhale | 51.65 | 14.46 | 54.23 | 8.89 | 52.52 | 9.36 | 55.67 | 8.03 | 41.95 | 8.89 | 46.15 | 7.20 |
| Al Hudaydah | 59.24 | 23.24 | 60.79 | 17.51 | 61.95 | 19.99 | 63.85 | 18.51 | 54.44 | 22.38 | 56.96 | 20.50 |
| Al Jawf | 55.01 | 17.53 | 57.35 | 12.12 | 56.55 | 12.94 | 59.41 | 11.77 | 47.36 | 13.44 | 51.17 | 11.95 |
| Al Mahwit | 50.36 | 15.55 | 51.94 | 9.74 | 51.15 | 10.88 | 53.08 | 9.32 | 40.04 | 10.82 | 42.60 | 8.84 |
| Dhamar | 48.13 | 8.22 | 50.05 | 1.21 | 48.32 | 2.03 | 50.68 | -0.57 | 36.30 | -0.41 | 39.44 | -3.71 |
| Ibb | 51.13 | 12.58 | 53.05 | 4.34 | 51.91 | 7.15 | 54.26 | 3.58 | 41.12 | 6.09 | 44.25 | 1.56 |
| Ma’rib | 57.00 | 16.91 | 58.23 | 11.33 | 59.30 | 12.52 | 60.80 | 11.18 | 50.87 | 12.91 | 52.87 | 11.21 |
| Sadah | 50.85 | 12.77 | 52.17 | 6.49 | 51.96 | 7.82 | 53.57 | 5.83 | 41.05 | 6.93 | 43.19 | 4.42 |
| Taiz | 54.14 | 16.64 | 56.06 | 11.33 | 55.55 | 11.95 | 57.89 | 10.87 | 46.00 | 12.17 | 49.12 | 10.81 |
| Aden | 58.53 | 23.50 | 60.22 | 16.92 | 60.80 | 20.04 | 62.87 | 17.79 | 53.06 | 22.44 | 55.81 | 19.59 |
| Abyan | 57.73 | 22.74 | 58.80 | 17.02 | 59.98 | 19.26 | 61.29 | 17.79 | 51.87 | 21.45 | 53.62 | 19.59 |
| Al Mahrah | 57.53 | 23.00 | 58.34 | 17.18 | 60.05 | 19.91 | 61.04 | 18.34 | 51.84 | 22.28 | 53.16 | 20.28 |
| Hadhramaut | 58.38 | 24.29 | 59.30 | 18.95 | 60.86 | 21.20 | 61.98 | 20.10 | 53.01 | 23.92 | 54.50 | 22.51 |
| Socotra | 53.14 | 21.36 | 54.99 | 14.62 | 54.16 | 17.45 | 56.43 | 15.06 | 44.25 | 19.15 | 47.26 | 16.13 |
| Lahij | 58.41 | 23.68 | 59.66 | 17.94 | 61.11 | 20.70 | 62.64 | 19.21 | 53.26 | 23.28 | 55.29 | 21.40 |
| Shabwah | 57.79 | 24.09 | 58.66 | 18.46 | 60.11 | 20.93 | 61.17 | 19.55 | 52.02 | 23.58 | 53.43 | 21.82 |
| Hajjah | 52.24 | 12.37 | 53.37 | 6.50 | 53.45 | 7.08 | 54.83 | 5.47 | 43.09 | 5.99 | 44.93 | 3.96 |
| Cities in Yemen | Selected PG Binder Grade | |||||
|---|---|---|---|---|---|---|
| LTTP | SHARP | Oman Model | ||||
| 50% Reliability |
98% Reliability | 50% Reliability | 98% Reliability | 50% Reliability | 98% Reliability | |
| Sana'a | PG52-10 | PG52-10 | PG52-10 | PG58-16 | PG46-10 | PG46-10 |
| Amran | PG52-10 | PG52-10 | PG52-10 | PG58-16 | PG46-10 | PG46-10 |
| Dhale | PG52-10 | PG58-16 | PG58-16 | PG58-16 | PG46-10 | PG52-10 |
| Al Hudaydah | PG64-10 | PG64-10 | PG64-10 | PG64-10 | PG58-16 | PG58-16 |
| AL Jawf | PG58-16 | PG58-16 | PG58-16 | PG64-10 | PG52-10 | PG52-10 |
| AL Mahwit | PG52-10 | PG52-10 | PG52-10 | PG58-16 | PG46-10 | PG46-10 |
| Dhamar | PG52-10 | PG52-10 | PG52-10 | PG52-10 | PG46-10 | PG46-10 |
| Ibb | PG52-10 | PG58-16 | PG52-10 | PG58-16 | PG46-10 | PG46-10 |
| Ma’rib | PG58-16 | PG64-10 | PG64-10 | PG64-10 | PG52-10 | PG58-16 |
| Sadah | PG52-10 | PG58-16 | PG52-10 | PG58-16 | PG46-10 | PG46-10 |
| Taiz | PG58-16 | PG58-16 | PG58-16 | PG58-16 | PG46-10 | PG52-10 |
| Aden | PG64-10 | PG64-10 | PG64-10 | PG64-10 | PG58-16 | PG58-16 |
| Abyan | PG58-16 | PG64-10 | PG64-10 | PG64-10 | PG52-10 | PG58-16 |
| Al Mahrah | PG58-16 | PG64-10 | PG64-10 | PG64-10 | PG52-10 | PG58-16 |
| Hadhramaut | PG64-10 | PG64-10 | PG64-10 | PG64-10 | PG58-16 | PG58-16 |
| Socotra | PG58-16 | PG58-16 | PG58-16 | PG58-16 | PG46-10 | PG52-10 |
| Lahij | PG64-10 | PG64-10 | PG64-10 | PG64-10 | PG58-16 | PG58-16 |
| Shabwah | PG58-16 | PG64-10 | PG64-10 | PG64-10 | PG58-16 | PG58-16 |
| Hajjah | PG58-16 | PG58-16 | PG58-16 | PG58-16 | PG46-10 | PG46-10 |
| Selected PGs | Design ESALs (Million) | Adjustment to Binder PG Grade | ||
|---|---|---|---|---|
| Traffic Load Rate | ||||
| Standing | Slow | Standard | ||
| 52-10 | < 0.3 | 52-10 | 52-10 | 52-10 |
| 0.3 to < 3 | 64-10 | 58-10 | 52-10 | |
| 3 to <10 | 64-10 | 58-10 | 52-10 | |
| 10 to < 30 | 64-10 | 58-10 | 52-10 | |
| > 30 | 64-10 | 58-10 | 58-10 | |
| 58-16 | < 0.3 | 58-16 | 58-16 | 58-16 |
| 0.3 to < 3 | 70-16 | 64-16 | 58-16 | |
| 3 to <10 | 70-16 | 64-16 | 58-16 | |
| 10 to < 30 | 70-16 | 64-16 | 58-16 | |
| > 30 | 70-16 | 64-16 | 64-16 | |
| 64-10 | < 0.3 | 64-10 | 64-10 | 64-10 |
| 0.3 to < 3 | 76-10 | 70-10 | 64-10 | |
| 3 to <10 | 76-10 | 70-10 | 64-10 | |
| 10 to < 30 | 76-10 | 70-10 | 64-10 | |
| > 30 | 76-10 | 70-10 | 70-10 | |
CONCLUSION
The main objective of this paper is to determine the asphalt binder PGs for the Yemeni region based on comprehensive collected data of the existing meteorological weather stations. These data were analyzed according to the model developed under three models of SHARP and LTPP and Oman. The findings of this study are summarized, which can be used as the fundamental implementations for the asphalt pavement mix design in Yemeni roads.
- Compared with other LTPP and Oman models, the SHARP Superpave model is considered to be more practical and accurate in predicting air pavement temperatures in Yemen.
- The performance grade (PG) in Yemen's regions can be divided into three asphalt grades according to the SHARP at 50% and 98% of reliability level, namely, PG64-10(1), PG58-16(2), and PG52-10(3).
- The most common performance grades proposed in this study are PG64-10 and PG52-10, which cover most cities in Yemen.
- In different cases such as standing, slow, or standard speed, the selected performance grade asphalt binder shifted up by one or two grades based on the traffic volume.
The findings of this study are highly significant and provide valuable decision support for pavement management and the development of local transportation system sustainability and social-economic improvements. This research can become more helpful and interesting if further research would be considered with more stations to be installed in different areas of the country which could enhance the developed models. Field validation of the proposed binder grades would also be recommended.
LIST OF ABBREVIATIONS
| PGs | = Performance Grades |
| UNESCAP | = United Nations Economic and Social Commission for Asia and the Pacific |
| SHARP | = Highway Strategy Research Program |
| LTPP | = Long-Term Pavement Monitoring Program |
| SMP | = Seasonal Monitoring Program |
| ESAL | = Equivalent Single Axle Load |
CONSENT FOR PUBLICATION
Not applicable.
AVAILABILITY OF DATA AND MATERIALS
The data that support the findings of this study are available from the corresponding author, [M.A], upon request.
FUNDING
None.
CONFLICT OF INTEREST
The authors declare no conflict of interest, financial or otherwise.
ACKNOWLEDGEMENTS
Declared none.


