All published articles of this journal are available on ScienceDirect.
Risk Factors Affecting the Performance of Construction Projects in Gaza Strip
Abstract
Background:
The construction industry is generally associated with a high level of risk and ambiguity because of the nature of its working contexts. In the Gaza Strip, construction projects are among the riskiest projects, which require the application of the right rules and adherence to the proper management standards. Identification of these risks is the first step in risk management.
Aims:
This study aims to investigate and understand the main risks faced by the construction projects in the Gaza strip.
Methods:
A questionnaire survey was conducted to achieve the study aim, whose applicability was tested through a pilot study. Using targeted participants from engineering offices and consulting engineering companies, 70 questionnaires were distributed and collected with a response rate of 85.71%. The Quantitative method was used for data analysis using SPSS. 38 risk factor statements were considered from the seven clusters of risk factors.
Results:
The results show that the political risk factor was determined to be the highest with a Relative Important Index (RII) of 75.47%, while the design factor was the least factor with an average RII of 61.89%.
Conclusion:
It is recommended that companies should appoint a specialist in the field of risk management.
1. INTRODUCTION
Risk is defined as the probability of a damaging event occurring in a project, thereby affecting its objectives [1-3] and is often associated with negative outcomes. Today, risk management is an important part of project management [4, 5]. One of the most important activities in project risk management is determining the project’s risks and how they should be prioritized [6-8]. Risk management is defined as the process of identifying and evaluating risk, and the application of methods that can be used to reduce the risk to an acceptable level [9, 10]. Therefore, the key purpose of project risk management is to identify, evaluate and control risk to ensure the success of the project [11-13]. Generally, risk management process includes these key steps: (1) Risk planning; (2) Risk identification; (3) Risk evaluation (quantitative and qualitative); (4) Risk analysis; (5) Risk response; (6) Risk monitoring, and (7) Recording the risk management process [2].
Risk identification is the process of identifying and documenting risks. This is an important process, as the risks that have not been identified may not be manageable [14]. Risk identification is often executed by professionals selected within the project, usually in collaboration with outside experts along with the use of risk matrix, checklists methods or other approaches of information collection.
Risk evaluation is aimed at quantifying the effects of the identified risks and determining the probability of occurrence of such risks [15]. As stated by Mills [16], greater risk demands a more elaborate response. This response may be through one or more of the following: avoiding it, reducing it, transferring it or absorbing it.
Risk management has arguably been in existence since 3200 BC [17]. Risk has been defined as the consequence of uncertainty that leads to the occurrence of events that may affect the project objectives negatively or favorably; while uncertainty is used to represent the probability or chance of an event occurring [17]. Uncertainty and incomplete or unknown information are usually the reasons that risks are present in construction projects [18, 19].
Research on risk management has been carried out by many researchers focusing on different methods and case studies and achieving different outcomes. A summary of some relevant research reviewed is presented in Table 1. Some authors and experts disparaged previous risk management research efforts due to too much emphasis they laid on techniques and tools. Nevertheless, in developing countries, such criticisms may not have much impact as risk management is still a new area under investigation. From the literature analysis, it is obvious that the researchers prefer the survey approach and basic metadata statistics for data collection and data analysis respectively. The questionnaire survey approach is the most practical way to gather records that can be subjected to quantitative analysis, which might also explain its popularity. Furthermore, these survey techniques grant respondents with increased ease and comfort, mainly when they are self-sufficient, which can lead to higher response levels. However, Martin (2004) used relatively complex analytical methods such as analytical pyramid analysis [20]. Regarding data sampling, the approach appears to be turning towards testing sampling, although many also use some other type of random sampling. Random sampling is usually considered a more dependable method for homogenous populations.
| Authors and Year | Study Location | Sample Size/ Type | Methodology | Factors Studied |
|---|---|---|---|---|
| Iqbal R. M. Choudhry, K. Holschemacher, A. Ali, and J. Tamosaitiene (2015) [21] | Pakistan | 86 Construction professionals (Convenience sampling) |
Data Collection: Questionnaire Survey (Likert scale) Analysis: Percentage scores |
Risk perception Risk ownership Risk management techniques |
| Salawu and Abdullah (2015) [22] | Nigeria (South West) |
25 Road maintenance contractors (Convenience sampling) |
Data Collection: Questionnaire Survey (4 point ranking) Analysis: Fuzzy synthetic evaluation |
Risk management maturity in road maintenance projects |
| Otali and Odesola (2014) [23] | Nigeria (Niger Delta) |
260 Consultants Contractors (Purposive sampling) |
Data Collection: Questionnaire Survey (Likert scale) Analysis: Simple percentage Mean score/ Correlation |
Use of contingency sums in construction projects risk management |
| Tadayon, Jaafar and Nasri (2012) [24] | Iran | 43 Professionals and contractors (foreign and Local) (Convenience sampling) |
Data Collection: Questionnaire Survey (Likert scale) Analysis: Statistical mean |
Risk identification method/ process Risk perception Risk drivers Team members roles Method for improving risk management |
| Lyons and Skitmore (2004) [20] | Queensland, Australia | 44 Owners Developers Consultants (Random sampling) |
Data Collection: Questionnaire Survey (Likert scale) Analysis: Weighted Average Score ANOVA |
Risk management usage Responsibility for risk planning, Tools and Techniques used |
| Chileshe and Yirenkyi-Fianko (2012) [25] | Ghana (Greater Accra Region) |
103 Professionals and contractors (foreign and Local) (Random sampling) |
Data Collection: Questionnaire Survey (Likert scale) Analysis: Analysis of variance (ANOVA) |
Perceived risks probability and impact on construction projects |
| Chileshe and Kikwasi (2014) [26] | Tanzania | 67 Professionals and contractors (foreign and Local) (Convenience sampling) |
Data Collection: Questionnaire Survey (Likert scale) Analysis: Ranking Analysis Spearman rank correlation Analysis of variance (ANOVA) |
Perception of CSFs in risk analysis and management practices (RAMP) |
| Adeleke, et al. (2018) [27] | Nigeria | 238 employees of construction companies |
Data Collection: Questionnaire Survey (Likert scale) Analysis: Partial least squares structural equation modeling |
Organizational external factors and rules and regulations on construction risk management |
Project risks were classified differently in previous literature. Most often, the authors classified the risks based on their sources. For example, they classified the risk based on two basic types: natural and human. The human category contains different sub-categories such as political, economic, social, cultural, legal and financial risks while the natural hazards include risk categories related to geological and weather conditions. On the other hand, another classification is based on two main groups: operational and strategic risks. Operational risks entail systems, personnel, procedures and external events while strategic refers to the economic, political, legislative, social, technological, financial, and other risks related to the performance of the organization. Despite the diversity of the risks, the following are brief descriptions of the various major risk categories from which the risk factors were derived in this study [25].
(1) Political Risks: This refers to the unstable political terrain and change of policies in government.
(2) Economic Risks: These are factors linked with major economic indicators; for example, exchange rate, inflation rate and others that may lead to fluctuations that can affect construction materials price and change of cost.
(3) Financial Risks: This relates to factors such as funding and other aspects that may affect the project’s profitability.
(4) Technical Risk: Changes of specifications, planning, design, technology and materials.
(5) Organizational Risks: This pertains to aspects such as quality of project team organization, expertise, the experience of team members, and management of the project.
(6) Performance Risks: The differences between actual cost and projected/expected cost, quality and schedules of project performance.
(7) Environmental Risks: Uncertainties relating to the surrounding conditions of the construction site, the unexpected environmental impact of project or vice versa.
(8) Legal Risks: These relate to legal disputes, breaches of contract and restrictions of laws.
(9) Health, Safety and Security Risks: Injuries of individuals or equipment, theft, and other accidents.
(10) Force Majeure: These refer to situations and circumstances beyond human control.
The construction project is one of the most dangerous and risky fields of work where it is surrounded by many uncertainties (internal and external factors) that require management to handle such uncertainties. Construction projects in the Gaza Strip are faced with many risks that must be identified [28, 29] and studied properly so that they can be managed to ensure the success of the projects. This is the key rationale for this study, where most of the public and private projects are usually implemented in a risky environment and need to be managed. This will lead to an improvement in the construction project performance thereby contributing positively to the national economy [15, 30, 31]. Furthermore, the existence of an effective risk management system would solve the common concern of many foreign investors and international donor agencies in the Gaza Strip. Therefore, this study aims to identify and evaluate the factors affecting the performance of construction projects in the Gaza strips. Also, a recommendation is provided to improve project performance.
2. MATERIALS AND METHODS
Being this an empirical study, the questionnaire survey of the key participants in the construction industry of the Gaza Strip was carried out to investigate the major challenges faced by construction projects. The study covers engineering consulting companies, Ministry of Works and Housing, Reconstruction committee and international organizations operating in Gaza Strip such as UNRWA and UNDP.
2.1. The Questionnaire
A questionnaire was prepared, and a pilot survey was conducted to check its suitability in the study area. A three-step process was adopted in testing the suitability of the questionnaire. Firstly, experts in construction projects with experience in questionnaires evaluation and statistics were consulted regarding the questionnaire. For that, the researchers interviewed a sample of (15) different experts in the construction field in Gaza Strip to pre-test the questionnaire and consequently, the questions were restated, simplified, and amended based on the expert's feedback. Secondly, the questionnaire was distributed to a limited number from the targeted population (about 70 respondents) chosen randomly to fill in the questionnaires. Thirdly, statistical tests were done to analyze the questionnaire to check their reliability and validity.
In the end, the final questionnaire was completed taking into account all the corrections and suggestions from the pilot study. The questionnaire was distributed to the respondents together with a cover letter stating the purpose of the research and ensuring them that their identity will be anonymous.
2.2. Measurements
Analysis of the data was undertaken using IBM SPSS Statistics (Statistical Package for the Social Science) Version 22. The following measures were used for the data analysis:
2.2.1. Cross-Tabulation Analysis
The cross-tabulation (crosstab) is one of the statistical tables’ forms that shows the frequency distribution of the variables. Crosstab is usually used in survey studies for engineering, scientific and business studies. This type of analysis provides a simple view of the relationship between two variables and helps to find interactions between them.
2.2.2. Relative Importance Index (RII)
The relative importance index method (RII) was used to determine the ranks of all Risk factors. The relative importance index was computed as [32-40]:
 |
(1) |
Where:
W = the weight given to each factor by the respondents (ranging from 1 to 5)
A = the highest weight (i.e. 5 in this case)
N = the total number of respondents
The RII value has a range of 0 to 1 (0 not inclusive). The more impact the attribute has, the higher the value of its RII. On the downside, RII does not show the relationship between the various attributes. Hence, in this case, Factor analysis was used for investigating the clustering effects.
2.2.3. Factor Analysis
The factor analysis is used in reducing the statistical data to lessen or mitigate the set of variables or factors [41]. To do that, SPSS was used to measure the pattern of inter-correlations between variables and the sub-sets of variables linked with each other. That led to the downsizing of a large number of variables to a more manageable number, before using them in other analyses such as multiple regressions or correlation [41]. To assess the adequacy of the data survey and factor analysis, Kaiser-Meyer Oklin (KMO) test of sphericity and Bartlett's test were used. The value of (KMO) is the ratio of squared correlation between variables to the squared partial correlation between variables. It varies from 0 to 1. A value close to 1 indicates that the pattern of correlation is relatively compact and hence factor analysis should give distinct and reliable results. A minimum value of 0.5 has been suggested [41]. In this research, the exploratory factor analysis method was firstly applied by SPSS followed by confirmatory factor analysis to test the hypotheses related to each objective.
2.2.4. Normal Distribution
The statistical data for a parametric test in most cases assumes normal distribution because if that is not the case, the result tends to be faulty. The normality was evaluated by the central limit theorem. The central limit theorem states that for large samples (above 30), it follows a shape of a normal distribution regardless of the shape of the population from which the sample was drawn. In this study, the collected data follows the normal distribution where the sample size (N) is 60 and so parametric tests were used.
2.2.5. Homogeneity of Variances (Homoscedasticity)
Equal variances across samples are called homogeneity of variance. Some statistical tests, such as the analysis of variance, assume that the variances are equal across groups or samples. The assumption of homoscedasticity (homogeneity of variance) simplifies mathematical and computational treatment. Levene's test was used to verify the assumption that k samples have equal variances.
2.2.6. Respondent’s Profile
The target respondents were drawn from engineering companies, supervising engineers and engineer’s association in the construction industry in the Gaza Strip. Based on the 60 responses retrieved, the profile of the respondents was generated by six categories of questions asked. Concerning their job, 70% of the respondents were engineers followed by directors of engineering office accounting for 11.7%. 25% of the respondents had 5 to less than 10 years of experience in the engineering field followed closely by those having 10 to less than 15 years of experience i.e. 20%. Out of the 60 respondents, 44 (73.3%) had bachelor’s degree, 11 (18.3) had masters, 4 having a diploma (6.7%) with only one having a Ph.D. (1.7%). 35% of them have implemented more than 5 projects in the previous 5 years. In the category of the years of the engineering office in the field of consultancy, less than 5 years and more than 15 years both were 23.3%. 31.7% implemented projects worth less than 1$ million in the last five years. 25% implemented 1$ million to less than 5$ million while 21.7% implemented 5$ million to more than 10$ million. Table 2 presents the result of the respondents’ background information.
| Job Title | Frequency (F) | Percent (%) |
|---|---|---|
| Director of Engineering Office | 7 | 11.7 |
| Projects Manager | 4 | 6.7 |
| Head of specialization | 3 | 5.0 |
| Assistant Head of Specialization | 2 | 3.3 |
| Engineer | 42 | 70.0 |
| Other | 2 | 3.3 |
| Years of experience in the engineering field | - | - |
| Less than 5 | 23 | 38.3 |
| 5 - Less than 10 | 15 | 25.0 |
| 10 - Less than 15 | 12 | 20.0 |
| More than 15 | 10 | 16.7 |
| Educational level | - | - |
| Diploma | 4 | 6.7 |
| Bachelor | 44 | 73.3 |
| Master | 11 | 18.3 |
| Ph.D. | 1 | 1.7 |
| Number of projects implemented during the previous 5 years | - | - |
| Less than 5 projects | 16 | 26.7 |
| 5 - Less than 10 | 13 | 21.7 |
| 10 - Less than 15 | 10 | 16.7 |
| More than 15 | 21 | 35.0 |
| Years of experience of the Engineering Office in the field of consultancy | - | - |
| Less than 5 | 14 | 23.3 |
| 5 - Less than 10 | 17 | 28.3 |
| 10 - Less than 15 | 15 | 25.0 |
| More than 15 | 14 | 23.3 |
| Value of projects implemented in the last 5 years | - | - |
| > $1 million | 19 | 31.7 |
| From $1 to less than $5 million | 15 | 25.0 |
| From $5 to less than $10 million | 13 | 21.7 |
| $10 million and more | 13 | 21.7 |
Analysis of the respondent’s profile revealed that there are no statistically significant differences attributed to four of the categories (Job Title, years of experience in Engineering Field, Number of projects implemented during the previous five years and Years of experience of the Engineering Office in the field of consultancy) investigated at the level of the means of their views on the subject of an investigation of key risks and risk management strategies in construction projects -Gaza strip. Only in the respondent’s education level category, there was a statistically significant difference at the level of α investigated (α ≤ 0.05).
3. RESULTS AND DISCUSSION
The questionnaire was successfully retrieved with a response rate of 85.71%. Table 3 presents the result regarding seven factors of risk in the construction organizations in the Gaza strip.
These data were subjected to the opinion of respondents, and the result of the analyses is shown in Table 2. The descriptive statistics, i.e. Standard Deviations (SD), Means, t-value (two-tailed), Relative Importance Indices (RII), probabilities (P-value) and finally ranks were established. Results illustrated that the total average mean for all “Risk factors statement” was equal to 3.27, T-test 2.71 and the P-value equal to 0.009, which is less than 0.05. This means that the respondents have high risk in the construction organizations and the results are significant. The SD was also used to quantify the amount of variation or dispersion of respondent opinions regarding “Risk factors statement”. As shown in Table 3, the average SD was 0.75, which indicates that the respondents’ results are consistent and are not spread out over a wider range of values. From Table 3, the following can be deduced:
- P-value = 0.009 < 0.05, and T statistics (2.71) > T critical (2.00), so there is a statistically significant difference attributed to the respondents’ opinions at the level of α ≤ 0.05 between the statistical mean (3.27) and hypotheses mean (3) on the field of risk factors.
- Average mean = 3.27 > 3 (Neutral RII), which means that the respondents have high risk regarding the construction organizations
| No. | Risk statement | Mean | Std. Dev | RII (%) | T value |
P value Sig. |
Rank |
|---|---|---|---|---|---|---|---|
| Physical factors | |||||||
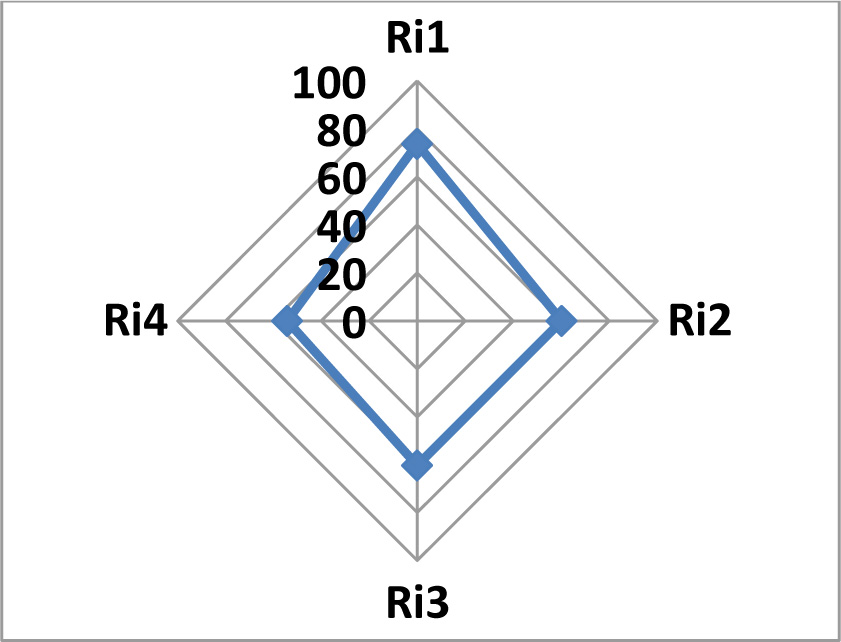
| Ri1 | Occurrence of accidents and poor safety procedures. | 3.68 | 1.23 | 73.67 | 4.31 | 0.000 | 1 |
| Ri2 | Supplies of defective materials. | 3.02 | 1.16 | 60.33 | 0.11 | 0.912 | 2 |
| Ri3 | Environmental disasters. | 3.02 | 1.17 | 60.33 | 0.11 | 0.913 | 3 |
| Ri4 | Adverse weather conditions. | 2.72 | 1.04 | 54.33 | 2.10 | 0.040 | 4 |
| Design factors | |||||||
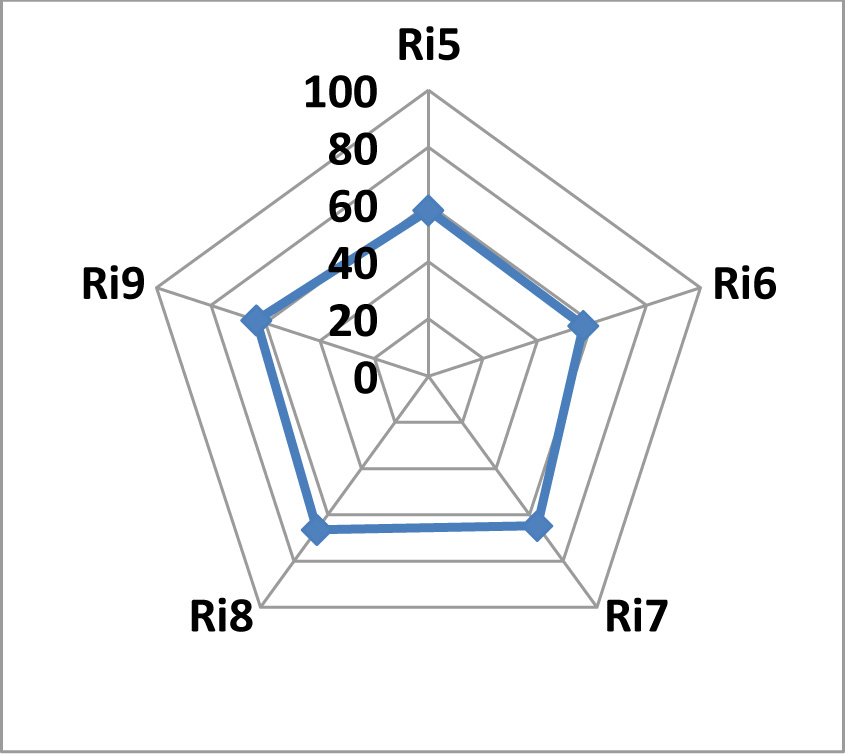
| Ri5 | Defective design (incorrect). | 2.90 | 1.34 | 58.00 | 0.58 | 0.564 | 4 |
| Ri6 | Not coordinated design (mechanical, electrical, etc). | 2.85 | 1.02 | 57.00 | 1.14 | 0.260 | 5 |
| Ri7 | Urgent design. | 3.23 | 0.96 | 64.67 | 1.88 | 0.066 | 2 |
| Ri8 | Awarding the design to an unqualified Designer. | 3.32 | 1.17 | 66.44 | 2.12 | 0.038 | 1 |
| Ri9 | Unrealistic client expectations regarding project time, cost or quality. | 3.17 | 1.17 | 63.33 | 1.11 | 0.273 | 3 |
| Logistic factors | |||||||
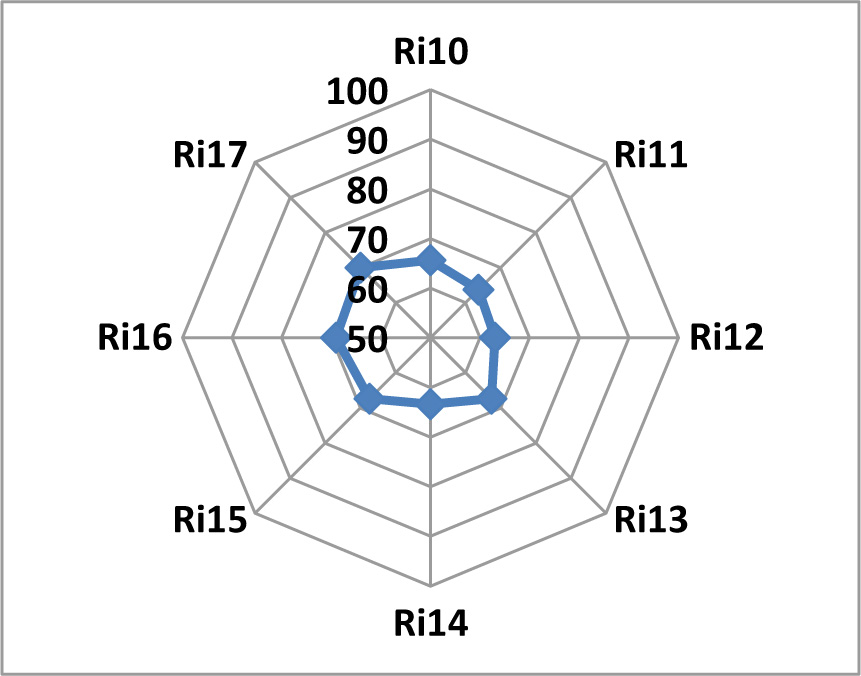
| Ri10 | Labor, material and equipment | 3.28 | 1.15 | 65.67 | 1.91 | 0.061 | 5 |
| Ri11 | Weak human and financial resources | 3.18 | 1.13 | 63.67 | 1.26 | 0.213 | 6 |
| Ri12 | Lack of availability of required equipment | 3.15 | 1.15 | 63.00 | 1.01 | 0.315 | 8 |
| Ri13 | Competitive tenders | 3.37 | 1.10 | 67.33 | 2.57 | 0.013 | 3 |
| Ri14 | Delayed payment on contract | 3.17 | 1.21 | 63.33 | 1.07 | 0.290 | 7 |
| Ri15 | Financial failure | 3.37 | 1.15 | 67.33 | 2.47 | 0.016 | 4 |
| Ri16 | Unexpected delay in construction material arrival | 3.45 | 1.00 | 69.00 | 3.49 | 0.001 | 2 |
| Ri17 | Unexpected change in currency and material prices | 3.50 | 0.95 | 70.00 | 4.09 | 0.000 | 1 |
| Legal factors | |||||||
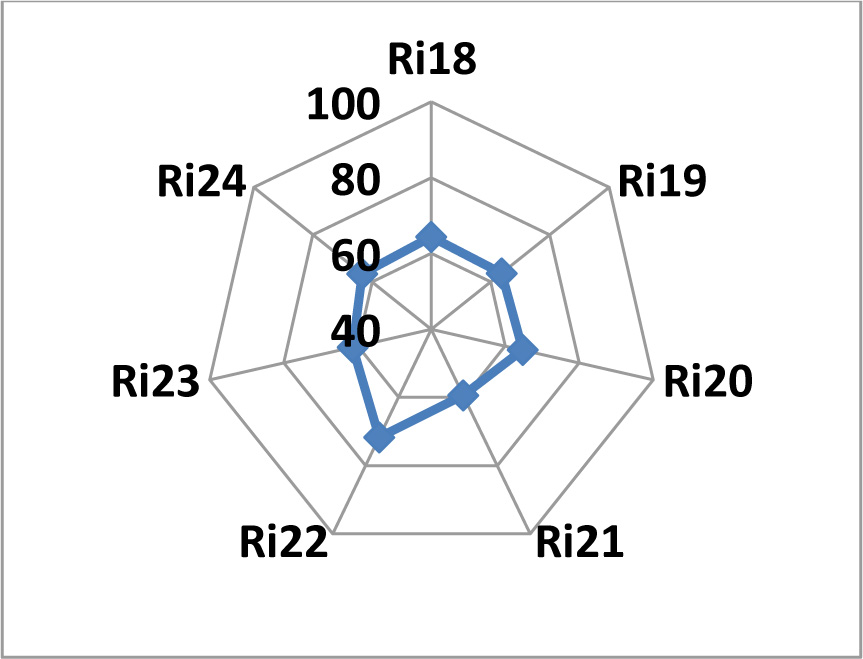
| Ri18 | Non-compliance with the laws governing the work | 3.22 | 1.15 | 64.33 | 1.46 | 0.150 | 3 |
| Ri19 | Claims and disputes between parts of project | 3.18 | 1.11 | 63.67 | 1.28 | 0.207 | 4 |
| Ri20 | Delayed dispute resolution | 3.23 | 1.08 | 64.67 | 1.67 | 0.099 | 2 |
| Ri21 | There is no specific committee to solve the disputes | 2.97 | 1.15 | 59.33 | 0.22 | 0.823 | 7 |
| Ri22 | The lowest prices without regard to the efficiency and quality of work. | 3.58 | 1.27 | 71.67 | 3.57 | 0.001 | 1 |
| Ri23 | The gap between the implementation process and the required specifications due to lack of clarity of diagrams and technical conditions | 3.07 | 1.09 | 61.33 | 0.47 | 0.637 | 6 |
| Ri24 | No documentation of changes orders | 3.17 | 1.14 | 63.33 | 1.13 | 0.261 | 5 |
| Technical factors | |||||||
| Ri25 | Limitation in business quality and time limits | 3.08 | 1.06 | 61.67 | 0.61 | 0.546 | 2 |
| Ri26 | Change in designs and technical specifications V.O | 3.02 | 1.00 | 60.33 | 0.13 | 0.898 | 3 |
| Ri27 | Security, safety and environmental factors | 3.32 | 1.10 | 66.33 | 2.24 | 0.029 | 1 |
| Ri28 | The error in estimating the quantities required | 3.02 | 1.00 | 60.33 | 0.13 | 0.898 | 4 |
| Political factors | |||||||
| Ri29 | Work in the hot border areas between the Gaza Strip and the Israeli occupation army headquarters | 3.64 | 1.35 | 72.88 | 3.67 | 0.001 | 3 |
| Ri30 | Lack of security stability | 3.60 | 1.24 | 72.00 | 3.75 | 0.000 | 4 |
| Ri31 | Close of the crosses and siege | 3.98 | 1.11 | 79.67 | 6.85 | 0.000 | 1 |
| Ri32 | Lack of raw materials in markets due to political conditions | 3.87 | 1.19 | 77.33 | 5.66 | 0.000 | 2 |
| Management factors | |||||||
| Ri33 | Lack of proper resource management. | 3.68 | 1.07 | 73.67 | 4.97 | 0.000 | 1 |
| Ri34 | Change in the administrative structure of the project. | 3.20 | 1.02 | 64.00 | 1.52 | 0.135 | 4 |
| Ri35 | Lack of efficient management. | 3.37 | 1.22 | 67.33 | 2.33 | 0.023 | 2 |
| Ri36 | Uncooperative managers and slow decision-making. | 3.25 | 1.05 | 65.00 | 1.84 | 0.071 | 3 |
| Ri37 | Effectiveness of communication among stakeholders. | 3.12 | 0.94 | 62.33 | 0.96 | 0.341 | 6 |
| Ri38 | Lack of communication and coordination between the parties to the project. | 3.17 | 1.14 | 63.33 | 1.13 | 0.261 | 5 |
| - | All statements | 3.27 | 0.75 | 65.40 | 2.71 | 0.009* | - |
The results indicated that for the Physical factors group, “Occurrence of accidents and poor safety procedures” factor has the highest rank. This can be attributed to the high risk of non-compliance with security and safety measures due to the following reasons:
- Lack of awareness among contractors about the importance of compliance with security and safety procedures.
- Some construction companies believe that compliance with safety and security measures increases project costs.
- Lack of specialists in security and safety control business in the Gaza Strip.
- Some companies believe that compliance with security and safety measures is secondary and non-essential.
This factor obtained the largest percentage (RII 73.67%) in comparison to other risk factor statements from the results of the questionnaires with respect to physical factors. This result is further presented in Fig. (1).
Design factors group contains 5 factors among which “Awarding the design to unqualified Designer” risk factor (Ri8) (RII =66.44%; P-value =0.038; T-value =2.12; SD = 1.17) has the highest rank as depicted in Fig. (2).
This is because some engineering offices and agencies resort to less efficient and less experienced designers to reduce design costs, resulting in a design error that could lead to errors in the implementation. Another reason also is that due to the lack of time to obtain a good design from an experienced designer, the organization will use an inexperienced designer that offers getting them the design relatively faster.
Logistic factors group contains 8 statement factors. The findings indicated that “Unexpected change in currency and material prices” Risk factor (Ri17) (RII =70.00%; P-value =0.000; T-value = 4.09, SD = 0.95) has the highest rank in this group (Fig. 3).
Due to the unstable nature of the economy in the Gaza strip brought about by the Israeli occupation, fluctuations in the currency and prices of materials are very common and happen very frequently. Among the consequences is the change in the prices of materials in the local markets by the traders. Sometimes contractors are forced to buy materials at prices higher than what is provided for in the contract documents making them operate at a loss. This practice exposes contractors to a lot of financial risks especially when there is no provision for compensation in such eventualities.
Legal factors group contains 7 statements. The findings indicated that “The lowest prices without regard to the efficiency and quality of work” Risk factor (Ri22) (RII =71.67%; P-value =0.001; T-value = 3.57; SD = 1.27) has the highest rank in this group (Fig. 4)
Gaza Strip suffers from financial stagnation due to the closure and blockade imposed over the years and this reflects negatively on the local market and engineering companies. Therefore, some companies accept work at lowest prices that do not achieve the minimum cost requirements of the project to maintain their survival in the market. Also, the large number of construction companies in the Gaza Strip compete with a few operating projects, which leads to negative competition situations.
Technical factors group contains four factors. The findings indicated that “Security, safety and environmental factors” Risk statement (Ri27) (RII =66.33%; P-value =0.029; T-value= 2.24; SD = 1.10) has the highest rank in this factor (Fig. 5).
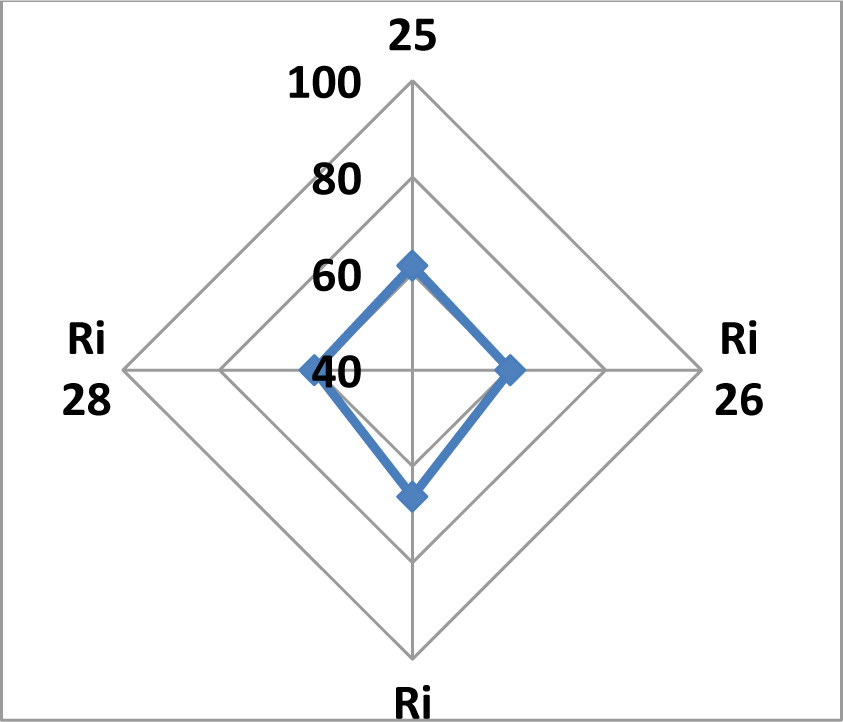
The “security and safety of the project environment” is one of the most important factors that can be achieved in construction projects. However, it was found that the ratio of this risk factor statement is high compared to other factors. Due to the lack of proper control over security and safety factors, high cost is incurred by the contractors, business executives and construction projects under a difficult physical situation in the Gaza Strip. Some construction companies consider that the cost of security and safety equipment is a burden on the costs of the project, in addition to being considered a non-main component in the completion of the work, while the documents of contracts confirm in their terms to abide by the rules of security and safety and work in a safe environment.
Political factors group contains 4 factors. The findings indicated that “Close of the crosses and siege” Risk factor (Ri31) (RII =79.67%; P-value =0.000; T-value = 6.85; SD = 1.11) has the highest rank in this factor (Fig. 6).
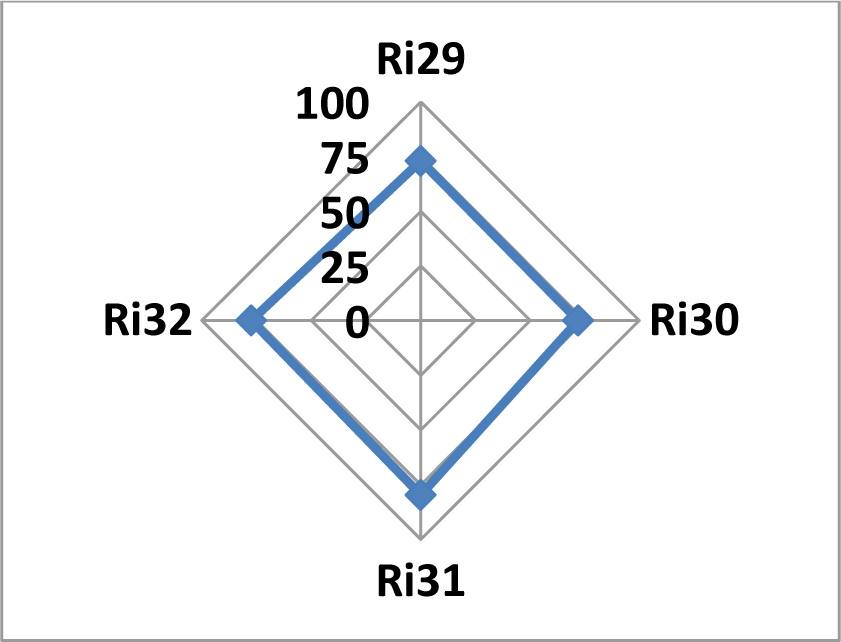
Due to the political conditions, the Gaza Strip suffers from siege and closures leading to the failure of the arrival of building materials, which in turn delay the delivery period of the project and its completion. The Palestinian-Israeli conflict resulted in some Israeli sanctions on the Palestinians, especially in the Gaza Strip, where border closures prevent aid and raw materials from entering in the Gaza Strip. This reflects badly on the lives and the living conditions of the inhabitants of the Gaza Strip. The construction companies are also negatively affected due to the lack of raw materials and other necessary items needed for the smooth operations of the companies such as fuel, machinery, etc. Therefore, the closure of border crosses and siege risk factor statements got the highest ranking.
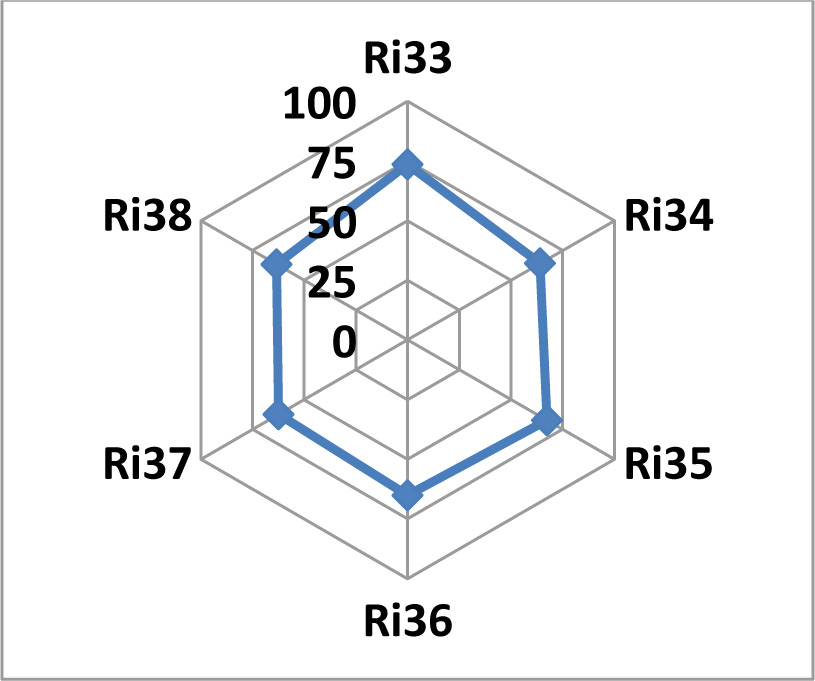
Management factors group contains 6 factors. The findings indicated that “Lack of proper resource management” Risk statement (Ri33) (RII =73.67%; P-value =0.000; T-value = 4.97; SD = 1.07) has the highest rank in this factor (Fig. 7).
| Category | Average RII (%) | Rank |
|---|---|---|
| Political factors | 75.47 | 1 |
| Logistic factors | 66.17 | 2 |
| Management factors | 65.94 | 3 |
| Legal factors | 64.05 | 4 |
| Physical factors | 62.17 | 5 |
| Technical factors | 62.17 | 6 |
| Design factors | 61.89 | 7 |
In this case, it is difficult for staff to adapt to the new management policy, and that may lead to a delay in the completion of the required work. The management must have the right managerial skills to successfully function in private construction projects and to deal with lower-level staff working on the project. There should be adequate management of time, good planning, decision making, and other skills that can help the staff in completing the tasks assigned to them. In addition to that, the distribution of human resources should be according to specialty as that will help to accomplish tasks fully and achieve goals and gives the employee the possibility of progress and development in their area of work. A good manager can predict possible risks that may occur based on actual observation or from reports and this is due to years of management experience in managing similar projects. Also, good management can avoid the occurrence of possible risks and can develop alternative plans necessary to meet the risk, should it occur. This factor got the largest percentage compared to other management factors.
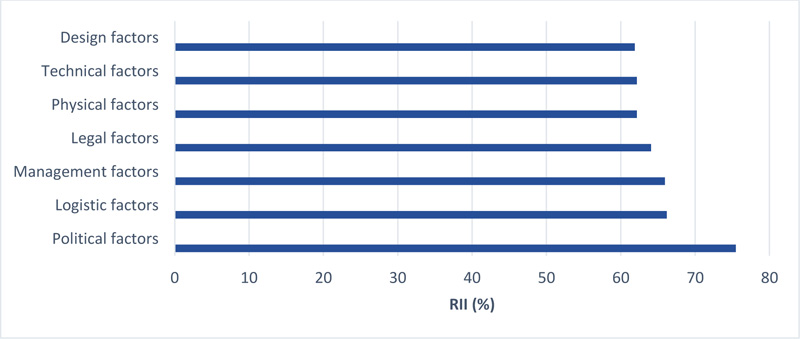
At the end of the risk factors analyses, it became clear as shown in Table 4 and Fig. (8), that Political Risk factors group is the most critical with an average RII of 75.47%, while the Design factors group is the least critical of the seven risk factors discussed with an average RII value of 61.89%.
CONCLUSION
Gaza strip is facing a lot of challenges which directly and indirectly affect the performance and efficient delivery of construction projects in the area. It is against this backdrop that this study was undertaken to assess the risk factors affecting construction projects in the area by analyzing the responses of experts and professionals in the construction industry through the use of a structured questionnaire. At the end of the study, the conclusions that can be drawn are:
- There are statistically significant risks in the construction projects in the Gaza strip. The most prominent cause of concern among the sources of risks is the volatile political nature of the area due to the frequent attacks being experienced. This leads to the closure of the crosses and incessant siege that in turn lead to the lack of raw materials. In line with this fact, the findings of this research showed that the Political factors group is the highest risk factor with an average RII of 75.47% giving credence to its high impact. On the other hand, Design factors group is the least factor with an RII of 61.89%.
- It was found that accidents and poor safety measures rank highest among the physical factors considered. For design factors, the riskiest aspect is the award of design to unqualified designers. In terms of logistic factors, the unexpected change in material prices has the most impact.
- It is recommended that companies should appoint a specialist in the field of risk management, security and safety to follow up and monitor the work procedures in the project. Also, the companies are required to maintain the safety and integrity of the project, in addition to risk analysis and forecasting and to develop appropriate solutions to overcome any problems that may occur.
CONSENT FOR PUBLICATION
Not applicable.
AVAILABILITY OF DATA AND MATERIALS
Not applicable.
FUNDING
None.
CONFLICT OF INTEREST
The authors declare no conflict of interest, financial or otherwise.
ACKNOWLEDGEMENTS
Declared none.


