All published articles of this journal are available on ScienceDirect.

Dynamic Monitoring of an Existing Reinforced Concrete Building in Naples Port Area
Authors Info & Affiliations
Abstract
Introduction:
The conservation and preservation of existing buildings, in particular public infrastructures, is currently a significant issue in Italy and Europe, considering their strategic role and the risk represented by human losses, management issues and also economic disruption in case of collapse.
In this context, the interest in conservation is not restricted to monumental or artistical buildings but also includes the several buildings composing the Italian infrastructural heritage, which in many cases are made of reinforced concrete and show signs of ageing after half a century and more from their construction.
Methods:
On the basis of these premises, in the present paper, a preliminary investigation on an infrastructural case study located in Naples port is presented. Such a study is part of a research activity aimed at defining critical structural issues of the central administrative building of the Central Tyrrhenian Sea Port System Authority.
Results:
A system of high-sensitivity and low-cost MEMS acceleration sensors were installed on the structure, with the aim of investigating its dynamic behaviour. A Finite Element model of the building was created, including information about material properties and cross-section details from prior experimental activities. A model updating procedure was carried out, based on the dynamic data collected by the monitoring system and post-processed to estimate the fundamental frequencies.
Conclusion:
This has allowed highlighting the main features of the dynamic response of the building, and the critical role played by deformability of infill panels and floors on the modal properties of the structure.
1. INTRODUCTION
Strategies for assessment, retrofitting and preservation of infrastructural heritage have become central topics in modern structural engineering. Reinforced Concrete (RC) constructions have been built for about one century around the world, revolutionising the way structures are conceived and realised. However, concrete durability has now become an issue and technologies aimed at monitoring and assessing the structural behaviour and performance of strategic structures and infrastructures must be developed and implemented to avoid catastrophic failures in case of exceptional actions, including impacts and earthquakes. In this context, Structural Health Monitoring in general [1] and Operational Modal Analysis (OMA) [2] in particular have emerged as useful techniques to investigate the structural dynamic features and, in turn, tuning predictive numerical models, possibly including the effect of pre-existing damage [3, 4]. Modern techniques used in dynamic monitoring either utilise data-driven [5] or model-driven [6] methods for the identification of predictive models (model updating).
Traditional structural monitoring systems are composed of multiple sensors (generally accelerometers [7], but also combinations of different sensors [8, 9]) distributed throughout the structure and connected to a central processing unit by means of a wired communication infrastructure. Although this layout is widely used and able to provide a large quantity of data to be analysed continuously, low-cost options including independent Micro Electro-Mechanical System (MEMS) accelerometers appropriately placed can be particularly valuable and flexible, either for detecting abnormal events which can occur during the normal functioning of the building, i.e., continuous monitoring, or for shorter experimental programmes aimed at investigating the modal characteristics of the investigated structure.
In this paper, a case study of a building monitored by means of such cost-effective system is described. The study has been developed by the Department of Architecture and Industrial Design of the University of Campania “Luigi Vanvitelli” within a wider activity contracted by the Central Tyrrhenian Sea Port System Authority of Naples aimed at investigating the dynamic behaviour of the building, which in the past had been subjected to abnormal vibrations due to impact of large ships docking on the harbour embankments. To this purpose, an explorative monitoring activity was carried out to evaluate the level of accelerations to which the building was subjected due to ambient excitations in order to define an accurate numerical model based on previous experimental investigations. This will be complemented in the future by further investigation finalised to the interpretation of the observed phenomenology. In this paper, the relevant effects of both infill walls and flexible orthotropic floor diaphragms are also investigated through comparison of an appropriate numerical model output with the experimental data.
2. MATERIALS AND METHODS
2.1. Description of the Building
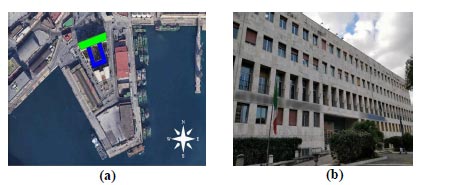
The monitored building is located in Naples port area, in the central part of a dock, on both sides of which cargo ships normally load and unload (Fig. 1). The building, having a regular shape in plan, symmetrical with respect to an axis approximately parallel to N-S direction, was built in 1956. It is characterised by a trapezoidal part (green area in Fig. (1a) with basis dimensions equal to 74.90 m and 66.65 m, respectively and 17.50 m long sloped edges, and a C-shaped part (blue area in Fig. (1a) with dimensions equal to 47.40 m and 38.25 m, respectively. The inner region is void and used as a courtyard. The building is composed of five floor levels, including the flat roof, with a total height of about 20 m.
The structure is a reinforced concrete frame, composed of 152 columns, 926 deep beams and 4 flat beams. The beam spans range from 1.90 m to 6.30 m, with the exception of one span on the North side (Fig. 1b), which is equal to 9.65 m. The columns have a variable cross-section which is equal to 50 cm×50 cm along the external frames, whereas internally vary from 40 cm×80 cm at the lower levels to 40 cm×25 cm at roof level. The beams generally have 60 cm width and height ranging from 60 cm to 110 cm.
The unidirectional floors are in cast-in-place reinforced concrete with hollow blocks. They are 22 cm high and are composed by a 4 cm thick slab and 12 cm wide joists, 50 cm spaced. Five staircases and lift shafts composed by RC walls with thickness ranging from 15 to 20 cm are distributed within the building. The RC structure is also characterised by the presence of heavy infill walls made of tuff stone with 40-50 cm thickness. The foundations are made of plinths of different shapes laying on 40 cm diameter piles, connected to one another by means of beams.
Since the original design documents are unavailable, an extensive survey was performed in the past years to determine geometrical and mechanical characteristics of the structural system. These data are reported in the next Section, alongside with the main outcomes of the dynamic monitoring activity carried out by the authors.
2.2. Experimental Data
2.2.1. Overview
With the main aim of calibrating an adequate numerical model of the building by reaching a sufficient level of knowledge, data from a past survey were utilised, consisting of:
- Geometrical and structural survey by means of pachometer tests for identification of reinforcement and constructive details;
- Extraction of reinforcement samples and tensile testing to determine mechanical characteristics of steel;
- Coring and compression tests on extracted concrete samples;
- Survey of foundations to determine geometry and typology.
In addition, a system of Micro Electro-Mechanical System (MEMS) accelerometers was installed by the authors to monitor accelerations and determine fundamental frequencies of the structure.
2.2.2. Material Properties
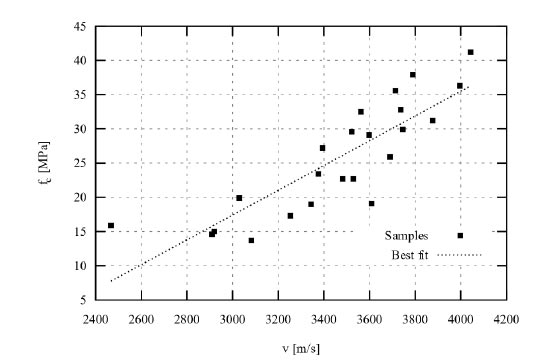
Mechanical characteristics of concrete were estimated from the results coming from compression tests on samples extracted through coring. 24 cylindrical specimens having 93 mm diameter and height variable from 152 to 188 mm were extracted from beams and columns at several levels. Before performing the compression tests, the ultrasound velocity was also evaluated so as to determine an empirical relationship between velocity and strength and extend the results to the other parts of the structures, where coring was not possible.
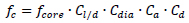
The strength obtained from cores must be corrected to account for the dimensions of the specimen, the presence of small diameter rebars, and the interferences due to coring. In this context, the formulation proposed by Masi [10] was used, which reads:
 |
(1) |
Where:
● ƒcore is the reference strength estimated from the test on the core;
●  is a correction factor for the specimen slenderness, with h specimen height and D specimen diameter;
● Cdia is a correction factor for the diameter, equal to 1.06, 1.0, 0.98 for D = 50 mm, 100 mm, 150 mm respectivly;
● Ca is a correction factor due to the presence of rebars, equal to 1.03 for small diameter (10 mm) rebars, and 1.13 for large diameter (20 mm) rebars;
● Cd is a correction factor for the damage induced by coring. FEMA 274 [11] proposes using a value equal to 1.06, with well-executed coring. Considering that the damage is larger for lower concrete quality, Masi [10] instead suggests using 1.20 for ƒcore < 20 MPa and 1.10 for ƒcore > 20 MPa.
Before performing the compression tests, the ultrasound velocity v was also evaluated. The correlation between ƒc and v [in m/s] is identified by regression of the experimental data through the equation (Fig. 2):
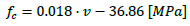 |
(2) |
The average compressive strength was estimated as ƒc,avg = 25.9 MPa, with standard deviation equal to 8.01 MPa. Using the formulation proposed by the Italian Building Code [12], the Young’s modulus equals:
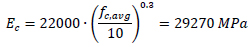 |
(3) |
Tensile tests were carried out on steel samples extracted from several parts of the structure. The average strength was equal to fym=348.3 MPa, which is compatible with FeB32k type smooth steel, typical of the construction period.
3. RESULTS
3.1. Dynamic Monitoring
3.1.1. Experimental Data
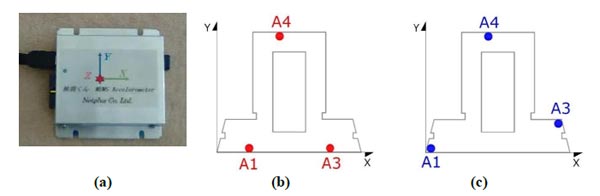
With the aim of recording the levels of acceleration to which the higher floors of the building may be subjected as a result of possible collisions between ships and the dock, a set of tri-axial MEMS accelerometers (Fig. 3a) was installed on the building. The accelerometers, which are developed by Prof. Yasushi Niitsu at Tokyo Denki University, were provided within the scope of a scientific collaboration with a research group at Shinshu University (Japan) specialised in dynamic monitoring of heritage structures [13]. The instruments, having 5.10-5 m/s2 resolution and ± 2g full range, are characterised by a noise level 0.001-0.0017 m/s2.
In particular, two 3-month long acquisition periods were carried out, in which three sensors, called A1, A3, A4 were placed in different positions, respectively (Fig. 3) at the fourth floor. A fourth sensor, called A2, was placed at the foundation level. As mentioned before, given the large distances among them, they were not connected to one another and thus no attempt to synchronise the recordings was made. During each period, the sensors were set up to record at 100 Hz sampling rate only if the observed acceleration exceeded the 0.1 m/s2 thresholds, saving the maximum and minimum value of acceleration per second otherwise. At the end of each period, the sensors were setup to record continuously at 200 Hz sampling rate for about 30 minutes, in order to post-process the data and estimate the fundamental frequencies.
3.1.2. Results in Time Domain
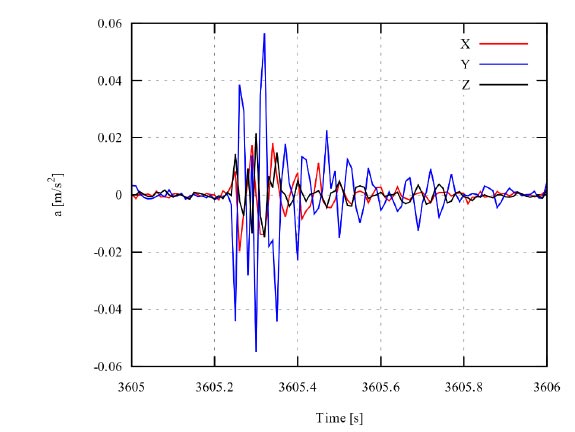
During the two acquisition periods, 19 events were recorded by the three sensors on the fourth floor (13 during acquisition period 1 and 3 during acquisition period 2), possibly following impacts of ships on the dock. On the contrary, no event was recorded by sensor A2. A typical recorded signal following an event, i.e., threshold exceedance, is depicted in Fig. (4). The recorded maximum accelerations were generally within the 0.1 m/s2 limit, with maximum value equal to 0.16 m/s2. Medical research [14, 15] has shown the perception threshold to be variable with age, direction of motion and stimulus profile, including the vibration frequency. The recorded values are compatible with the perception levels observed by these authors. However, these findings refer to well-designed laboratory conditions, while in case of buildings composed by offices the disturbance threshold for impulsive actions admitted by some codes [16] is higher and equal to 0.46 m/s2 in the horizontal directions. No event was distinguishably noticed by the occupants.
3.1.3. Results in Frequency Domain
The dynamic data in time domain obtained from the three accelerometers placed at the fourth floor were post-processed by means of ad-hoc Octave [17] scripts. Given the low levels of excitation, the signal-to-noise ratio for the sensor at the foundation level was too low and thus it will not be considered hereinafter. The following actions were performed on the acceleration-time data blocks given by each sensor:
- Subtraction by signal median to remove zero-frequency component;
- Projection of the X-Y signal pair on a predefined direction in the horizontal plane. Directions from 0° to 180° were considered;
- Filtering of the signal by means of a 5-th order bandpass Butterworth filter with lower cutoff frequency of 0.5 Hz and a higher cutoff frequency of 5 Hz (expected frequency band for the building);
- Evaluation of the Power Spectral Density (PSD) of the signal by means of Fast Fourier Transform (FFT);
- Reduction of the PSD plot by 0.01 Hz window-average.
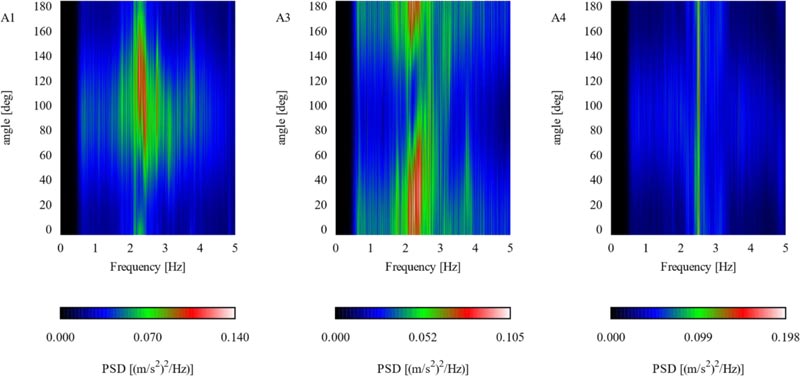
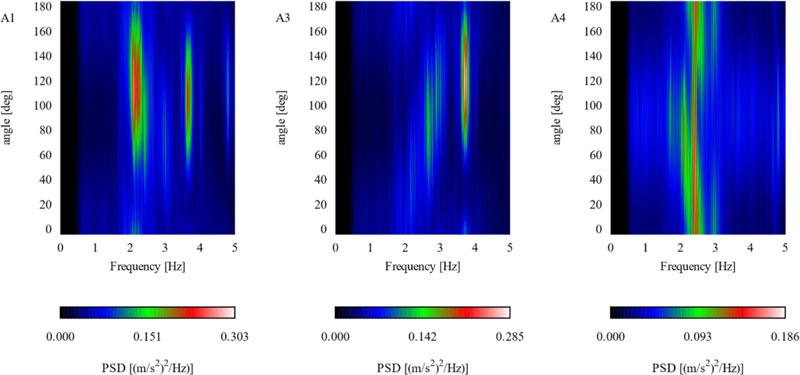
The results are plotted as heat map, which displays PSD as colour with frequency in x and projected direction in y axis (Figs. 5-6). This allows for the identification of the fundamental frequencies and the direction of the highest PSD for a given sensor.
The first acquisition (Fig. 5) shows predominant frequencies between 2.1 and 2.5 Hz for sensors A1 and A3. Given the wide span in frequency where PSD is largest, it can be presumed that more than one modal frequency lies in this range. For sensor A3, for which the presence of at least two close frequencies is more evident. Less powerful PSD peaks are noticed at 2.7, 3.1 and 3.7 Hz for both sensors, but their selection as modal frequencies is uncertain. Sensor A4 data show a unique PSD peak at 2.5 Hz.
For the second acquisition (Fig. 6), sensors A1 and A3 were moved to the external parts of the lateral wings of the building, while A4 was kept in the identical position. For this sensor, the largest PSD is observed at a similar frequency as before (2.5 Hz), even though high PSDs are present on a larger interval, ±0.1 Hz. Possible modal frequencies are detected at 2.1 Hz and 3.1 Hz.
Sensors A1 and A3, located in a more external part of the building than before, now show a more definite PSD diagram. 3.7 Hz frequency is identified very clearly by both sensors. Additionally, sensor A1 shows a PSD peak at 2.1-2.3, similarly to what happened for the first acquisition. This peak region, which was clearly observable for A3, too, disappears in the second acquisition. Two small peaks seem evident at 2.7 Hz and 3.0 Hz.
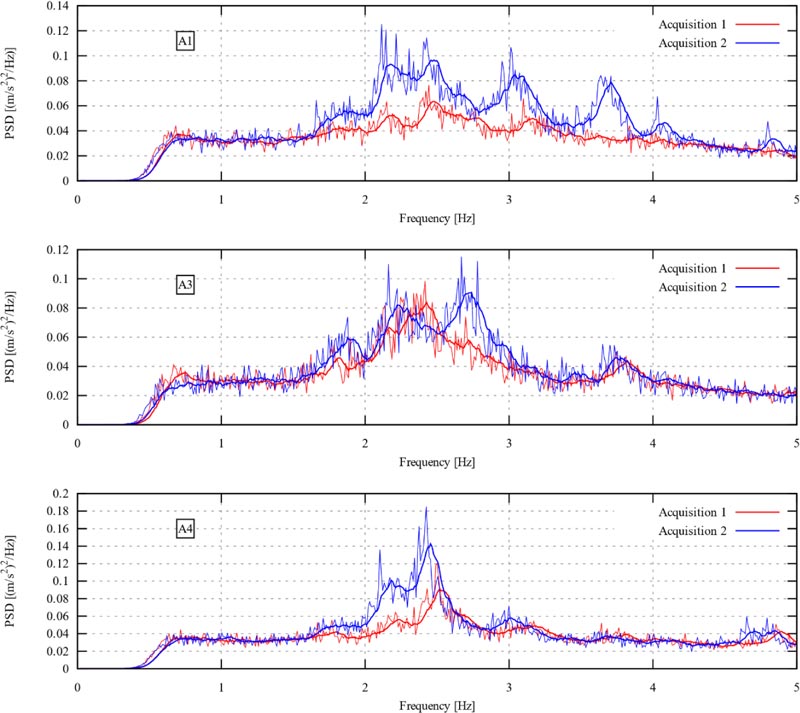
A clearer picture of the dominant frequencies can be obtained by projecting the signals on the 45° direction, with the aim of capturing frequencies related to modes with motion along the two principal axes of the building. This is shown in Fig. (7), where the PSD plots for the two acquisitions are displayed along with their moving average with period 10, with the aim to further increasing the identifiability of the frequencies.
A4, which remained at the same position, shows similar peaks at 2.2 Hz, 2.5 Hz, 3.1 Hz and 3.7 Hz in both acquisitions. A slight 0.1-0.2 Hz shift is observed for some of the frequencies between the two acquisitions, but this is considered acceptable given the uncertainties due to the level of excitation (acquisition 2 was carried out on a windy day), the position and magnitude of the masses and the sensitivity of the instruments. A1 sensor shows peaks at 2.15 Hz, 2.45 Hz, 3.0-3.1 Hz, which seems compatible with the frequencies highlighted by sensor A4. Again, some shifts between the corresponding frequencies observed in the two acquisitions are observed. Two peaks at 3.7 Hz and 4.0 Hz are present for the second acquisition, when the sensor was placed in the external part of the building wings.
A3 sensor reveals peaks at 2.1 Hz, 2.7 Hz and 3.7 Hz for both acquisitions (with different importance, as the first two frequencies are only slightly visible in acquisition 1). The largest peak at 2.4 Hz in acquisition 1 is absent in acquisition 2 and conversely, a small peak at 1.9 Hz recorded in the second acquisition cannot be found before. Given the absence of this latter frequency in the other plots, this is believed to be a local mode, i.e. a wall mode.
To summarise the main outcomes of the present experimental activity, the fundamental frequencies detected by post-processing of the dynamic data can be reasonably identified as: 2.1 Hz, 2.4-2.5 Hz, 2.7 Hz, 3.1 Hz, 3.7 Hz. These will be compared with the eigenvalue analysis output from numerical models of different levels of detail in the next section.
4. DISCUSSION
4.1. FE Modelling and Model Updating
4.1.1. Basic Model
A Finite Element (FE) model of the building was created in SAP2000 software [18]. Beams ad columns were modelled as Solid Frame elements, while the lift shafts were modelled as shell elements of average dimension 20 cm × 20 cm. As a modal analysis was then performed, the foundation was modelled as rigid constraints at the base of the structure, thus uncoupling the super-structure from the soil. Acknowledging the importance of possible soil-structure interaction [19], especially in saturated soils as those close to the seaport, further research will investigate this aspect. The diaphragms were initially considered as rigid as suggested by the building codes for slab having thickness equal or larger than 4 cm.
The Young’s modulus of the concrete was assumed to be equal to the value obtained from the experimental tests on concrete cores. The masses were estimated from the seismic combination proposed from the Italian building code [12], considering the weight of the structural and non-structural elements at full value and a reduced contribution of the live loads:
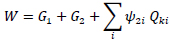 |
(4) |
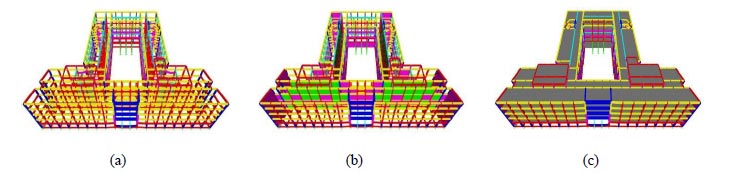
At this stage, the influence of the infill panel was disregarded. A view of the numerical model is depicted in Fig. (8) as Model A.
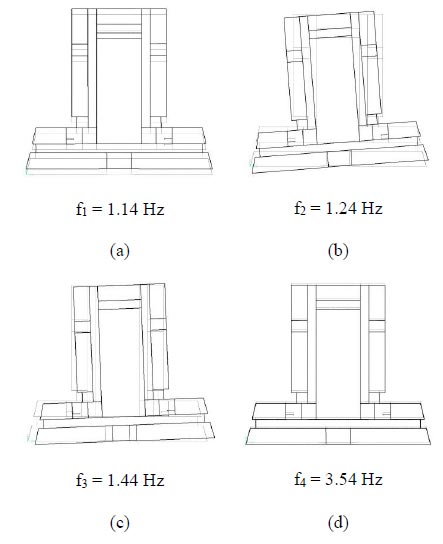
Eigenvalue analysis provided the fundamental frequencies and modes shown in Fig. (9). With reference to the third floor, where the sensors were installed, the first and fourth modes are characterised by translation along the symmetry axis, while both second and third mode shows a rotational motion, with a different centre of rotation, i.e., close to the intersection between the trapezoidal and C-shaped parts of the building for mode 2, on the southern front for mode 3. Both centres of rotation are located on the symmetry axis.
4.1.2. Influence of Infill Panels on the Dynamic Response
The frequencies evaluated from Model A underestimate the experimental values obtained from dynamic data. Hence, it is worth investigating the stiffening effect due to the infill panels, which, as mentioned in Section 2, are made of solid tuff stones. Their thickness, from 40 to 50 cm, is expected to produce a significant stiffness increase.
Many of the computational models developed to account for the effect of the infill walls represent the wall as one [20] or more [21, 22] equivalent diagonal fixed struts, and this is the representation recommended by most codes [23]. From a preliminary dynamic analysis, this approach seemed to underestimate the overall stiffness increase, as neglecting the interaction between infill panel and frame in the tensile zones is too conservative in the case of small-amplitude motion as that recorded under environmental loading. For this reason, in Model B (Fig. 8b), the walls were considered as contributing to the global stiffness for their entire perimeter and simulated by means of shell elements with appropriate stiffness. This was estimated by considering two governing parameters:
- Ratio between opening area and panel area Sa/Sp;
- Ratio between opening width and panel width La/Lp.
According to relevant scientific literature [24, 25], the perforated masonry panel may be considered effective when Sa/Sp<25% and La/Lp<40%. Only the panels satisfying these constraints were represented in the numerical model. The effective panels were hence divided into two classes:
- Class 1: unperforated panels and panels with Sa/Sp<15%;
- Class 2: panels with 15%<Sa/Sp<25%.
[12] and more in particular [26] provide reference ranges for the Young's modulus of different types of masonry. The same building code allows the analyst to increase the value up to 20% in the case of mortar with good mechanical properties. Considering these aspects, the Young’s modulus values were assigned to the two classes as:
- Class 1: upper bound of the range suggested in [26], multiplied for the corrective factor for good mortar, E1 = 1940 MPa;
- Class 2: lower bound of the range [26], E2 = 1200 MPa.
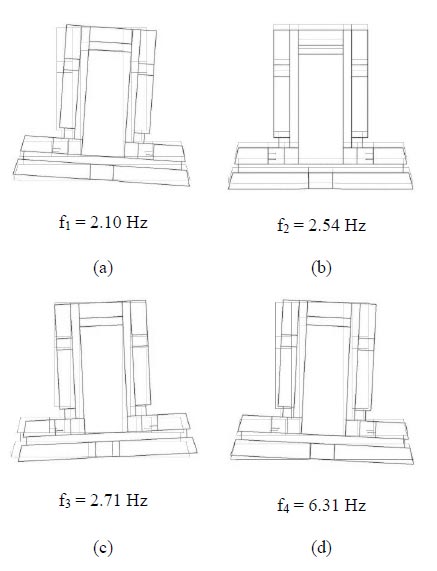
The stiffness increment due to the contribution of the infill walls is particularly noticed by the increase of the fundamental frequencies shown in Fig. (10). The first three frequencies are now consistent with the peaks observed in Figs. (5-7) (2.1 Hz, 2.5 Hz, 2.7 Hz). However, the two peaks observed at 3.1 Hz and 3.7 Hz do not have a counterpart in Fig. (10), with a separated fourth mode at f4 = 6.31 Hz. Considering again the third floor, only one mode is translational (Mode 2), while Mode 1 and 4 are rotational around a pole on the north side and Mode 3 represents a rotation around a pole on the south side. Both poles are on the symmetry axis.
4.1.3. Influence of Deformability of Floors on the Dynamic Response
While the introduction of the infill walls in the model leads to a stiffness increment which is consistent with the experimental observations, distinct peaks seen in the PSD diagrams are still not captured by the numerical model. Increased accuracy may be obtained if a further simplification is removed, i.e., the rigidity of the floors. For this reason, in Model C (Fig. 8c), the floors were modelled as orthotropic shell elements. The basic stiffness in both horizontal directions was evaluated considering the stiffness of the 4-cm slab only. This was then increased in the main direction of the floor, as membrane (axial) and bending stiffness modifiers. The membrane stiffness modifier was evaluated as a ratio between the cross-section area of the joist + slab system and slab, amounting to a stiffness modifier factor equal to 2.1. Conversely, the bending stiffness modifier was evaluated as the ratio between the second moment of area of the joist + slab system around its centroidal axis and the second moment of area of the slab only around the same axis. This equals to 70.
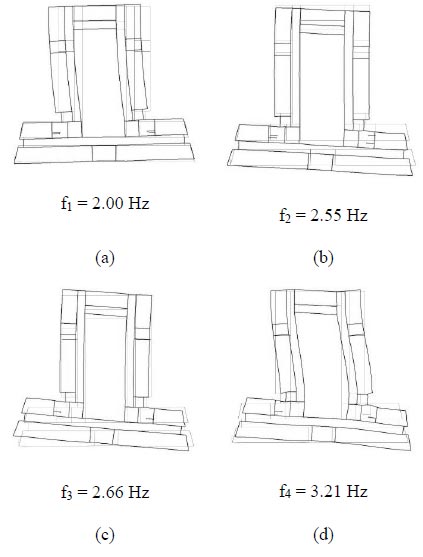
The eigenvalue analysis performed on Model C provides the results shown in Fig. (11). Interestingly, the motion of the third floor involves significant in-plane deformation, implying that the hypothesis of rigid floor used in Model A and B may not be acceptable in this case. The first three frequencies do not change substantially with respect to Model B, but conversely, a new mode at 3.21 Hz is observed, corresponding to the peaks measured in the PSD plots (Fig. 7).
A final comparison between experimental and numerical frequencies of the different models is presented in Table 1, where it is apparent that the proposed numerical Model C is able to provide frequency values in good agreement with the ones identified during the monitoring activity described in Section 3.3.
| Mode | Experimental | Model A | Model B | Model C |
|---|---|---|---|---|
| 1 | 2.1 Hz | 1.14 Hz | 2.10 Hz | 2.00 Hz |
| 2 | 2.4-2.5 Hz | 1.24 Hz | 2.54 Hz | 2.55 Hz |
| 3 | 2.7 Hz | 1.44 Hz | 2.71 Hz | 2.66 Hz |
| 4 | 3.1 Hz | 3.54 Hz | 6.31 Hz | 3.21 Hz |
CONCLUSION
In this paper, an investigation regarding the dynamic behaviour of a strategic building located in Naples is presented. Given the absence of original design documents, the assessment is based on the extensive geometrical and mechanical surveys carried out in the past, with additional data coming from in-situ dynamic monitoring activities performed by the authors. The experimental setup consisted of three MEMS accelerometers placed on the fourth floor of the building and one at foundation; two acquisition stages were performed with the sensors placed in different positions. The setup was designed to be cost-effective and easy to put in place, with light, standalone instruments able to store the data avoiding long wires between them and a central unit, in this case absent.
In parallel, an accurate, three-dimensional Finite Element model of the building was developed, with the aim of investigating the main dynamic features of the building, so as to be used as a baseline model for subsequent analyses that will investigate the behaviour of the structure when subjected to collisions of ships on the dock. Three models with increasing levels of detail were considered and the results compared with the experimental data in the frequency domain obtained by the sensors.
The dynamic results showed that during the two acquisition stages (three-month long each), 19 events exceeding the threshold level for triggering continuous recording were detected. The maximum horizontal accelerations were in the order of 0.1 m/s2, which is below the disturbance threshold identified by the code for office buildings and were not felt by the occupants. At the end of each three-month long acquisition stages, continuous data were recorded to estimate the fundamental frequencies of the building by means of FFT analysis.
The comparison between the experimental PSD peaks and numerical modelling highlights the importance of considering the stiffening effect due to the tuff infill panels, as well as the real deformability of the floors. Whereas the former shifts the first three frequencies to a range which is more consistent with the experimental data, the latter triggers the activation of modes that cannot be captured by means of the usual rigid floor simplification. These, because of the peculiar layout of the building, are characterised by significant in-plane deformation.
The model with infill walls and deformable floors seem adequate for correct interpretation of the dynamic behaviour of the building, as it provides frequencies and modal shapes, which are in a very good agreement with the results deriving from the monitoring activity. Future research will investigate the behaviour of the building under impact loading coming from collisions of ships with the dock, accounting for the real deformability of the soil as well as its interaction with the building.
CONSENT FOR PUBLICATION
Not applicable.
AVAILABILITY OF DATA AND MATERIALS
The authors confirm that the data supporting the findings of this study are available within the article.
FUNDING
None.
CONFLICT OF INTEREST
The authors declare no conflict of interest, financial or otherwise.
ACKNOWLEDGEMENTS
The present study has been developed within the activity commissioned by the Central Tyrrhenian Sea Port System Authority of Naples to the Department of Architecture and Industrial Design of the University of Campania “Luigi Vanvitelli” aimed at analysing the vibrational response of the building under investigation.
The authors are thankful to Dr Yohei Endo from Shinshu University and Prof. Yasushi Niitsu from Tokyo Denki University for kindly providing the MEMS accelerometers used in this research.

