All published articles of this journal are available on ScienceDirect.
Performance Improvement of Box Girder Construction on Toll Road Projects based on M-PERT and VE
Abstract
Background:
According to the 2019 Global Competitiveness Index (CGI) by the World Economic Forum, the infrastructure growth of Indonesia is placed on number 72 out of 141 countries and ranked 5th in the ASEAN countries. The growth of infrastructure in Indonesia is a result of the imbalance increase of developments of 10-55% annually with only a 1.9% annual increase in road length. There was a delay of 11.95%, with the high investment in the construction of this toll road and the low-interest rate of return of around 7.79%.
Objective:
The expected goal in this research is to have cost and time efficiency in implementing infrastructure on the toll road project.
Materials and Methods:
This research is using a combination of case studies and statistical analysis; the case studies and the implementation of the M-PERT and VE on the object. Statistical analysis using simulation tools Relative Importance Index (RII) analysis based on research instruments to the success of the implementation of Manual Program Evaluation and Review Technique (M-PERT) and Value Engineering (VE) on toll road projects.
Conclusion:
The results of research with the analysis RII reveals that 10 important factors are affecting the performance of a project. The case study using the M-PERT method obtains a value of time accuracy of 98.87% of the real duration needed on site, while the VE method results in a revenue contribution outside of the toll income of 9.38% of the construction cost.
1. INTRODUCTION
The current condition of Indonesia’s infrastructure development based on the Global Competitive Index (CGI) by the World Economic Forum in 2019 is in the 72nd spot out of 141 countries surveyed, with a score of 67.7 out of 100. The survey also placed Indonesia on the 5th rank in the ASEAN countries, far from the neighboring country, Brunei Darussalam, in the 3rd position. Improving infrastructure, particularly the development of toll roads, becomes the main goal of the Government, identified by a lot of infrastructure projects included in the National Strategic Project. Based on the National Medium Term-Development Plan (RPJMN) 2020-2024 [1], the main objective of development in Indonesia is to create an independent, advanced, equitable, and prosperous society through project acceleration in various fields by strengthening the economic structure based on the competitive advantage, which was supported by excellent and competitive human resources. Indonesia has a target to build a new toll road with a total length of 2,500 km distributed into 78 projects around the country. Factors that are always in consideration in the toll road projects are Cost, Performance, and Time.
Infrastructure can increase the economic competitiveness of Indonesia. An efficient and extensive infrastructure aims to ensure the effectiveness of the governmental economic function. The development of infrastructure is expected to expand the accessibility and improve the competitiveness of a region. This development may also integrate the domestic market with the international market with a reasonable cost and reliable time of delivery [2].
To achieve the plan of supporting the development of infrastructure, a seamless transportation network between regions has to be reached. It can be in the form of land, water, or air transportation. The toll road is one of the land transportation infrastructure which aims to accommodate the movement of people or goods from one place to another place in a relatively shorter distance and travel time. The increase in population growth leads to a lack of road network performance due to the increase in vehicle numbers of about 10-15% each year. The increase of the number of vehicles is not in balance with the increase of the road length, which is only 1.9% per year [3]. The improvement in the road network is one of the best options to reduce transport costs and improve management efficiency across the region. Based on another study [4], the Cibitung Cilincing toll road construction project, in general, has its progress of work has currently reached 60%, with the amount of land acquired already approaching 80% of the total target and the volume of construction work reaching around 63%. Along with the high costs invested in the toll road construction and a low-interest rate of return of around 7.79%, it is difficult to attract private investors to participate in the development of this particular infrastructure sector [5, 6]. This toll road development plan aimed to help the construction projects to go according to the financial plan. This research is the first to utilize M-PERT and VE to improve the performance of toll road construction works.
2. PROBLEM IDENTIFICATION
Good project management in the development phase is needed to prevent any delays both in construction and operation. Analyzing the efficiency and accuracy of the project schedule using Manual Program Evaluation and Review Technique (M-PERT) results in a project optimization of 7.55% of the expected duration [7]. Moreover, a Value Engineering (VE) optimizes the cost of construction as much as 8.32% of the initial cost [8].
The construction of toll roads is not much different from the construction of laying roads, the only difference being there are no two-wheeled vehicles using them. The findings from the analysis revealed that the traffic loading had increased accounts for up to 34% and 37% for Teuku Muhammad Hasan Rd. and Prof. Ali Hasyimi Rd., respectively [9]. In infrastructure development, there are several risk factors and uncertainties in implementing the projects. However, the aim of each toll road project shall be considered in the execution phase, where it has a recurring pattern that should be optimized both in the time management and the construction costs. In construction, structural work is usually the work with the longest duration and the highest construction cost. This applies to both upper structures and lower structures. Construction works for the upper structure; particularly the box girder works, are found to have the greatest influence out of the overall construction stages.
Therefore, the implementation of M-PERT and VE is expected to optimize the construction schedule and costs. Some assumptions used in this study are as follows:
- How to implement the M-PERT and VE method to the work of box girders on toll road projects?
- What factors affect the implementation of the M-PERT and VE method to the work of box girders on toll road projects?
- What is the result of the implementation of M-PERT and VE on the study case of box girder work on toll road projects?
3. METHODOLOGY
This section discusses the methods used in this study by analyzing the implementation of M-PERT and VE, as well as their impacts on improving the performance of box girder along with the works on toll road projects in regards to the time and costs. This section also discusses the methodology of identifying the critical success factors affecting the success of the implementation of M-PERT and VE methods in improving the time and costs of the girder box works on the toll road projects.
This research is formulated using a combination of two research methods, namely quantitative - experimental methods and qualitative methods with statistical analysis. The quantitative - experimental method is carried out by simulating the implementation of the M-PERT and VE methods on the research object, which is its implementation case study, based on the implementation procedure obtained from literature studies. Qualitative methods are applied using simulation tools in the form of RII analysis based on research instruments. This RII analysis is in the form of questionnaires distributed to selected respondents. With RII analysis, factors can be ranked from the most to the least important to the success of the implementation of M-PERT and VE methods in improving the time and costs of box girder works on toll road projects.
3.1. The Methodology of Data Collection
Two types of data are used in this study, namely, primary data and secondary data. The primary data was obtained from the questionnaire survey and focus group discussion, while the secondary data was collected from previous studies, including books, journals, previous research, and other related references to this study. The questionnaires are distributed to the respondent using both offline and online methods.
3.2. The Methodology of Data Analysis
After the data is collected, the appropriate analysis is carried out so that the results are by the objectives of the study. In this study, Microsoft Excel 2010 was used to analyze data obtained from a questionnaire survey using the RII method [10]. Meanwhile, quantitative research can be defined as scientific research carried out systematically on objects that are in the form of a relationship between one incident and another with the incident, naturally, if the hypothesis in this research is written in the form of mathematical equations or the form of a relationship between a variable and other variables.
The Relative Important Index (RII) is a term that was first published [11] as an analysis that allows a relative quantitative, where the higher the rating, the higher the influence of the variables.
3.3. Hypothesis
The hypothesis of this study is the implementation of M-PERT and VE on the girder box works on toll road projects results in the optimization of the time scheduling and the construction costs.
3.3.1. Relative Importance Index (RII) Analysis
RII is a method of analyzing the most influencing factors in the object of research. Also, this analysis method was processed by statistical calculations with the results of the questionnaire as input, which will later be processed into influencing factors. RII determines the most influential factors with ranking system based on the weight of the value given by the respondent after filling out the questionnaire. In previous research, the use of the RII method was used to determine the influencing factors in research through calculations with the following equation (Eq. 1):

3.3.2. Analysis of Implementation Manual Program Evaluation and Review Technique (M-PERT) and Value Engineering (VE)
The analysis used follows the implementation flow as shown in Fig. (1) for this implementation flowchart, as an effort to assess the improvement in time and cost performance based on M-PERT & VE on the research object.
3.4. Number of Samples
Only several respondents are chosen as sample data for the questionnaire survey. The determination of the respondents aimed to obtain an optimal result of the survey as the respondents were chosen from the professionals involved in a project. There are 6 targeted respondents in this study, which include Project Manager, Site Manager, Head Engineering, Site Engineering, Cost Control Engineer, Cost Estimate Engineer. The sample size of this survey is 45 participants, which are calculated by the following equations (Eqs. 2 and 3):


3.5. Questionnaire Analysis
The questionnaire data that have been processed in the previous stage were analyzed using validity analysis, reliability analysis, and hypothesis testing. The tests are carried out to obtain a result that meets the standards of testing. The tests carried out in this study include the Validity Test, Reliability Test, and Hypothesis Test.
4. RESULTS AND DISCUSSION
4.1. Analysis Relative Importance Index (RII)
The initial stage of the Relative Importance Index (RII) analysis is to collect questionnaire components that will be distributed to respondents. All components are compiled based on previous similar research. The questionnaire component in this study consisted of three parts, namely variables, main factors, and subfactors (Table 1). The following are the details for the questionnaire component in this study.
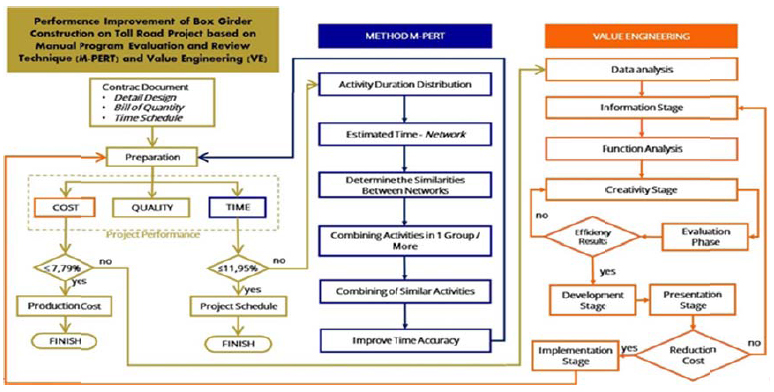
Fig. (1). Flowchart of the implementation of time and cost performance improvement based on M-PERT and VE.
Table 1.
| Variable | Main Factor | Sub Factor |
| M-PERT | 1 | 8 |
| VE | 3 | 19 |
| Structure | 3 | 18 |


In determining the most influential factors in this study, the RII analysis was used. After the number of respondents is obtained, continue to look for the most influential factors for this study based on previous literature studies as variables or questions in the questionnaire distributed to 52 respondents with the Eqs. (2 and 3) the minimum number of respondents obtained are 41 respondents. The following is for more details in Fig. (2) regarding the number of questionnaires that returned to the author and those that did not return. Whereas (Figs. 3-5) describe the position of the respondent, the respondent's work experience, and the type of project the respondent has been working on or is currently working on. The target questionnaire is aimed at planning consultants (Cost Control Engineer, Cost Estimate Engineer, and Head Engineer) and contractors (Project Manager, Site Manager, Site Engineer), where delays often occur during construction.
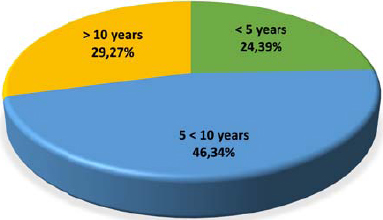

Table 1 shows the variables consisting of 7 main (Stages of Activities, Project Planning, Implementation of Development, Project Supporting Factors, Project Planning (Design), Supervision of Implementation, External Conditions) factors and 45 sub-factors. The results were obtained from the questionnaire to get the results of the factors that most influence toll road construction work based on the Manual Evaluation Program and Review Technique (M-PERT) and Value Engineering (VE). The results of the RII analysis can be seen in Table 1.
The next step is to analyze the most influential factors in the object of research using the Relative Importance Index (RII) method. The results of the RII analysis are then compiled into a recapitulation, which is presented in the form of sub-factor rankings, 10 most influential sub-factors, most influential main factor rankings, and most influential variables rankings. The results of the recapitulation of statistical analysis using the RII method, more details can be seen in the discussion below in Table 2:
| Rank | Main Factor | Sub Factor | Index RII |
| 1 | Project Planning (Design) | Drawing [12] | 0,996 |
| 2 | Project Planning (Design) | Activity Time [12] | 0,992 |
| 3 | Supervision of Implementation | Value of Work [12] | 0,988 |
| 4 | Supervision of Implementation | Presents of delay [13] | 0,984 |
| 5 | Stages of Activities | Network Simplification [14] | 0,980 |
| 6 | Stages of Activities | Combined Activities [14] | 0,976 |
| 7 | Stages of Activities | Number of Activities [14] | 0,972 |
| 8 | Project Planning | Good Planning [15] | 0,967 |
| 9 | Implementation of Development | Value Engineering Development [16] | 0,963 |
| 10 | Implementation of Development | Efficiency Cost [12] | 0,959 |
4.2. Implementasi Manual Evaluation Program and Review Technique (M-PERT) and Value Engineering
4.2.1. Manual Evaluation Program and Review Technique (M-PERT)
The explanation for the job description in Fig. (6) is in Table 3. With the creation of a predecessor network for the construction of the toll road.
Project Schedule Management covers the processes required to manage the timely completion of the project. According to PMBOK methodology, the processes are plan schedule management, define activities, sequence activities, estimate activity durations, Develop schedule and Control schedule (PMBOK® Guide 2017) [17]. Also, in this vein, some research has been connected to the crashing of PERT activities to fast-track project execution [18]. This method is a development of the PERT method (Fig. 7), which was developed by Pablo Ballesteros-Perez, Ph.D a lecturer at the School of Construction Management and Engineering, University of Reading, UK. This method was introduced in 2017 with the ability to optimize the duration of the project up to 8.8% with a bridge project [14].
At the following stages:
- Making a detailed schedule or schedule of stages of detailed work implementation.
- Calculation of the duration of each stage of work implementation.
- Schedule creation and project scheduling analysis.
- Merging stages of work implementation.
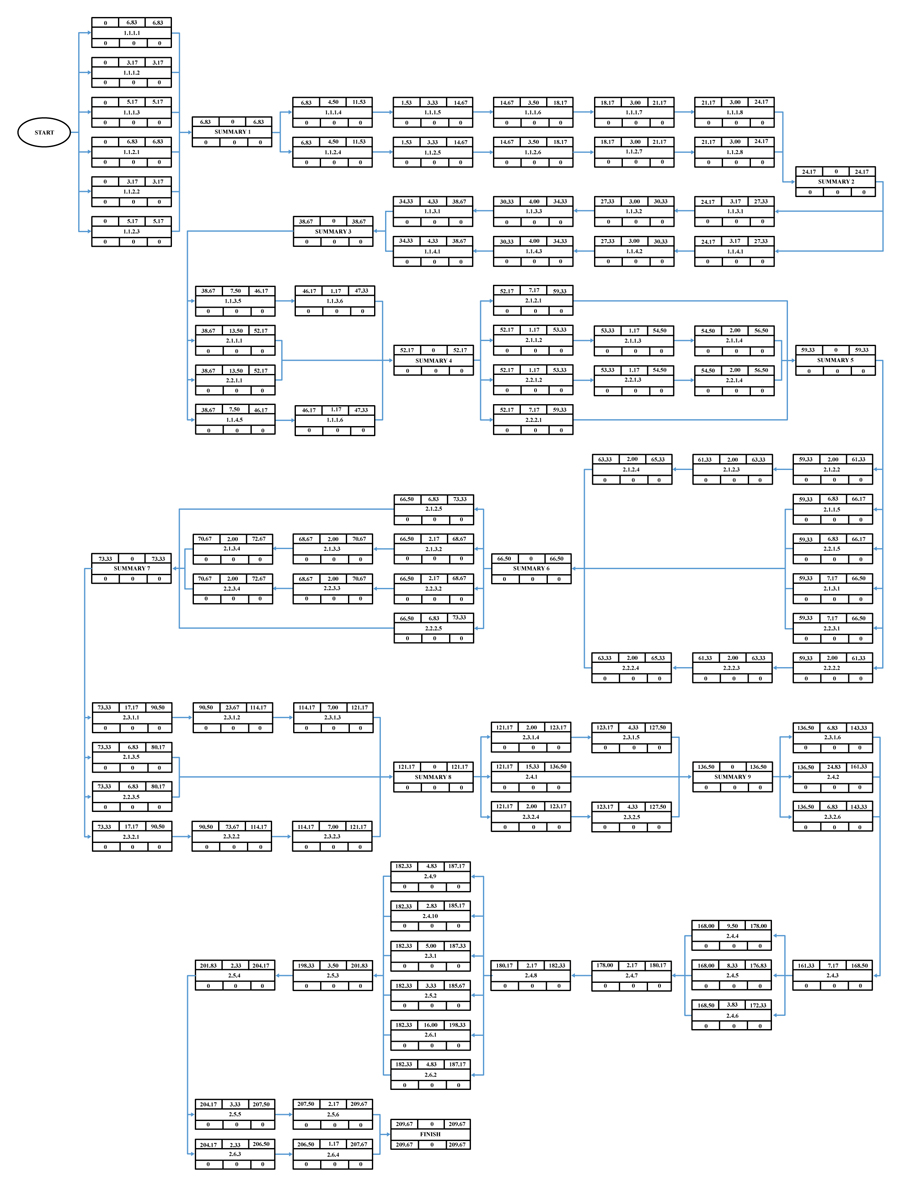
The network is the critical path because all activities have zero slack; the duration for the PERT network was obtained for 209 days with a standard deviation of 64.21 days in Fig. (3).
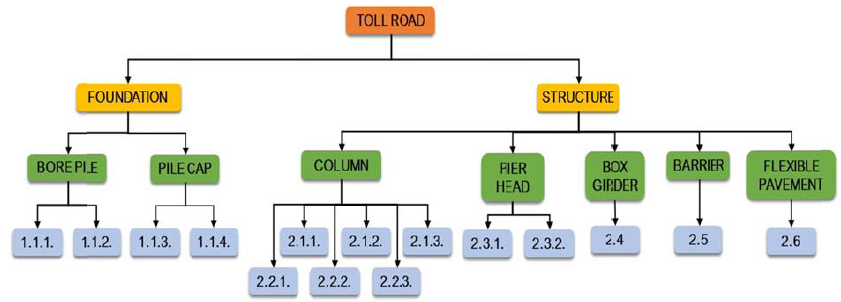
| Activity Code | Activity Description |
| 1.1.1 | Bore Pile Pier Work 1 |
| 1.1.2 | Bore Pile Pier Work 2 |
| 1.1.3 | Pile Cap Pier Works 1 |
| 1.1.4 | Pile Cap Pier Works 2 |
| 2.1.1 | Pier 1 Column Work Phase 1 |
| 2.1.2 | Pier 1 Column Work Phase 2 |
| 2.1.3 | Pier 1 Column Work Phase 3 |
| 2.2.1 | Pier 2 Column Work Phase 1 |
| 2.2.2 | Pier 2 Column Work Phase 2 |
| 2.2.3 | Pier 2 Column Work Phase 3 |
| 2.3.1 | Pier Head Work 1 |
| 2.3.2 | Pier Head Work 2 |
| 2.4 | Box Girder Jobs |
| 2.5 | Barrier Work |
| 2.6 | Flexible Pavement Work |
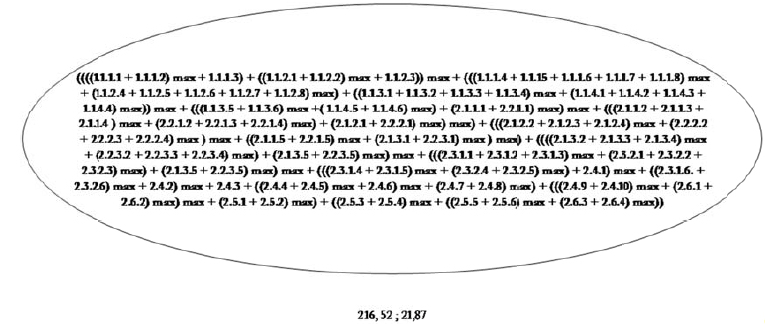
In calculating the duration of the work, balancing the estimated time between pessimistic time, moderate time, optimistic time to get the expected time with the following equation (Eq. 4):

Calculation of the variance of each activity with the following equation (Eq. 5):

Calculation of the corrected number for solving standard deviation is corrected by the following equation (Eq. 6):

By using the equation above, a simplification from the PERT diagram is obtained followed by using M-PERT (Fig. 8), which is based on the equation issued or applied by the discoverer [14] obtained as many as 5 steps for the implementation of the toll road construction. The following is a working diagram from Step 1 to Step 5 as in the following picture (Fig. 9).
With the equations and stages of using this method, the final results or summaries for job scheduling using the M-PERT method are obtained as listed in Table 4.

| Activity |
Project Schedule (day) |
M-PERT (day) | Realization (day) |
| Langkah 1 | 209 | 212,16 | 219 |
| Langkah 2 | 215,92 | ||
| Langkah 3 | 216,50 | ||
| Langkah 4 | 216,52 | ||
| Langkah 5 | 216,52 |
Moreover, the results of the analysis carried out in this study showed that the accuracy of the job execution schedule was 3.5 days or 1.13% of the 219 days of toll road construction work.
4.2.2. Value Engineering (VE)
The goal of this research is to acquire any work items that are viable to be value-engineered [19]. In some countries, it is 50% -50%. This kind of practice encourages contractors to implement VE during construction. The goal of this research is to acquire any work items that are viable to be value-engineering [20]. Construction projects are explained, and by covering Bregana-Zagreb-Dubrovnik Motorway construction in Croatia by BECHTEL - ENKA joint venture as the sample project, practices of VE in this project are described. The satisfactory results of time and cost-saving are achieved by applying value engineering principles through the VE team during the project preparation phase and project revision phase.
Approximately, 43,000,000 $ and 12 months were saved in total thanks to all these VE works. This saving provided a builder company with 6% financial saving and 17% work time reduction.
The phase begins by determining the scope of the problem from the VE study then continues by identifying the functions of the Bekasi - Cawang - Kampung Melayu Toll Road Development based on the conditions of the existing design concept, including:
- Scope of the problem under study: Bekasi - Cawang - Kampung Melayu Toll Road Development Project for infrastructure in a highly vehicle-intensive area.
- Highest order function: stimulate economic growth in Bekasi - Cawang - Kampung.
- Lowest order function: generate income.
- Design objective: build connectivity infrastructure.
- Basic function: reduce congestion in Bekasi-Cawang-Kampung Melayu
With the addition of functions on the toll road box girder, namely the addition of oil pipework, gas pipeline, fiber optic work, digital work (led boards) (Table 5). From these additions, the amount or value of the addition is obtained from several literature and brochures and the lifetime for each additional function. A lifetime of work as follows:
- Defendant function: toll road components move people and goods, road structural components distribute loads.
- Processes: build roads, build foundations, build superstructures.
This evaluation phase describes the main risk mitigation and the calculation of life cycle cost as a tool to evaluate the addition of the identified functions and explains how the mining function can add value to its function.
Creativity in this research is directed by developing functions that are integrated with their basic functions, by looking at all the potential in the toll road development area, here are the results in the creativity phase, namely the potential for infrastructure efficiency with the idea of building oil pipes, gas pipes, fiber optics, and billboards.
The results of this creativity become the material for making FAST Diagrams from the analysis of functions with the addition of Fig. (10):
- Supporting functions: oil and gas distribution, transmitting data/telecommunications, installing billboards
- Supporting Processes: oil and gas development, fiber optic development, billboards construction
With the addition of functions on the toll road box girder, namely the addition of oil pipework, gas pipeline, fiber optic work, digital work (led boards).
Based on Fig. (9) and Table 3, from each additional function work, the development value or initial cost for each addition is obtained. From the results of the calculation of the development financial analysis of additional functions, the NPV value, IRR value, and BCR value are obtained, as follows in Table 6.
From these additions, the amount or value of the addition is obtained from several literature and brochures and the lifetime for each additional function. A lifetime of work is as follows in Table 5.
With this addition, the contribution of revenues outside the toll road was 9.83% of the toll road construction costs.
| Item | Years | ||
| Oil Pipe | 15 | ||
| Gas pipe | 15 | ||
| Fiber Optic Cables | 30 | ||
| LED | 12 | ||
| Item | Initial Cost (million rupiah) | NPV (million rupiah) | IRR | BCR | ||
| Oil and Gas | 1.570.603 | 8.149.280 | 27,77% | 4,6 | ||
| Fiber Optic | 4.950 | 13.081 | 18,96% | 7 | ||
| Billboard | 1.315 | 9.210 | 19,96% | 15 | ||

CONCLUSION
Based on the results of the research that has been carried out, the conclusion are as follows:
1. How is the implementation of a time and cost performance improvement model based on the Manual Program Evaluation and Review Technique (M-PERT) and the Value Engineering (VE) method in box girder work on toll road projects? From the results of this study, the answer is that the stages of implementing the Manual Program Evaluation and Review Technique (M-PERT) are carried out by distributing activity duration, estimated time, determining similarities, and combining activities to get an increase in time accuracy and the Value Engineering (VE) method is carried out by analyzing function, stage of creativity, stage of evaluation and development, and stage of implementation in case studies.
2. What factors most influence the successful implementation of the Manual Program Evaluation and Review Technique (M-PERT) and the Value Engineering (VE) method to improve time and cost performance on box girder work on toll road projects? The factors that influence the Manual Program Evaluation and Review Technique (M-PERT) and the Value Engineering (VE) method, are Image Documents, Work Time, Work Value, Percentage of Delays, Network Simplification, Combined Activities, Number of Network Benchmarks / Number of Activities, Planning Good, Value Engineering Development, and Cost Efficiency, respectively.
3. What is the effect of the implementation of the Manual Program Evaluation and Review Technique (M-PERT) and the Value Engineering (VE) method to improve time and cost performance on box girder work on toll road projects? From the research results, it was found that the percentage of M-PERT on project scheduling was 1.13% with an accuracy of 98.87% and the implementation of VE obtained a contribution of income outside the toll road of Rp. 749,351, - / year (in million rupiah).
4. The research hypothesis as described in the meantime “Implementation of the Manual Program Evaluation and Review Technique (M-PERT) and Value Engineering (VE) methods to improve time and cost performance on box girder structure work on toll road projects can improve scheduling accuracy and cost efficiency of implementation. construction”. This hypothesis has been proven by statistical analysis and case study analysis by taking the research object on Toll Road Buildings.
CONSENT FOR PUBLICATION
Not applicable.
AVAILABILITY OF DATA AND MATERIALS
Not applicable.
FUNDING
None.
CONFLICT OF INTEREST
The authors declared no conflict of interest, financial or otherwise.
ACKNOWLEDGEMENTS
We would like to thank Albert Eddy Husin for his comments and suggestions regarding the material and for writing about the cost breakdown analysis. We also would like to thank all members of Harmony H-6 for discussion as well as support and encouragement. This research was conducted for a government that efficiency time and cost on toll road project or implementation to other projects.


