All published articles of this journal are available on ScienceDirect.

A Critique on “Measurement of the Hygric Resistance of Concrete Blocks with Perfect Contact Interface: Influence of the Contact Area”
Abstract
Background:
In March 2021, this journal published the article “Measurement of the hygric resistance of concrete blocks with perfect contact interface: influence of the contact area”. That article reports on a study on the impact of ‘perfect contact’ between concrete blocks on moisture absorption, with a focus on the impact of the sample cross-section.
Objective:
This critique aims at formulating several essential concerns on the hygric aspects of that article, thus expressing the discusser’s reservations on the reliability of the presented outcomes in particular and the published article in general.
Methods:
The data, as provided in the graphs of the critiqued article, are digitally extracted and further analysed by the discusser.
Results:
That analysis results in serious concerns with regard to 1) the magnitude of the quantified post-interface flows, 2) the distinguishability of the moisture absorption in the monolithic and perfect contact samples, 3) the robustness of the knee-point identification algorithm, 4) the dependability of the capillary absorption measurements, and 5) the consistency of the capillary absorption processing. These are finally translated into 8 concrete questions to be addressed by the authors of the critiqued article in order to placate these doubts and establish the reliability of their work.
Conclusion:
This critique formulates appreciable apprehension with respect to an earlier publication in the journal and invites its authors to respond to that via answering the 8 concrete questions. If not satisfactory, then the critiqued article’s findings cannot be considered reliable, and the journal should reconsider its prior publication.
1. INTRODUCTION
In March 2021, this journal published the article “Measurement of the hygric resistance of concrete blocks with perfect contact interface: influence of the contact area” [1]. For easy reference in what follows, this article is from here on referred to by “the article”. The article reports on a study on the influence of ‘perfect contact’ between concrete blocks on moisture absorption, with a focus on the impact of the sample cross-section. This critique on the article aims at formulating a number of serious concerns with regard to the reliability of the outcomes in particular and the article in general.
The article continues prior research of this group on interface influence [2-8] by basically applying the existing approach to another material. The interface influence is characterised by the maximum post-interface moisture flow [1-8], while other analyses generally employ an interface resistance to that goal [9-17]. A previous critique by the discusser [17] on an earlier paper [6] of this group has distinctly exposed the flawed nature of the maximum-flow-based characterisation, by showing that these post-interface flows are not necessarily constant in time and may depend on the location of the interface, the properties of the composing materials and the moisture boundary conditions employed, hence obstructing all generalisation. That same critique [17] has also shown that the post-interface flows in that earlier paper [6] cannot be considered dependable, since reproduction by the discusser (based on digitally extracted data) revealed much higher flows right after the interface passing: the flows obtained by the discusser [17] are 2 to 5 times higher than the values reported in that earlier paper [6].
Despite these formidable criticisms, the article maintains this maximum-flow-based approach for this study on perfect contact between concrete blocks. This critique on the article does not reiterate the flawed nature of the maximum-flow-based characterisation of interface impacts, as that has been aptly documented already [17]. The global conclusion is that the maximum-flow-based characterisation exclusively repre-sents the measured configuration, hence obstructing genera-lisation. This forms a first concern about the article. In what follows, it is furthermore shown that the article’s post-interface flows are once more unreliable: based upon digitally extracted data, the discusser acquires flows that are mostly above (up to a factor 4) the reported findings. This constitutes a second concern about the article. Subsequently, it is reasoned that the obtained measurement results do not allow identifying any interface influence, as the perfect contact samples’ responses are insufficiently distinguishable from the monolithic samples’ responses. It is concluded that the moisture absorption curves for the perfect contact samples do not provide definite evidence for any interface influence, yielding a third concern about the article. Finally, it is shown that the knee-point identification, used to mark the moment of interface passing, crucial for the following estimate of the post-interface flow, may depend on the extent of the data set involved, thus rendering it non-robust. A shorter data set shifts the knee point to the left, whereas a longer data set moves it to the right, with, of course, critical effects on the post-interface flows. This then indicates a fourth concern about the article.
After that, the attention of this critique on the article turns to the capillary absorption tests themselves, a central element for all hygric facets of the article. Most crucially, it is suggested that the swift initial absorption in and the large spread of the moisture absorption curves may indicate a flaw in the test execution: the tape enclosing the sample goes all the way down to the moisture contact surface at the bottom, which enables unintended moisture adsorption between tape and sample [18], spoiling the entire test, revealing a crucial fifth concern about the article. Ultimately, the deviation between moisture absorption curves in the article’s Fig. (3) and moisture absorption parameters in the article’s Table 4 is debated. It is displayed that the capillary absorption coefficient very poorly represents the actually measured moisture absorption. However, more importantly, the measurements and parameters seem to disagree, and this is a final sixth concern about the article.
In what follows, the attention first goes out to the concerns regarding the perfect contact samples, and subsequently, the focus turns to the concerns involving the monolithic samples. In the discussion, this critique concludes that all hygric facets of the article are subject to concern and invites its authors to appease these concerns in their reply. If unsuccessful, though, then this critique suggests having the article retracted from the journal to avoid confusing readers. The COPE (Committee on Publication Ethics) guidelines on retraction [19], subscribed to by this journal, distinctly mention that “editors should consider retracting a publication if they have clear evidence that the findings are unreliable”. If the article’s authors cannot satisfactorily placate the doubts expressed in this critique, then their findings can, in the opinion of the discusser, not be considered reliable.
2. INTERFACE INFLUENCE IN PERFECT CONTACT SAMPLES
In this section, the attention centres on the concerns regarding the perfect contact samples, explicitly voicing doubts on the magnitude of post-interface flows, the distinguishability of interface impacts, as well as the robustness of knee-point identification. Thereto the discusser temporarily needs to suppose that the measured capillary absorption curves, for both monolithic and perfect contact samples, are correct. The implausibility of that premise is discussed in section 3.
2.1. Magnitude of Post-interface Flows
In essence, the determination of the post-interface flows requires two steps: identifying the knee point in the moisture absorption as the moment of interface passing and quantifying the moisture absorption after that knee point as the post-interface flow. A simple outline of both steps is provided in Fig. (1) (grey lines): the full line represents the monolithic behaviour and hence the expected behaviour up to the interface, the dashed line illustrates the expected slower moisture absorption after passing the interface. The first divergence from the monolithic behaviour marks the knee point, and the slope of the moisture absorption curve yields the post-interface flow [2, 8, 20]. It should be noted, though, that this idealised response (clearly defined knee point and constant flow after that) is not generally observed. It was seen in the measurements reported in the seminal paper on this phenomenon [2], as well as in the “air space” and “perfect contact” configurations in an earlier paper [6], but, e.g., not for the hydraulic contact cases in that earlier paper [6] and nor for the perfect contact cases in the article. Fig. (1) (coloured markers) represents the article’s measurements of perfect contact at 12 cm in 10 x 10 cm2 samples, for which the identification of the knee point and the quantification of the post-interface flow are much less straightforward. While the authors have proposed a knee-point identification algorithm to assist the former, their method for the latter remains vague: “the slope of the mass variation curve as a function of time, after the knee point” [20]. Given that this declaration is preceded by a sketch similar to the one in Fig. (1) (grey lines), the discusser can only assume that the article’s authors still postulate a constant flow after the interface. It was clearly shown in the earlier critique [17] though that this is not generally valid, and a similar verdict is established below for the article, demonstrating that its hygric resistance values are not dependable.
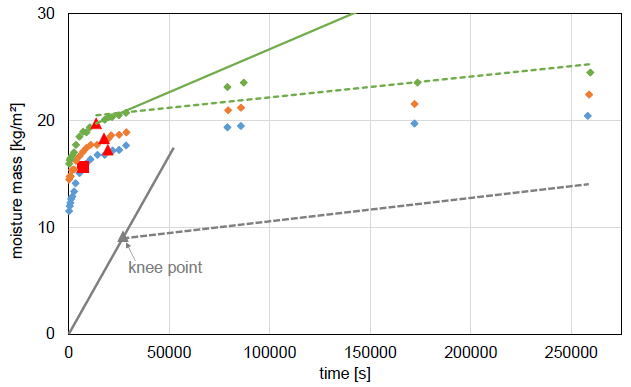
The discusser has digitally extracted the data for the 18 perfect contact moisture absorption curves in the article and has then identified the knee points and quantified the post-interface flows. For the knee-point identification, the first out of three algorithms described in the related paper [20] is applied since this is easiest to implement. These three algorithms can be concisely described as follows:
- The first connects the first and last data point with a straight line and identifies the knee point as the point furthest away from that line;
- The second splits the moisture absorption curve into two parts, before and after the knee point, and fits separate straight lines to both parts. The point that gives the smallest total deviation between these two lines and the data points is identified as the knee point;
- The third combines the two methods above and targets a compromise between the outcomes of both;
For the post-interface flow quantification, at first, the slope of all data points from the knee point onward is calculated, and alternatively, the slope of four data points from the knee point onward. Exceptionally, for 2 out of 18 cases, this yields a negative flow, and then six data points from the knee point onward are adopted for the slope fitting. An example of the two fits is shown in Fig. (1), which immediately makes clear that the post-interface flow is not a constant, given that the slope of the full line (four points) is higher than that of the dashed line (all points).
Table 1 presents an overview of the findings: the third column contains the average hygric resistance as reported in the article, the fifth and seventh column comprise the average hygric resistances based on all and four (six) points (from the knee point onward), respectively, as calculated by the discusser. All in all, the discusser’s ‘all points’ findings roughly concur with the article’s results, implying that its authors most probably used all points after the knee point for their post-interface flow quantification. Fig. (1) reveals, though, that this method underestimates the post-interface flow, given that that flow declines over time, as was demonstrated in the earlier critique [17]. Table 1 settles this more generally, as the flows based on four (six) points are a factor 1.4 to 3.5 higher than the flows reported in the article. This is, of course, logical: that ‘long-term’ flow is not only influenced by the interface influence, but also by the flow resistance of the material above the interface, while the ‘short-term’ flow is nearly exclusively affected by the interface resistance, as should be the case.
It must be remarked here that these factors are most likely conservative still since they depend on the knee-point location. According to the related paper [20], the third knee-point identification algorithm, used in the article, always finds a point that is more to the left relative to the first algorithm that is used here. Fig. (1) then confirms that this would lead to even higher flows right after the interface passing, and these higher flows would further increase the actual hygric resistance values and the ratios in Table 1. This only strengthens the conclusion that the article’s hygric resistance values based on post-interface flows are (once again, see the earlier critique [17]) too small and therefore unreliable.
Table 1.
| - | - | Averages [1] | All Points | Averages | 4 (6) Points | Averages | Ratio |
|---|---|---|---|---|---|---|---|
| 5 x 5 cm2 | 12 cm | 1.66 | 1.63 | 1.71 | 5.44 | 4.08 | 2.5 |
| 1.68 | 4.49 | ||||||
| 1.84 | 2.32 | ||||||
| 9 cm | 1.68 | 1.77 | 1.60 | 1.96 | 2.42 | 1.4 | |
| 2.07 | 2.86 | ||||||
| 0.95 | 2.44 | ||||||
| 7.5 x 7.5 cm2 | 12 cm | 1.65 | 1.17 | 1.10 | 1.38 | 2.31 | 1.4 |
| 1.66 | 4.84 | ||||||
| 0.49 | 0.70 | ||||||
| 9 cm | 1.41 | 1.52 | 1.72 | 1.90 | 3.81 | 2.7 | |
| 2.05 | 5.08 | ||||||
| 1.60 | 4.44 | ||||||
| 10 x 10 cm2 | 12 cm | 1.77 | 1.37 | 1.69 | 4.52 | 5.93 | 3.5 |
| 1.76 | 5.22 | ||||||
| 1.95 | 8.05 | ||||||
| 9 cm | 1.62 | 1.45 | 1.30 | 3.67 | 3.30 | 2.0 | |
| 0.49 | 3.56 | ||||||
| 1.82 | 2.67 |
2.2. Distinguishability of Interface Impacts
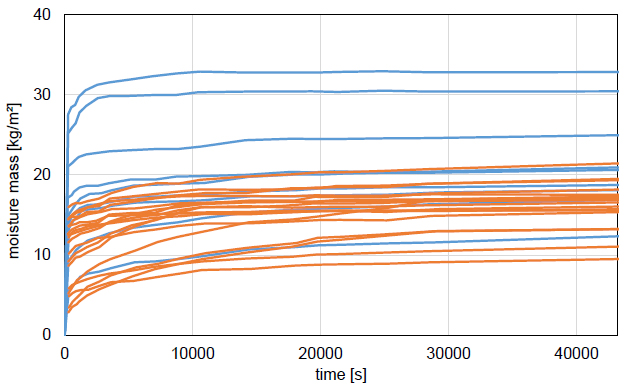
The previous section has demonstrated that the article’s hygric resistance values are incorrect, thereto accepting that the perfect contact moisture absorption curves indeed comprise an interface influence, while the monolithic moisture absorption curves should not contain such influence. In this section, however, that premise is put into question by showing that the behaviours of monolithic and perfect contact samples are not sufficiently distinguishable. Introductorily, Fig. (2) gathers all moisture absorption curves for both monolithic (blue) and perfect contact (orange) samples. These curves are, however, only shown for the first half-day of the three-day measurement interval, as all knee points identified above are located in a time interval spanning from roughly 2.5 to 8 hours. The discusser infers that if no colour distinction would have been made between both classes of samples, no reader could actually differentiate them. Therefore, Fig. (2) shows that the monolithic and perfect contact samples do not behave very differently, challenging the assertion that the perfect contact samples reveal a manifest interface influence. Such manifest influence was indeed obtained in earlier studies [2-8], but the observations in the article are a lot more confused: apart from the fact that the moisture absorption in the perfect contact samples does not reach the highest moisture masses, the evolutions of the moisture absorptions appear (very) similar to these of the monolithic cases. A similar finding is, by the way, true for the rest of the test interval.
To further establish the overly similar nature of the moisture absorption in monolithic and perfect contact samples, the discusser has identified knee points and quantified post-interface flows for the monolithic samples. This is, of course, an abstract exercise, given that these samples should not be influenced by an interface, but it highlights the similarity from another angle. Fig. (3) gathers the time points of the knee points as well as the magnitudes of the post-interface flows, for monolithic (blue) and perfect contact (orange) samples.
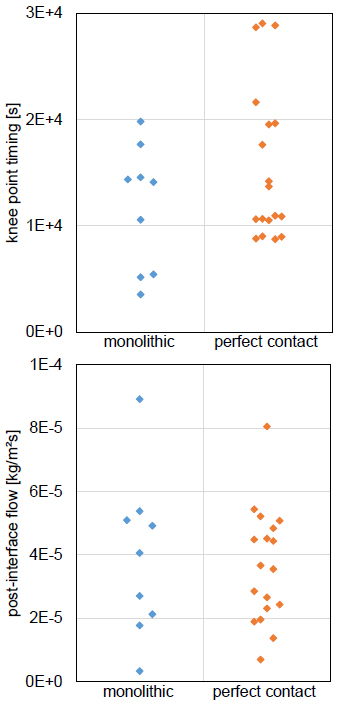
With respect to the ‘post-interface flows’, Fig. (3) (right) illustrates that these are very similar for the monolithic and perfect contact samples. Given that the monolithic samples are not affected by interface influences, it must be deduced that the perfect contact samples actually do not provide definite evidence for an interface influence. In relation to the knee-point time points, again, significant similarity is found between monolithic and perfect contact samples, but it can also be noted that, on average, the knee points are reached a bit slower in the perfect contact samples, which is strange. The knee point for the monolithic samples should identify the time at which the 15 cm high top of the sample is reached, while it should indicate the time at which the 12 cm or 9 cm high interface is reached for the perfect contact samples. The latter should theoretically be shorter than the former: if a square-root-of-time behaviour is assumed, reaching the interface at 9 cm and 12 cm, respectively, should take 36% and 64% of the time needed to get to the 15 cm monolithic top. Again, it must be derived that the perfect contact samples actually do not provide definite evidence for an interface influence. This translates to the conclusion that the article’s authors may have identified knee points and quantified post-interface flows for the perfect contact samples but that these do not undeniably establish any actual interface influence. This then yields the conclusion that the article’s measurements are probably not appropriate for the intended analysis.
2.3. Robustness of Knee-point Identification
Provisionally assuming that the perfect contact samples are affected by interface influences, this section ends with establishing the non-robustness of the knee-point identification algorithm, thus boosting the unreliability of the article’s post-interface flows even further. In sections 2.1 and 2.2, knee points were identified based on the first algorithm of the related paper [20], and these are indicated with the red triangles in Fig. (1). For that identification, the origin and the measurement point at 3 days (259200 s) were used as the extreme points for the straight-line basis. For the blue moisture absorption curve, this gave a knee point at about 19000 s and a post-interface flow (four points) of 4.52∙10-5 kg/m2s. However, it is easy to understand that use of a longer/shorter interval would move that knee point to the right/left, and hence would lead to different post-interface flows. Illustratively, Fig. (1)’s blue curve is reanalysed with the origin and the 1-day measurement point (86400 s) as extreme points. This leads to a knee point at roughly 7200 s, see the red square in Fig. (1), and a post-interface flow (four points) of 15.6∙10-5 kg/m2s, more than three times higher than the prior value of 4.52∙10-5 kg/m2s, and nearly nine times over the average value of 1.77∙10-5 kg/m2s reported in the article. The first knee-point identification algorithm hence appears non-robust. A similar outcome of non-robustness can be inferred for the second algorithm: a shorter interval would involve fewer data points located at the right-hand side of the knee point, thus decreasing the overall deviation between these data points and the fitted line. This would force the final knee point to the left and hence increase the post-interface flow. As the third algorithm is a mix of the first two, the overall conclusion is that the articles’s knee-point identification, and therefore its post-interface flow quanti-fication, is likely not robust.
3. CAPILLARY ABSORPTION IN MONOLITHIC SAMPLES
In this section, the attention focuses on the concerns regarding the monolithic samples, explicitly voicing doubts on the execution and processing of the capillary absorption tests. The first issue is, however, also relevant for the perfect contact samples, which may be plagued by similar shortcomings.
3.1. Execution of Capillary Absorption Tests
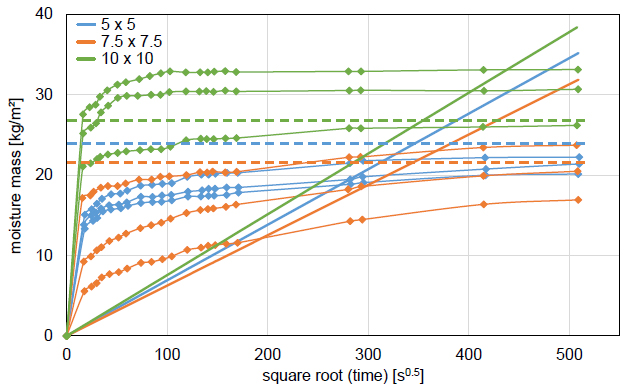
As an opening topic of the article, the capillary absorption into monolithic samples is investigated, wherein the impact of the sample cross-section is the crucial aspect. Therefore capillary absorption tests on 15 cm high monolithic concrete samples, with cross-section 5 x 5 cm2, 7.5 x 7.5 cm2, 10 x 10 cm2, are performed. The results of these are depicted in the article’s Fig. (3), albeit that the figure only includes three samples for each cross-section, whereas Table 1 stipulates four samples per cross-section. However, given that the authors formally declare that “the data supporting the findings of this study are available within the article”, it is presumed that the article’s Fig. (3) contains all available data. The data in that figure have been digitally extracted by the discusser and are shown in Fig. (4) below (full lines with markers).
Two significant observations can immediately be made. Firstly there is a (very) large spread on the results, with the moisture mass after 72 hours (√time: 509 s0.5) spanning from 17 to 33 kg/m2 and the moisture mass after 1 hour (√time: 60 s0.5) going from 8 to 32 kg/m2. Also, the moisture absorption curves show a very peculiar pattern, which strongly deviates from the normal square root-of-time behaviour, due to a major absorption stage happening within the first test interval of 5-6 minutes. For the 10 x 10 cm2 samples, for example, the moisture masses absorbed in this short interval represent more than 80% of the final moisture mass absorptions. In other words, this first phase translates to an oddly large capillary absorption coefficient of about 1.5 kg/m2s0.5.
With regard to the spread of the results, the article’s authors could argue that the lab-made concrete is simply very heterogeneous. However, several studies on capillary absorption by lab-made concrete [21-23, among others] obtain much more consistent lab-made concrete samples and moisture absorption curves. With regard to the peculiar absorption pattern, one could argue that concrete is known to deviate from the normal square-root-of-time behaviour [21], although never as strongly as seen here. Besides, other studies obtain much more standard moisture absorption in concrete [22, 23, among others].
A much more plausible explanation for both observations can be found in the article’s Fig. (2), illustrating the samples used in the capillary absorption tests. The photographs reveal that the taping, applied to limit evaporation, runs down to the moisture contact surface, while it is common practice to have it end 1 cm above that surface [21] to avoid undesired moisture absorption between tape and sample. This flaw could explain the swift initial stage as well as the large spread of the capillary absorption curves. The discusser is, of course, aware that this assertion remains hypothetical, and therefore remains open to other plausible explanations for these two observations. He is reluctant to accept, though, that the article’s Fig. (1) accurately represents the moisture absorption behaviour of the monolithic concrete samples. If the execution of the capillary absorption tests is flawed indeed, then this flaw undermines all hygric research findings in the article, as they are all based on these tests.
3.2. Processing of Capillary Absorption Tests
A second aspect of the article is the processing of the capillary absorption tests on monolithic samples to NBR’s ‘capillarity absorption’ C [g/m2] or ISO’s ‘capillary absorption coefficient’ Aw [kg/m2s0.5], the results of which are collected in the article’s Table 4. The C parameter should have been obtained from the moisture absorption after 72 hours (√time: 509 s0.5) and can thus be recalculated to the final moisture mass [kg/m2] by multiplying C with 10. The findings (averaged per cross-section) are included in Fig. (4) (dashed lines). It is evident that the depicted results do not correspond with the averages of the final moisture masses obtained in the capillary absorption tests. Fig. (4) (full lines) finally also depicts the moisture mass absorption as predicted based on the Aw values in the article’s Table 4. While it should initially be remarked that these predictions give a (very) poor representation of the measured moisture absorptions, it should more critically be mentioned that an alignment with the measurements is hard to discern.
This is numerically established in Table 2 below. The second, third, and fourth columns, respectively, show the reported C-values, the measured moisture mass absorptions after three days, and the averages of the latter. There obviously are inconsistent deviations between the second and fourth columns, resulting in the question of how the article’s C-values have been calculated. The fifth, sixth and seventh columns, respectively, show the reported Aw-values, the measured moisture mass absorptions after one day, and the averages of the latter. The mentioned deviations are the relative differences between the averaged moisture mass after one day and the prediction of that based on Aw. The deviations are inconsistent again, resulting again in the question of how the article’s Aw-values have been calculated. It has to be noted that similarly inconsistent deviations are found for time points other than ‘one day’. The discusser is not able to provide explanations for the discussed deviations in relation to C and Aw. He can only note that the roughly similar values presented in the article’s Table 4 together with their mentioned coefficients of variation of “approximately 15%” instil a notion of acceptable homogeneity, contradicted, however, by the widespread found in Fig. (4).
|
Cross-Section [cm2] |
C [1] [g/cm2] |
Moisture Mass @ 3 days [g/cm2] |
Averages (& Deviation from C-value) |
Aw [1] [kg/m2s0.5] |
Moisture Mass @ 1 day [kg/m2] |
Averages (& Deviation from Aw-value) |
|---|---|---|---|---|---|---|
| 5 x 5 | 2.407 | 2.01 | 2.13 (-12%) |
0.0691 | 19.1 | 20.2 (-1%) |
| 2.14 | 19.8 | |||||
| 2.22 | 21.8 | |||||
| 7.5 x 7.5 | 2.141 | 1.69 | 2.04 (-5%) |
0.0626 | 14.5 | 18.4 (0%) |
| 2.05 | 18.6 | |||||
| 2.37 | 22.2 | |||||
| 10 x 10 | 2.677 | 2.62 | 3.00 (+12%) |
0.0756 | 25.8 | 29.8 (+34%) |
| 3.07 | 30.6 | |||||
| 3.31 | 32.9 |
4. DISCUSSION
The study above formulates several serious concerns regarding the article “Measurement of the hygric resistance of concrete blocks with perfect contact interface: influence of the contact area” [1], concretely with respect to 1) the magnitude of the quantified post-interface flows, 2) the distinguishability of the moisture absorption in the monolithic and perfect contact samples, 3) the robustness of the knee-point identification algorithm, 4) the dependability of the capillary absorption measurements, and 5) the consistency of the capillary absorption processing. The article’s authors are therefore invited to placate these concerns in their reply, and particularly these 8 questions should be addressed:
- Section 3.1 discusses the peculiar evolution of the moisture mass absorption for each of the monolithic samples, as well as the large variation of the moisture mass absorptions for all of the monolithic samples. Can the authors explain this unusually large spread in the measurements? One could attribute this to material inhomogeneity, but this should then be verified with independent data, for example, porosities obtained from vacuum saturation testing. Can the authors clarify the surprisingly fast moisture absorption during the first 5-6 minutes? One could attribute this to large pore radii, but this should then be verified with independent data, for example, pore volume distributions obtained from mercury intrusion porosimetry. Can the authors establish that the full taping of the samples has not lead to spurious absorption between sample and tape? This can be verified by repeating the capillary absorption tests with an incomplete taping [18].
- Section 3.2 debates the inconsistency between the capillary absorption measurements and the capillary absorption parameters C and Aw. Can the authors clarify how their C- and Aw-values have been obtained and thereby corroborate that these correctly concur with the measured results?
- Section 2.2 suggests that the moisture absorptions in the perfect contact and monolithic samples cannot fundamentally be distinguished, hence asserting that the moisture absorptions for the perfect contact samples do not provide definite evidence for interface impacts. Can the authors concretely ascertain that their perfect contact measurements do indeed reveal an interface impact?
With respect to this, it should be remarked that this bullet is only relevant if the first bullet can be adequately resolved, given that this distinction only makes sense if the capillary absorption measurements are dependable.
- Section 2.1 addresses the quantification of the post-interface flows, concluding that they appear under-estimated, plausibly because the authors have used all data points from the knee point onward instead of using on the data points just after the knee point. Can the authors defend their approach, certainly in light of the non-constant nature of these post-interface flows, as shown here and in the earlier critique [17]? Moreover, can the authors explain how their hygric resistance values would allow generalisation, hence permitting application in configurations different from the experimental one, as also discussed in the earlier critique [17].
- Section 2.3 exposes that the knee-point identification may not be robust, given that it is affected by the length of the data set involved. Can the authors nullify this claim by demonstrating that their algorithm gives the same knee point, independent of the length of the considered data set?
In relation to this, it should be noted that the authors could reason that their related paper [20] has established the functionality and reliability of the knee-point identification. That study confronted manually calculated hygric resistances with automatically knee-point-based determined hygric resistances (for the ‘hydraulic contact cases’ from an earlier paper [6]) and used the good agreement between both data sets to conclude that the knee-point-identification algorithm is indeed functional and reliable. The earlier critique [17] has, however, shown that a large part of these manually determined reference values for the hygric resistances are incorrect, and this, of course, invalidates the agreement reported in the related paper [20]. This suggests that the robustness of the knee-point identification algorithm is still a question mark.
CONCLUSION
In March 2021, this journal published the article “Measurement of the hygric resistance of concrete blocks with perfect contact interface: influence of the contact area” [1]. This critique voices several critical concerns on the hygric facets of this article, with regard to 1) the magnitude of the quantified post-interface flows, 2) the distinguishability of the moisture absorption in the monolithic and perfect contact samples, 3) the robustness of the knee-point identification algorithm, 4) the dependability of the capillary absorption measurements, and 5) the consistency of the capillary absorption processing. The discusser thus invites the article’s authors to placate these doubts in their reply, as reliably refuting these doubts will underline the validity of the article’s claims in relation to capillary absorption testing, knee-point identification, and post-interface flow quantification. If not successful, however, then the journal should reconsider its prior publication of the critiqued article. Such suggestion for a retraction is in line with the COPE (Committee on Publication Ethics) guidelines on retraction [19], adhered to by this publisher. These guidelines clearly state that “editors should consider retracting a publication if they have clear evidence that the findings are unreliable”. If the article’s authors cannot satisfactorily soothe the doubts formulated in this critique, then their findings cannot be considered reliable.
CONSENT FOR PUBLICATION
Not applicable.
AVAILABILITY OF DATA AND MATERIALS
The data that support the findings of this study are available from the author [H.J.], upon reasonable request.
FUNDING
This research was in part supported by the FWO Odysseus grant (G.0C55.13N).
CONFLICT OF INTEREST
The authors declare no conflict of interest, financial or otherwise.
ACKNOWLEDGEMENTS
The support by the FWO Odysseus grant is gratefully acknowledged.

