All published articles of this journal are available on ScienceDirect.

Analytical Optimization Model to Locate and Design Runway-Taxiway Junctions
Authors Info & Affiliations
Abstract
Aims:
Air traffic and airport operations are expected to experience significant growth worldwide in the upcoming years. One of the possible approaches to adapt to this demand-led growth in the sector, while guaranteeing optimal levels of airport services and operations safety, is to maximize the capacities of busy airport infrastructures (in particular runways) by evacuating them in the shortest time possible to be ready for hosting next operations.
Background:
The main research areas in this field range from statistical risk analyses based on the registered accidents databases to simulation analyses modelling the behaviour of the aircraft during landing operations.
Objective:
The main objective of this study is to determine precisely the optimal distances of runway-taxiway junctions from the runway’s threshold, according to numerous impact parameters such as airport climate pattern, operating aircraft categories, infrastructure type, and capacity, route connections, operating costs, and associated risks.
Methods:
The authors developed a mathematical model with the goal of simulating the dynamic behaviour of the aircraft during landing and possible consequences introduced by the presence of contaminants over the pavement surface, by calculating their braking distances, and finally to optimize the use of existing infrastructures, specially runway-taxiway junctions, of a commercial airport. In this regard, the interactions between landing gear, pavement, and fluid were carefully analysed. The dynamic pavement skid resistance values in wet pavement conditions were evaluated for optimizing the required landing distances, which are setting the base for optimizing the location of the taxiway junctions. An Italian international airport was selected as the case study to be simulated by the developed model in order to optimize its runway capacity and maximize its rate of operations.
Results:
In the process, two different scenarios are simulated with the developed model; a modified design of an existing runway and an alternative design solution for constructing a new runway. The developed model offers improvements for both scenarios with respect to the current runway configurations in terms of reduction in mean rolling distances. The simulation of the selected case study shows that the taxiway modification scenario achieves a reduction of 23% in the mean rolling distance for wet and 25% for dry pavement conditions. While, for designing a new runway, greater reductions of 27% for wet and 39% for dry pavement conditions are obtained due to the higher flexibilities and degrees of freedom in designing a runway from the beginning.
Conclusion:
The developed model can precisely propose new configurations of the runway-taxiway junctions with lower mean rolling distances, which lower the operation costs and fuel consumption, decrease the runway evacuation times and increase the capacity of the airfield. The main advantage of this model is its ability to cover a wider spectrum of boundary conditions with respect to the existing models and its applicability for designing new runways, plus to optimize the configuration of existing infrastructures in order to satisfy the evolution of the industry.
1. INTRODUCTION
Over the last decades, the evolution of humankind has been marked by a globalized trend which has led to the creation of strong international connections present in all sectors of society. Air transport is a relevant contributor to this environment, providing a large and efficient connection network operating between the airports of different countries.
According to International Air Transport Association (IATA), air traffic is expected to grow, matching the customer's demands, with the continuous trend, doubling the air passenger journeys by the end of the next twenty years [1]. This growth will have a major impact on all infrastructures and variables involved in aircraft operations [2].
In this regard, one of the main aspects to be evaluated is the safety of operations inside the runways and their efficiency, which determines the volume of airport operations [3]. Airports are needed to enhance the efficiency of their runways, maximizing the runway capacity and minimizing the associated risks and costs [4]. Therefore, airports infrastructures, which are limited by the service life of their current runways and taxiways, need to be re-evaluated to provide new optimized solutions marked by the necessity to satisfy the increasing number of passengers. Thus, the runway's design along with the junction connections to the taxiways should be evaluated for future required modifications. Based on their distribution, these connections have a significant impact on the average runway evacuation time after landing.
Accidents associated with landing operations are more frequent compared to other phases of flight [5,6]. Accordingly, this study provides an insight on the analysis of landing operations, conceived as one of the main phases of flights that affects the final design of the runway. For this matter, it is necessary to analyse the physical principles behind landing operations, which determine the design requirements, in order to achieve a fully efficient solution to meet the current and future demands of transportation.
In other words, optimizing the position and the distribution of runway exits would have a major impact on the capacity of airport infrastructures, leading to an overall reduction of operations derived times and costs.
In order to achieve the main objective of this study, which is increasing the capacity of busy airport infrastructures (e.g., runways), the dynamic behaviour (i.e., skid resistance, friction coefficient, etc.) of aircraft during landing is investigated and simulated based on an iterative Euler calculation method through the proposed model. Two generations of studies are available according to the literature, which calculate the friction coefficient for contaminated runway (e.g. wet pavement); experimental techniques [7-13], and analytical models [14-19]. Based on their advantages and restrictions, which are explained in the following chapter, the concept of the analytical model is selected as the foundation of this study and got upgraded to satisfy the current operating conditions. The model is also validated by experimental data from the literature in order to prove its accuracy and suitability to be adopted in the analysis.
With respect to the existing models, the proposed model covers a wider spectrum of boundary conditions (water-film thicknesses, wind forces, operating aircraft categories). Another advantage of this model is its applicability for designing new runways, plus for optimizing the configuration of existing infrastructures in order to satisfy the evolution of the industry.
2. LITERATURE REVIEW
Landing is considered one of the most critical runway-related operations due to the great range of variables involved that need further attention. The main research areas in this field range from statistical risk analyses based on the registered accidents databases to simulation analyses modelling the behaviour of the aircraft during landing operations [7]. This study focuses more on the physical aspects behind landing operations, which are influenced by a wide range of variables such as current airport design, operation boundary conditions, and weather scenarios. These variables can modify Landing Distance Available (LDA) on which the designs of the runway and related taxiways are based.
Aircraft behaviour in landing is influenced by the interactions between the main gear tires and runway pavement. These interactions have been thoroughly studied, trying to explore all their aspects in order to accurately model the physical parameters for predicting aircraft behaviour under different circumstances. For this matter, two generations of approaches are available in the literature are experimental techniques and analytical models, as discussed below.
2.1. Experimental Techniques (First Generation)
The first generation of studies tried to comprehend the dynamic behaviour of skid resistance and hydroplaning phenomenon, parting from an experimental nature. A great amount of these attempts has been published since the 1920s conducted by Horne et al. [7, 8, 11], Sinnamon et al. [9], Fwa et al. [10], Gallaway et al. [12], where the different factors involved in the friction between tire and pavement were carefully evaluated through numerous tests. The most common approach, as explained in [10], was to relate the pavement friction efficiency to vehicle speeds and pavement texture by performing particular field tests conducted under pre-defined boundary conditions. Due to different scenarios in which aircraft operations can take place, many of these studies evaluate the braking performance of aircraft in the rain, snow, ice, or slush-covered runways [7,11,12]. The effects induced by these conditions have continuously proven to diminish the pavement friction characteristics. Additionally, the presence of fluid layers over the pavement affects the braking efficiency by introducing new interactions with the landing gear. These experimental studies managed to provide theoretical expressions (e.g. tables and figures) through which these interactions can be evaluated. Their main limitation is that their results are tightly bounded to a strict range of values, therefore, if the boundary conditions of a landing operation changes to those values out of their data coverage interval, no precise results will be obtained.
Despite the experimental character, they provide an accurate portrayal of surface friction behaviour and the influence of parameters of importance on hydroplaning phenomenon, as they were deeply analysed previously by Horne et al. [7,13]. This way, they have set an experimental basis, serving as a validation reference for most of the current researches focused on the development of simulation models.
2.2. Analytical Models (Second Generation)
The second generation of studies tried to expand the limitations of experimental techniques by predicting pavement friction based on analytical models derived from experimental data. In this analytical field, there are numerous studies addressing the different phenomena involved in the tire-pavement interaction. Analogously to the experimental techniques, these approaches generally include the effects of pavement contaminants in modelling the aircraft behaviours in landings. Most recent studies focused on the development of analytical models, expanding the range of applicability of those of experimental approaches, since lack of enough information on the parameters involved in the computations are the main restriction of experimental methods. The results, which can be obtained from the experimental studies, are tightly bounded to a strict range of values of speed, tire pressure and water-film thickness. Consequently, it will lead to major difficulties when the same approaches are extrapolated to other areas of interest with values that fall out of range of those adopted by the original studies. Thus, it is the aim of the analytical models, to extend those limitations allowing to reach a deeper understanding and evaluate the influence of the parameters involved.
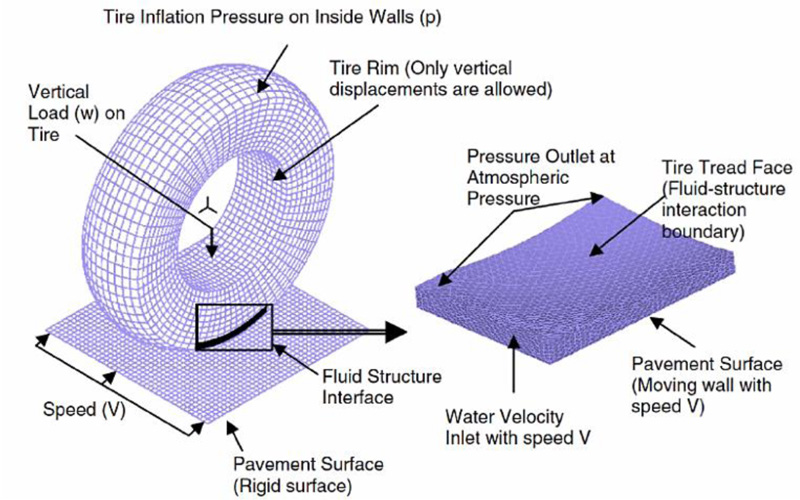
The models available in the literature, such as those presented by Ong and Fwa [14,15], propose a three-dimensional approach based on Finite Element Analysis (FEA) using computational simulation software such as ADINA, FLUENT or ANSYS. These 3D models commonly integrate three sub-models of fluid, tire and pavement, to simulate all the forces applying on the aircraft main gear (et al. uplift and drag forces), as presented in Fig. (1). Therefore, the behaviour of pavement friction can be predicted by coupling the effects of these sub-models and their characteristics.
These models have been widely used with different purposes allowing to study and understand other phenomena and their influence in the overall simulation. All studies based on analytical models focused on different aspects of the same interactions providing a deeper insight of the relations between the sub-models of tire, fluid, and pavement through their characteristics and have been improved along some secondary studies showing alternative solutions to the problems [16,17]. The final goal of these complementary studies was to lead to the determination of an accurate analytical model, which allows to apply the simulation to actual problems which are triggered by landing operations similar to the scope of this study. Currently, some research studies have been published using these analytical models in the computation of aircraft landing distances, such as those described by Pasindu et al. [18,19] which have been thoroughly reviewed in order to set the base of this study.
In this study, in order to simulate the dynamic behaviour of aircraft during the landing, one analytical model as the second generation of studies existing in the literature is adopted. Since the adopted model could only simulate the landing operation in limited boundary conditions, additional improvements have been carried out on to expand the spectrum of the simulations (e.g., plausibility of simulations for various water-film thicknesses, wind forces, operating aircraft categories, etc.). After that, the upgraded model combined into a computational model in order to calculate the aircraft braking distance during the landing. Finally, a complementary optimization algorithm is added in order to determine the optimized position of runway exits.
3. METHODOLOGY
It is fundamental to determine a model, which connects all the principles governing the landing operations and the physical characteristics of tire, fluid and pavement. Most research studies dedicated to understanding these interactions used the conclusions obtained from different analyses to properly evaluate the behaviour of various aircraft tires after runway touchdown. Nowadays, experimental techniques are being used by engineers to predict the values of skid resistance [10]. These are commonly used due to their simplicity and the lack of numerical and analytical models. Moreover, as mentioned before, some recent finite element analysis models are being introduced to be adopted for the simulations. However, due to high complexity entailed, experimental techniques have been considered as the base of this study, in which the dynamic analysis of tire-fluid-pavement interactions stays aside from finite element simulations and focuses on attempts based on theoretical expressions and experimental data.
3.1. Fluid Forces
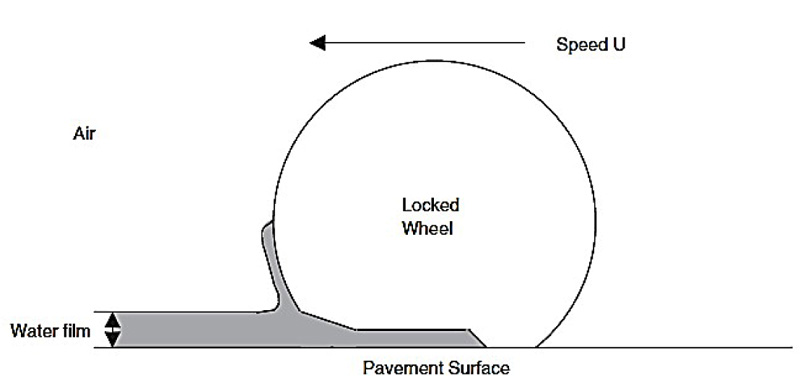
Numerous parameters are involved in landing operations, which interact with the aircraft main gear through various boundary conditions. These parameters usually entangle the relations between the sub-models, which are adapting to compute pavement friction or skid resistance. In this regard, the physical aspects that affect the simulation of landing operations should be evaluated. These physical aspects may lead to the phenomenon called hydroplaning, caused by tire-fluid-pavement interactions. According to Ong and Fwa [20], hydroplaning is defined as a condition which occurs during the dynamic interaction of rolling wheels on wet pavements. The water present as a thin water-film is not fully displaced from the path of the wheel and its contact area, therefore, the fluid interferes in the tire-pavement interaction and alters the braking performance, which mainly depends on the drainage capacity by the tire tread, the aircraft rolling speed (U), and the pavement texture, as presented in Fig. (2).
The phenomenon itself is caused by the apparition of fluid forces on the landing gear due to the interaction between the water film and the tire. These forces modify the dynamic behaviour of the landing gear system by acting on the tire walls, leading to a reduction of the contact area between tire and pavement to the detriment of the braking capacity. Fluid forces can be divided into uplift and drag forces. The fluid uplift force has a stronger influence on hydroplaning occurrence than fluid drag force. As explained by Ong and Fwa [20], hydroplaning occurs when the uplift force that appears on the wheel equals the wheel load. Both hydrodynamic forces generated by the fluid vary with the velocity. Therefore, as the velocity increases, the force gradually rises until reaching the point where it equals the wheel load, and thus, the hydrodynamic pressure, which appears under the wheel, equals the tire inflation pressure. At this point, when hydroplaning occurs, the contact area between the tire and the pavement has completely disappeared, being the tire completely elevated from the ground by the fluid. If this dynamic behaviour is extrapolated to the entire aircraft, the total uplift force generated on the landing gear by the fluid flow equals the total net vertical load of the aircraft.
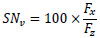
The hydroplaning threshold has a great impact on the braking capacity of the aircraft by modifying pavement friction. The pavement surface friction, also known as skid resistance, adopts a dynamic behaviour in the wet pavement due to the action of the fluid forces and, therefore, varying its value with velocity. In order to analyse this relation, the following definition of skid resistance (Equation 1) is adopted:
 |
(1) |
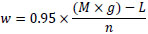
where SNv represents the skid number or skid resistance value at a given speed; Fx stands for the sum of horizontal forces derived from friction and fluid forces; Fz represents the vertical loads on aircraft tires. Regarding Fz, the only vertical load acting on the tire beside the fluid uplift force is the wheel load. This load depends directly on the net vertical load acting on the aircraft and its distribution over the landing gear. As an approximation, it can be described with Equation 2, where it is assumed that 95% of the total landing weight is sustained by the main landing gear:
 |
(2) |
where w represents the aircraft wheel load on the main landing gear; M stands for the aircraft landing mass; g is the gravitational acceleration; L is the aircraft lift generated by the wings; n is the number of wheels on the main landing gear.
The value of SNv depends on the aircraft touchdown velocity. Thus, if a landing operation is analysed, during touchdown, the fluid forces experiment their highest values. The uplift force reduces the effect of the normal load acting on the tire, whereas the drag force cooperates to allow the aircraft to brake. However, at high velocity, the drag is not able to compensate for the loss of friction derived from the decrease of normal load. This situation leads to lower values of the skid number SNv, reaching its minimum close to zero at hydroplaning conditions. In this situation, the only force contributing to braking the aircraft is the fluid drag force.
On the contrary, when the velocity reaches zero, both fluid forces disappear as they are dependent on velocity, and thus, SNv becomes the static friction coefficient. Therefore, the static friction coefficient is basically the skid resistance value at zero speed. There are usually some approximate SNv values depending on the pavement surface materials and characteristics. However, some studies follow the suggested method by Fwa and Ong [10] to compute it, based on an iterative approach, which back-calculates the static friction coefficient by taking some experimental data from previous measurements.
3.2. Mathematical Model
The model herein described is based on previous studies developed by the Authors [22-24]. The mathematical model, which was selected in this study, combines the friction effects on the runway along with the aerodynamic behaviour of the aircraft and the equations of motion. For the sake of simplicity, no reverse thrust effect, plus locked wheel condition after braking on the pavement, are considered. Therefore, aircraft braking distance in landing can be computed based on Equation 3:
 |
(3) |
where S represents the total required braking distance; T is the final time at which the aircraft stops; μ(t) is the dynamic friction coefficient at a given time, defined as μ equals to 0.01×SN; M is the aircraft landing mass; g is the gravitational acceleration; ρ represents the air density; CL and CD are the lift and drag coefficients respectively; Aw is the wing area; V(t) stands for the aircraft speed at a given time; Vb is the landing speed of the aircraft at time zero, which is assumed to be the touchdown speed after suffering a certain speed reduction (Vb = Vt – k), being Vt the registered touchdown speed, and k is the speed reduction assumed to be 2 m/s [14]. Vt should be introduced as a normal probability density function to be capable of outputting probability distribution of landing braking distance for each aircraft model [18,25]. Landing mass is considered a discrete value in this study.
3.3. Model Validation and Testing Accuracy
The main output from the developed model, which can be compared with the existing models in the literature, is the computed dynamic skid resistance (or skid numbers) for various pavement types (e.g., cement concrete or bituminous) at different speeds. These comparisons are required to validate the accuracy and reliability of the model. Most research studies, which are available to contrast the information related to skid resistance on different types of pavements, usually centred their studies on automobile tires, such as cars and trucks. However, despite sharing common functionalities and operational properties, aircraft tires also entail significant differences, such as higher tire pressures and wheel loads [18], which play a major role in the computation of the skid number.
Due to these differences, it is necessary to validate the existing theoretical methods based on automobile tires on aircraft tires to check their feasibility of implementation, and then to check their reliability. However, one of the main problems regarding this validation is the lack of experimental data for commercial aircraft. Therefore, the evaluated methods have been validated against experimental data found on research studies developed with automobiles, which are based on finite element simulation models [10,22,26]. The study developed by Pasindu et al. [18] has been followed closely as a model. It shows a validation study performed for aircraft tires and is therefore analogous to the one needed for the adapted methodology. Moreover, the evaluated speeds conform to a more representative range of values for aircraft operations, and thus, it has been considered to be the best option in order to provide the guidelines for this validation study. This way, experimental data presented by Horne et al. [13] has been used to contrast the applicability of both selected methodologies for evaluating dynamic skid resistance. The validation has consisted of a range of predicted skid resistance values for a given range of sliding speeds, which are needed to be evaluated under the same boundary conditions in order to accurately validate the results. These conditions include a tire of 32×8.8 inches Type VII, a tire inflation pressure of 1999.5 kPa, a wheel load of 9979 kg, and a water-film thickness of 3.8 mm. Along with these data, two types of pavement surfaces have been considered: a cement concrete pavement with a range of sliding speeds of 10, 20, 30, and 40 m/s, and a bituminous wearing course, with a range of sliding speeds of 10, 20, 30, 40 and 50 m/s.
Additionally, it is necessary to include into the computations the static friction coefficients of both types of pavement surfaces, according to those obtained by Fwa and Ong [10]. In order to perform the back-calculation method, the values presented by Horne et al. [13] and used by Pasindu et al. [18] have been considered. The obtained values for static friction coefficients of bituminous and concrete surfaces are 37.4 and 21.3, respectively. Once the average values for the static friction coefficients are selected, it is possible to evaluate the dynamic friction coefficients by computing the skid number values at the different sliding speeds mentioned above. These results have been gathered in Figs. (3 and 4), for comparison purposes between both pavement surfaces, following the fluid equations derived by Horne et al. for NASA [11], along with an alternative result derived from interpolation techniques.
According to these figures, the dashed line represents the experimental data available from literature, whereas the blue and red dotted lines represent the results obtained from the fluid equations and the numerical interpolation, respectively. As it can be observed, both methodologies appear to show similar values in concrete and bituminous surfaces to those measured in the reference studies portrayed with a dashed red line. However, the results derived from the fluid equations show a greater accuracy, and as a result, only that methodology has been adopted for this study.
According to the literature, an interval of ±3.92 SN units at a confidence level of 95% is acceptable with a standard deviation of 2 SN units derived from numerous tests [10]. Therefore, in the case of both concrete and bituminous surfaces, the use of the selected fluid equations leads to numerical differences contained within these confidence limits since the numerical differences were below ±2.5. Moreover, the absolute percentage errors always resulted below ±9.5%. Thus, it can be stated that the methodology is suitable to model the interaction between aircraft tires and pavement in wet pavement conditions after complying with the validation performed.
4. CASE STUDY: SELECTION AND INPUT PARAMETERS
The proposed model by this study is developed as a framework to be adopted for locating and designing runway exits for various types of airports. Each type of airport with its unique boundary conditions can be simulated by the model. The output of each simulation will be exclusive to the specific boundary conditions that are inserted into the model as the initial inputs. In this regard, in order to clarify the possible output out of this simulative model, one international airport is selected as the case study, and the optimised locations of its runway exits, which are presented in the following chapters, are calculated and compared to the existing configurations. Therefore, these outputs will be different in the case of simulating another airport with diverse boundary conditions.
4.1. Selected Airport
Airports need to have a continuous runway evaluation process in order to match the needs of the rising trends in air traffic. In this study, an international airport located in Milan (Italy), which holds a significant international and domestic air traffic volume in Italy, was selected as the case study to be simulated by the proposed methodology. The characteristics of the airport and the categories of operating aircraft have been carefully studied since they are involved in the calculation of Landing Distance Required (LDR).
The stratigraphy of runway pavement and, in particular, the type of mixture used in the wearing course play a major role in stimulating the landing behaviour of aircraft since they affect the tire-pavement interaction and will therefore have a significant influence on aircraft braking distance. The mentioned features of pavement can be classified by Pavement Classification Numbers (PCN). This number determines the type of aircraft that can operate on the runway, which means only those aircraft with an Aircraft Classification Number (ACN) lower than the airport PCN can operate on the selected runway.
Along with the stratigraphy, the maximum aircraft wingspan that is permitted to operate in one aerodrome should be considered, which can be deduced from the airport reference code and corresponding runway dimensions. In this regard, the selected airport is classified as the 4D category, which allows the operation of aircraft with a maximum wingspan of 48 m. Moreover, according to the International Civil Aviation Organization (ICAO), runway dimensions should be reviewed according to the topography and the surroundings of the airport [27], which will set additional consideration in assessing the existing boundary conditions in the preliminary phase of the study.
4.2. Model Assumptions
In order to interpret the obtained results and provide an accurate solution for the runway design, it is necessary to define precisely the boundary conditions assigned to the simulation. Due to the complexity of the dynamic behaviour of the aircraft and the great number of factors involved in the computation of the aircraft braking distances, some assumptions are considered for the sake of simplicity.
Regarding the weather conditions, due to the relatively low altitude of the selected airport (height above sea level of 108 m), the air density was assumed to be the sea-level air density. Additionally, no tailwinds, crosswinds, and headwinds were considered in the mathematical model along with their effects on aircraft touchdown speed. Furthermore, longitudinal and transverse slopes, which can affect the water-film thickness distribution along the pavement, were assumed to be null. This consideration leads to a uniform water distribution on the runway surface, which could affect equally the different parts of the landing gear, although, in a real circumstance, water distribution would vary depending on the slope configuration of the runway and the rainfall intensity.
Moreover, the interaction between aircraft tires and pavement surface is defined by the wheel load acting on the tire. As previously explained, this net vertical load will depend on the aircraft weight and the lift force generated by the aircraft. The wheel load has been assumed to be constantly considering the effect of the average lift force appearing over the aircraft wing during the landing operation. This way, the lift force leads to a reduction of the wheel load. However, it can still be considered constant in the computational process.
The aerodynamic properties of the different aircraft need to be introduced in the mathematical model for the computation of the aerodynamic forces based on the lift and drag coefficients. These depend on the wing and the used airfoil. During the data collection process, it was possible to obtain the parasite drag coefficient CD0 and the Oswald factor k for each aircraft model in clean configuration without the use of high-lift devices. During landing, the overall drag and lift are affected by these high-lift devices. The landing gear leads to specific values that differ greatly from those characteristics of a cruise stage in clean configuration. In order to lead to valid results, the parasite drag coefficient was calculated by adding a contribution of the high-lift devices used during landing. These devices do not affect the Oswald factor, which depends on the wing geometry, as it can be deduced from the literature [28]. In this regard, the expression for the drag coefficient can finally be formulated using Equation 4.
 |
(4) |
Where CD represents the total drag coefficient in terms of Δflaps representing the increase of drag derived from the use of flaps during landing; k is the Oswald factor; CL is the lift coefficient during landing. In this stage, CL is generally assumed to be the CLmax of the aircraft due to the increase of lift obtained with the different high-lift devices, which depends on the numbers and the types of devices used. The lack of data for computing the CLmax, can be compensated by assuming the final approach speed Vt equal to 1.3×Vstall.
Finally, according to the proposed methodology, the final condition to stop the iteration process of braking distance computation depends on the final aircraft speed definition, which is commonly assumed to be zero. However, in order to portray a more realistic approach, this speed should acquire the value of the runway exit speed, in which the aircraft would not fully stop but would proceed to exit the runway safely using the closest taxiway junction. As a result, the simulation would require a slightly lower number of iterations and consequently lower braking distances. The value of runway exit speed for this study has been taken from the stipulated value defined by ICAO [29], where Vexit equals 30 kts for an airport with a 4D reference code. By considering this value instead of the zero, the simulation allows to model optimal and safe evacuations from the runway, which is one of the main scopes of this study.
4.3. General Inputs
Some of the inputs required for the simulation process have been previously specified according to the literature, as were referenced before, and the rest are selected as boundary conditions, particularly for this study, as presented in (Table 1).
The value for water density has been selected at 25ºC [10]. The water-film thickness has been selected following the recommendations of the Authors according to the realistic climatological circumstances of the selected airport. It is necessary that the selected inputs fall in the ranges of applicability of the proposed model. Furthermore, normal probability distributions with mean values equal to the actual touchdown speed of each aircraft category are considered as the aircraft touchdown speed in the computations.
Table 1.
| Inputs | Indexes | Selected values | Units |
|---|---|---|---|
| Water density | ρw | 997.1 | kg/m3 |
| Air density | ρ | 1.225 | kg/m3 |
| Landing speed reduction | ks | 2 | m/s |
| Water-film thickness | tw | 3 | mm |
| Gravitational acceleration | g | 9.81 | m/s2 |
| Flap induced drag variation | Δf | 0.12 | - |
| Discretization time | Δt | 0.3 | s |
| Dry friction coefficient | μ | 0.5 | - |
| Standard deviation | σ | 2.7 | - |
| Exit speed | Vexit | 30 | kts |
4.4. LDR Values Categorizations
Once the LDR values for operating aircraft at the selected airport are computed, it is possible to evaluate an optimum location solution of runway-taxiway junctions. These LDR values can be categorized according to final approach speeds, or wing areas, or landing weights to analyse their mutual relationships and extract a pattern that could serve as a guide for designing the runway-taxiway junctions according to the actual LDR values. Thanks to these categorizations, it is possible to assign one junction to a cluster (or a category) of aircraft with similar characteristics instead of assigning a junction to each aircraft individually, which is impossible to implement. These aircraft categorizations are presented in the following.
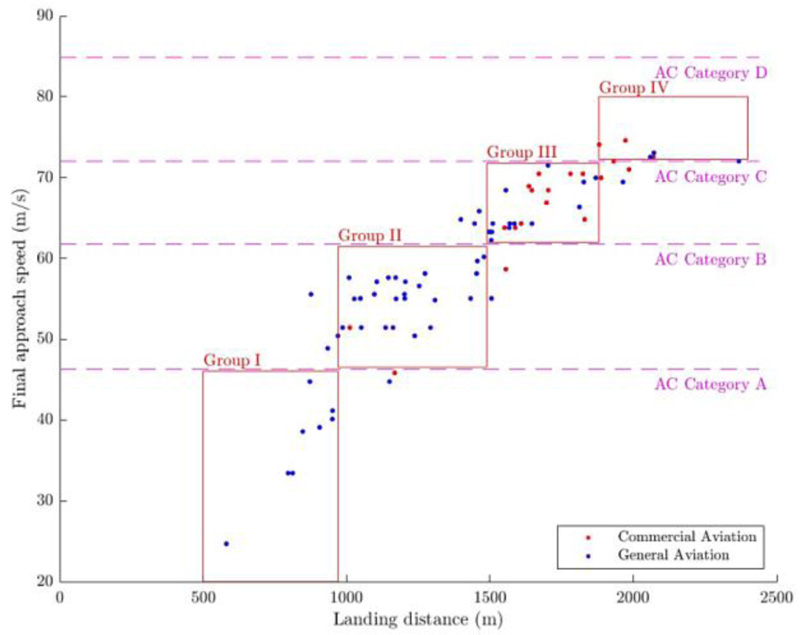
As the first approach, the distribution of the LDR values along the runway has been categorized according to the final approach speeds (m/s). These speeds can affect the aircraft's dynamic behaviour in landing operations by altering the wing's applied aerodynamic forces and, consequently, altering the friction coefficient. Clearly, higher approach speeds generally lead to longer landing distances for similar aircraft braking potentials since a higher speed results in lower skid resistance numbers as the fluid forces would acquire greater values. A greater velocity also implies a greater drag force generated over the wings. However, that force is generally not enough to compensate for a lower braking performance derived from the tire-pavement interaction. According to ICAO [29], it is possible to classify the aircraft according to their final approach speed or threshold speed into four official groups:
- Group A comprises aircraft with approach speeds lower than 91 kts (47 m/s);
- Group B comprises aircraft with approach speeds higher than 91 kts but lower or equal to 121 kts (62 m/s);
- Group C comprises aircraft with approach speeds ranging from 122 kts to 140 kts (72 m/s);
- Group D includes all aircraft with approach speeds higher than 140 kts up to 165 kts (85 m/s).
As a result, four aircraft groups, which are operating at the selected airport, with respect to their LDR values were classified, as presented in Fig. (5). This method of categorization can usually lead to logical clusters. However, some of the aircraft can fall out of these groups, which could be due to the complexity of the interactions between numerous parameters in landing operations. In order to assign fall-out aircraft to the categories, feasible assumptions have been applied that ultimately covered a total of 87% of operating aircraft, which means 13% of aircraft fall out of the groups.
Another aircraft LDR values categorization can be performed according to the wing area (m2). Wing area interacts in the dynamic behaviour of aircraft through the aerodynamic loads. This way, a greater wing area leads to greater drag and lift forces, which can also affect the landing braking distances. Groups I to IV are assigned to the LDR values of aircraft according to their final approach speeds and then classified into different clusters according to their wing areas. This categorization leads to a greater percentage of aircraft falling out of the considered clusters, with only 83% of the aircraft comprised in any of A, B, and C clusters. Therefore, this categorization approach was not considered in the simulations.
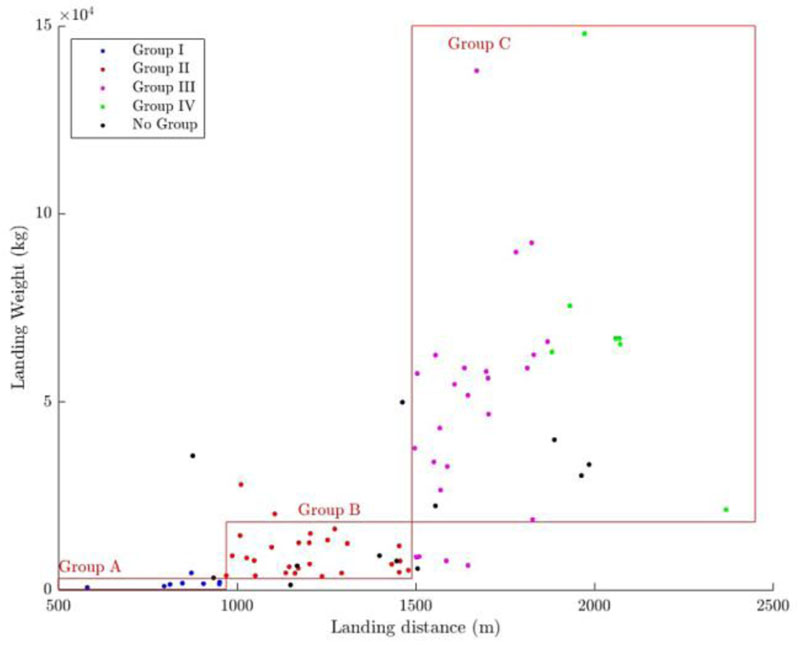
Finally, aircraft LDR values can be categorized according to the aircraft landing weight. These weights have great impacts on landing behaviour, as they usually used to set certain restrictions or define different types of manoeuvres. In the simulation process, the aircraft landing weight affects the main gear through the distribution of weight, defining the wheel load and thus, affecting the skid resistance. Although there are some official categorizations available in the literature regarding the aircraft weight, they are commonly based on the Maximum Take-Off Weight (MTOW). This new categorization is more accurate since adopting the aircraft weight at the moment of touchdown is highly recommended for computing the braking distance [25]. Moreover, it allows obtaining a deeper understanding of designing the runway-taxiway junctions. Again, three clusters of A, B, and C were set, as presented in Fig. (6).
In this case, the amount of aircraft assigned to each cluster is also optimized, reaching a total of 86% of aircraft comprised in A, B, and C clusters. Once the optimum categorization approach for each type of calculation is evaluated, it is possible to start analysing the possible design solutions for runway-taxiway junctions.
5. CASE STUDY: MODEL RESULTS AND LOCATION OPTIMIZATION OF RUNWAY TAXIWAY JUNCTIONS
Based on the selected approaches for aircraft LDR values categorization, two different solutions have been proposed for designing runway-taxiway junctions, which are conceived as two alternative possibilities depending on the required construction activities for the selected airport. The first solution offers a proposal for taxiway modification based on the actual junctions’ configurations of the existing runway, while the second one sets a future scenario for designing a new runway with the possibility of adding new junctions.
5.1. Existing Taxiway Modification
For this solution, an approach based on the LDR values categorization according to aircraft landing weight is selected. According to this categorization, A, B, and C clusters of aircraft were obtained. Therefore, the main scope was to define the ideal location of the runway-taxiway junction that can be assigned for each cluster. This approach is also complemented with the guidelines of ICAO [29] for taxiway junction design and calculation. According to these guidelines, the approach suggested for this solution is only applicable under a set of pre-defined conditions, which are adopted by this study:
- only the set of aircraft operating at the selected airport should be evaluated;
- weather conditions are set to be those mentioned in the methodology, generating the specified water-film thickness associated with the study.
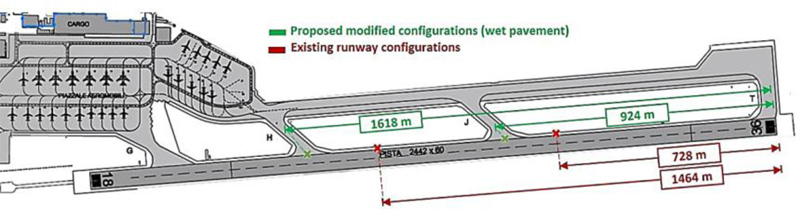
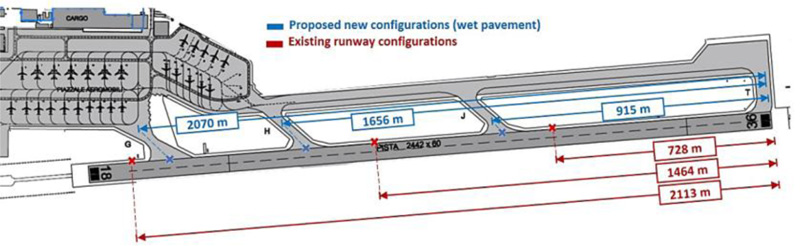
In this way, by adopting the computed LDR values, an individual Optimal Turn-off Point (OTP) for each of the evaluated aircraft will be obtained. OTP corresponds to the location of a junction at which the aircraft would ideally proceed to exit the runway towards the taxiway. It is worth highlighting that according to ICAO [29], a minimum distance separation of 450 m should be guaranteed between parallel runway exits. Therefore, the selected international airport plan has been modified, and the visual representation of the modified configurations solution for wet pavement conditions is presented in Fig. (7). The landing direction is considered to be only from designation 36 toward designation 18, and the distances are quoted from the threshold of designation 36 to the centreline extension of each junction. According to the existing configurations of the runway-taxiway junctions of the airport, the distance from the threshold of designation 36 to the centreline extension of taxiway J is 728 m; to the taxiway, H is 1464 m; and to the taxiway, G is 2113 m.
As a result, three new locations for runway-taxiway junctions are proposed that entail variation with respect to the distances of the current design. Additionally, the taxiways associated with the letters T and G, referring to the first and last exits, should not be modified in order to avoid significant changes in the rest of airport infrastructures that would require new design plans. In this scenario, a compromise solution is needed to be adopted to guarantee the restrictions derived from ICAO and provide an enhanced solution at the same time.
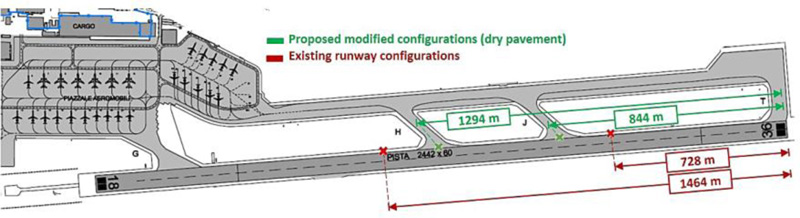
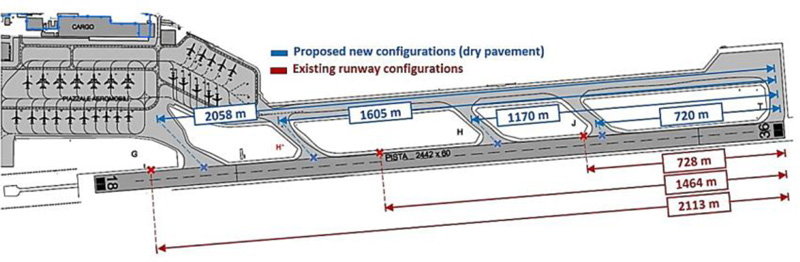
In dry pavement conditions, the absence of water film on the pavement surface will simplify the applied forces on the main gear tire, which means no fluid forces need to be considered in the simulation. This will lead to a constant value for the skid number over time. Therefore, the adopted value of skid resistance will be equal to the SN0 assigned to the type of pavement. As a result, shorter braking distances will be achieved with respect to the wet pavement scenario, which leads to shorter LDR values. A similar simulation process of the wet pavement scenario was also followed for dry pavement condition, while all interactions derived from the presence of the fluid over the pavement surface were eliminated. A simplification of the calculations can also be recalled from the ICAO recommendations [29,30]. Once the landing distances are simulated, the same approaches of categorizations are followed to optimize the runway evacuation pattern. The proposed modifications of two junctions (H and J) in the middle of the runway for the selected airport in a dry pavement scenario are presented in Fig. (8).
5.2. New Taxiway Design
Besides the design modification solution, this study has also evaluated alternative solutions for constructing a runway with new taxiways configurations, which can be served as the runway rehabilitation design at the end of its lifetime to meet the future growing needs of air transport.
For the new taxiway design solution, the LDR values were categorized according to ICAO final approach speeds. Since this solution is conceived as a proposal for a new runway design, there is higher flexibility, in which the junctions can be moved freely towards new locations. Similar before, the location of taxiway T did not experience any variation since it was assumed that landing operations are mostly being performed from designation 36. Moreover, as a result of the simulation, junction G, which serves not only as a taxiway exit but also as a direct connection to the terminal apron, should be relocated towards an earlier location, as demonstrated in Fig. (9). This variation would not entail great modification in the exact location of junction G; therefore, the apron configuration could be kept unmodified.
| Solution | Scenario | Junction T | Junction J | Junction H1 | Junction H*2 | Junction G |
|---|---|---|---|---|---|---|
| Taxiway modification | Wet | 0% | +27.00% | +10.50% | - | 0.00% |
| Taxiway modification | Dry | 0% | +16.00% | -11.20% | - | 0.00% |
| New taxiway design | Wet | 0% | +25.60% | +13.10% | - | -2.10% |
| New taxiway design | Dry | 0% | -1.00% | -20.10% | +9.60% | -2.60% |
Designing a new junction with respect to the existing junction H at the selected airport.
In a dry pavement scenario, shorter landing distances resulted in an accumulation of aircraft turn-off points over a narrower interval of distances at the runway. Therefore, the optimal locations of two middle junctions of H and J and junction G at the end of the runway become relatively closer to the runway threshold. In order to decrease the runway evacuation time for those aircraft with longer LDRs, an additional junction (H*) has been introduced, which changed the runway design by three junctions (H*, H, and J) in the middle, one junction (G) at the runway end, and one junction (T) at the runway threshold, as presented in Fig. (10).
| Solutions | Mean Rolling Distance | Variation | Percentage Variation | |||
|---|---|---|---|---|---|---|
| Wet | Dry | Wet | Dry | Wet | Dry | |
| Current design | 356 m | 345 m | - | - | - | - |
| Taxiway modification | 275 m | 259 m | -81 m | -86 m | -23% | -25% |
| New runway | 261 m | 212 m | -95 m | -133 m | -27% | -39% |
Furthermore, in order to analyze the sensitivity of both solutions in both scenarios, the variations in the junction’s configurations with respect to the existing configurations are presented in Table 2.
As it can be interpreted from the results obtained from simulating the selected case study, a better friction performance of the pavement derived from the absence of contaminants on the surface, consequently, results in lower braking distances, while wet pavement conditions led to longer braking distances, which increase the LDRs of the operating aircraft. Moreover, in the wet pavement scenario, OTPs are further apart from the runway threshold with respect to the dry pavement condition, which leads to a distant concentration of these locations. For this scenario, two junctions in the middle of the understudy runway are enough to optimally evacuate the operating fleet, as long as respecting the recommended design limitations imposed by ICAO. While dry pavement conditions would require the addition of a third junction into the middle of the runway in order to offer the optimal evacuation services.
CONCLUSION
One analytical optimization model is developed as a framework to be adopted for locating and designing runway exits for various types of airports. Travel demands in the air transport industry have an increasing growth rate. Therefore, the capacities of critical airport infrastructures (runways, taxiways) should be monitored and improved continuously in order to match these increasing demands. These capacities can be improved by evacuating the infrastructures in the shortest time possible and preparing them to host the next operation. In this regard, the proposed model assists airport authorities in order to design their runway exits with the most optimised configurations.
Thanks to this model, it is possible to simulate the dynamic behaviour of aircraft during landing and the interactions between its main gear, pavement, and any runway contamination (e.g., existing water-films on the runway). Each type of airport with its unique boundary conditions can be simulated by the model. The output of each simulation will be exclusive to the specific boundary conditions that are inserted into the model as the initial inputs. Therefore, these outputs will be different in the case of simulating another airport with diverse boundary conditions. In order to clarify the possible output of this simulative model, one international airport located in Milan (Italy) with its current operating fleet has been selected as the case study. The optimised locations of its runway exits are calculated and compared to the existing configurations.
In the simulation process, the dynamic skid resistances between tire and pavement in wet runway conditions are compared and validated according to the outputs of existing models in the literature. Finally, the optimal configuration of runway exits for two solutions of modifying the existing runway configuration and designing a new runway are calculated. The study allows evaluating the effectivity of both proposed solutions in terms of the aircraft mean rolling distance, which is defined as the travelled distance from each individual OTP to the actual runway exit, as presented in Table 3.
Both solutions offer improvements with respect to the current runway configurations in terms of reduction in mean rolling distances. The taxiway modification solution achieves a reduction of 23% (81 m) in the mean rolling distance for wet and 25% (86 m) for dry pavement conditions. It is even possible to obtain a greater mean rolling distances reductions of 27% (95 m) for wet and 39% (133 m) for dry pavement conditions through new runway design solution, which are due to the higher flexibilities and degrees of freedom in designing a new runway from the beginning.
It can be concluded that the developed model can optimize the location of the runway exits by lowering the aircraft's mean rolling distances after landing. Consequently, the operation costs and fuel consumption will be decreased, which will lead to limiting the runway evacuation times. Therefore, this model can increase the capacity of the airfield, which is the main scope of this study. The main advantage of this model is its ability to cover a wider spectrum of boundary conditions water-film thicknesses, wind forces, operating aircraft categories) with respect to the existing models, and its applicability in designing new runways, plus for optimizing the configuration of existing infrastructures, in order to satisfy the evolution of the industry.
CONSENT FOR PUBLICATION
Not applicable.
FUNDING
None.
CONFLICT OF INTEREST
The authors declare no conflict of interest, financial or otherwise
ACKNOWLEDGEMENTS
Declared none.

