All published articles of this journal are available on ScienceDirect.

Performance of Screen in a Sudden Expanding Stilling Basin under the Effect of the Submerged Hydraulic Jump
Abstract
Background:
Hydraulic jump is considered the most appropriate option for designers to dissipate energy through stilling basins.
Methods:
Tests on a screen that produced a submerged hydraulic jump were conducted to dissipate the energy of water passing beneath a vertical gate. Various positions of a screen in a sudden expanding stilling basin were investigated. In comparison to the no-screen case, the effect of a screen downstream of the gate on the water surface profile was also investigated.
Results:
The best screen position was 0.25 of the abutment lengths with a 0.285 relative screen area, which resulted in the most energy loss with the lowest tail water depth and submerged hydraulic jump length. Theoretical equations based on the energy and momentum principles were derived.
Conclusion:
An acceptable agreement was obtained between the derived theoretical relative depth of the hydraulic jump and the measured values.
1. INTRODUCTION
Hydraulic jump is regarded as a proficiency implement for energy dissipation downstream gates. The accurateness of gates may vary according to the conveyed flow condition. Some countermeasures such as sills, baffles and screens are supplied to the stilling basins downstream the gates to increase the basin efficiency and stabilize the hydraulic jump. Rajaratnam (1965) verified that the submerged hydraulic jump jet decreased the mixing as the submergence ratio increased [1]. This leads to less dissipation of the energy compared to the free hydraulic jumps and the disappearance of the high-velocity jet.
Many studies were performed to investigate the characteristics of the hydraulic jump, such as Smith (1989), Bremen and Hager (1994) and Ohtsu et al. (1999) that happened in the abrupt expanding channels [2-4]. A submerged hydraulic jump was numerically investigated by Ma et al. (2001); Rajaratnam and Subramanya (1967) [5, 6] investigated the velocity and pressure field immediately below a deeply submerged sluice gate fixed in a rectangular open channel. Laboratory experiments of the hydraulic jump in the abrupt asymmetric expanding stilling basin were carried out by Torkamanzad et al. (2019) as an energy dissipator by changing the geometry of walls and bed roughness elements [7]. Tiwari and Seema (2013) and (2014) [8, 9] investigated the performance of stilling basin models with an end sill and different intermediate sill geometries.
Rajaratnam and Hurtig (2000) and Sadeghfam et al. (2015) showed that the screen with a porosity of 40% was an effective energy dissipator below a small hydraulic structure [10, 11]. Experiments by Balkiş (2004) were performed to study the effect of the screen inclination on the dissipated energy [12]. The results indicated that the screen inclination had no noticeable effect on the dissipated energy compared to the vertically-placed screens. Experimental tests were conducted by Bozkuş et al. using a vertically-placed screen downstream the gate as an alternative tool for energy dissipator [13, 14]. Different parameters such as porosity, thickness and location of the screen had a significant effect on energy dissipation. Screens with porosities between 20% and 60% were experimentally investigated by Bozkus et al. (2007) [14]; it was found that the screens significantly dissipated energy more than that was dissipated through the conventional hydraulic jump within the large range of Froude numbers. Bozkuş and Aslankara (2008) studied the tail water effects and multiple screens on the energy dissipation through screens [15]. It was found that the tail water depth had no noticeable effect on the energy dissipation, while the multiple screen arrangement dissipated extra energy compared to one double screen. The hydraulic characteristics of the forced hydraulic jump due to the perforated sill were measured and compared with the classical hydraulic jump performed by Behrouzi-Rad et al. (2013) [16]. Mahmoud et al. (2013) examined the effect of different shapes (e.g., circular and square) of holes through perpendicular single and double screen arrangements with a porosity of 40% on the energy dissipation [17]. It was found that the performance of the screen with square holes was better than that with circular holes. Screens with a porosity of 50% with square holes were investigated experimentally by Abbaspour et al. (2019) [18]. Screens in an adverse slope of 0.025 dissipated more energy than that the adverse slope of 0.015. The screens with double arrangement revealed a better performance and dissipated more energy than the screens with a single arrangement. The impact of a perforated sill and its position on the B-type hydraulic jump was experimentally examined by Fathi-Moghadam et al. (2017) [19]. They concluded that the perforated sill greatly affected the energy dissipation and the development of the hydraulic jump in short distances. Daneshfaraz et al. (2017) [20] applied the Reynolds-averaged Navier-Stokes based flow equations to analyze the interaction of the perforated screens and supercritical flows, resulting in local complex three-dimensional flows. A set of equations in terms of the relative depth of the hydraulic jump through the perforated screens had been driven. Zayed et al. (2018) [21] investigated the hydraulic performance of triangular V-shaped screen models with different angles, blockage ratios, circular bar designs and flow discharges. The results showed that the head loss through the screen increased with increasing the flowed discharge and blockage ratio, and it decreased at low screen angles for the circular bar types.
Daneshfaraz et al. (2019) carried out experiments to investigate the energy dissipation through the screen in the downstream movable bed [22]. Single and double arrangements of screens with 40% and 50% porosities were used with three different bed particle sizes. Double screens with 40% porosity produced the highest energy dissipation. While single screens with 50% porosity produced the minimum bed scour for a constant amount of energy dissipation. Laboratory investigations of scouring of supercritical flows against screens were introduced by Sadeghfam et al. (2019) [23].
The main objective of this study is to investigate the performance of the vertical screen experimentally through a sudden expanding stilling basin. The characteristics of the submerged hydraulic jump, as well as the energy dissipation downstream the vertical gate due to the screen, were studied. This study also aimed to build theoretical models for this phenomenon to help the designer choose the best additional accessories.
2. MATERIALS AND METHODS
The experimental tests were executed in a re-circulating flume of 0.30 m wide; 0.468 m deep, and 15.6 m long with a working section of 12.50 m. A centrifugal pump lifts the water from a sump tank to the flume inlet. The discharge of the flume is measured by using calibrated orifice meter. To adjust the tail water depth, the tailgate is screwed gradually until the considered depth is adjusted. A point gauge was used to measure the water levels with ±0.1 mm accuracy.
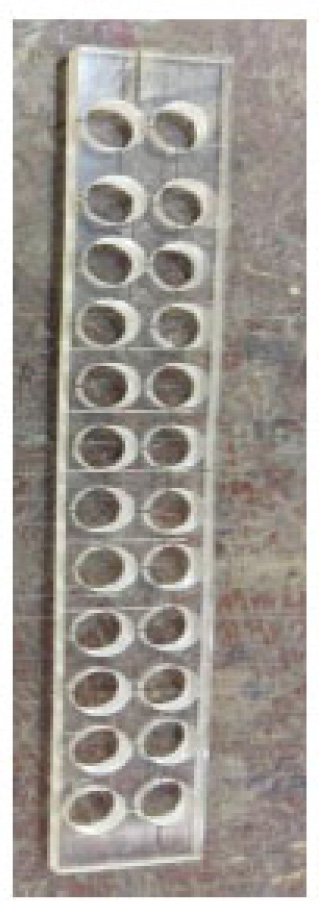
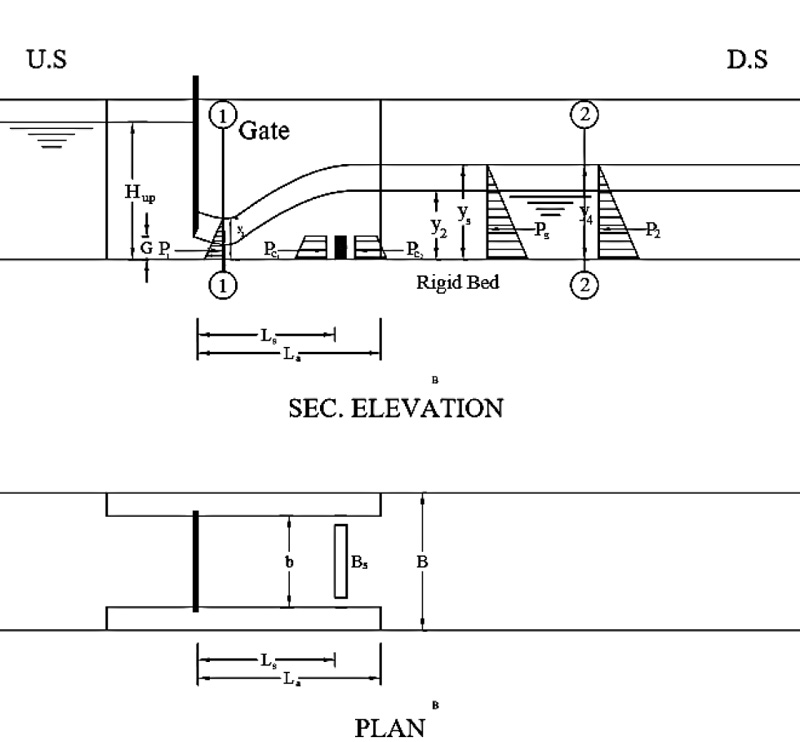
The vertical screen model was built from Perspex and was placed in a sudden expanding stilling basin with a constant expansion ratio (e=1.35) downstream of the vertical gate. For each experiment, the flow rate, water surface profile and hydraulic jump length were measured. The inflow Froude number ranged from 1.14 to 9.16, with flow rates ranging from 4 to 22.3 l/s to cover the different submergence ratios (S= 2, 2.5, 3, 3.5, 4, 4.5). About 206 runs had been conducted, including 23 runs for a standard sluice gate with a perfect jump and 48 runs for a sluice gate with a submerged hydraulic jump without any modifications (i.e., case of no screen) for the comparison as summarized in Table 1. Various models of the screen in a stilling basin were tested to investigate the effect of the submergence ratio on the hydraulic jump characteristics. A screen of 22 cm wide and 3 cm height with 24 holes and 10 mm diameter indicated in Fig (1) was used to investigate the effect of a screen location on the hydraulic jump characteristics and determine the best screen location.
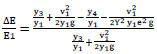
2.1. Energy Equation
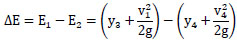
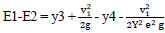
Fig. (2) represents the schematic illustration of the supercritical flow when it collides the screen forming a hydraulic jump. The energy loss between sections 1-1 and 2-2 can be obtained by applying the energy principle with assuming the energy coefficients equal unity.
 |
(1) |
Where;
y3 is the back-flow depth, v1 is the flow velocity at section 1-1 (i.e., the supercritical flow velocity), and y4 and v4 are flow depth and velocity at section 2-2, respectively.
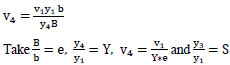
From a continuity equation:
 |
(2) |
 |
(3) |
 |
(4) |
 |
(5) |
Simplifying the above equation 5,
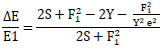 |
(6) |
| Cases | Stage No. | Dimensions | Screen Area | No. of Holes | S | Q (1/s) | No. of Runs |
|---|---|---|---|---|---|---|---|
| (cm) | (cm2) | ||||||
| Perfect jump | 1 | - | - | - | 1 | (5.56-22.13) | 23 |
| S. H. J without screen | 2 | - | - | - | 2.0, 2.5, 3.0, 3.5, 4.0, 4.5 | (5.10-16.02) | 48 |
| S. H. J with screen | 3 | 22*3.0*0.3 | 66 | 24 | 2.0, 2.5, 3.0, 3.5, 4.0, 4.5 | (5.78-14.79) | 35 |
| 1s / 1a = 1.00 | |||||||
| S. H. J with screen | 4 | 22*3.0*0.3 | 66 | 24 | 2.0, 2.5, 3.0, 3.5, 4.0, 4.5 | (5.10-14.43) | 35 |
| 1s / 1a = 0.75 | |||||||
| S. H. J with screen | 5 | 22*3.0*0.3 | 66 | 24 | 2.0, 2.5, 3.0, 3.5, 4.0, 4.5 | (6.20-15.42) | 35 |
| 1s / 1a = 0.50 | |||||||
| S. H. J with screen | 6 | 22*3.0*0.3 | 66 | 24 | 2.0, 2.5, 3.0, 3.5, 4.0, 4.5 | (6.96-15.85) | 30 |
| 1s / 1a = 0.25 |
2.2. The Relative Depth of the Hydraulic Jump
To create a theoretical model for calculating the relative depth of the submerged hydraulic jump, the pressure–momentum relationship between sections 1-1and 2-2 have been applied.
 |
(7) |
In which;
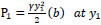 (the hydrostatic pressure at the beginning of the hydraulic jump),
 (the hydrostatic pressure at the end of the hydraulic jump),
 (the hydrostatic pressure below one side of the contraction),
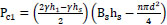 (the hydrostatic pressure before the screen),
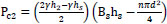 (the hydrostatic pressure after the screen) and
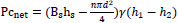 (the net pressure applied on screen)
Where;
hs is the screen height, Bs is the screen width, d is the diameter of the screen holes, ys is the water depth just after the abutments contraction, As is the total area of screen (As = Bshs),Ao is the area of holes (Ao = 0.25nπD2) and n is the number of holes.
By substituting in the momentum equation 7,
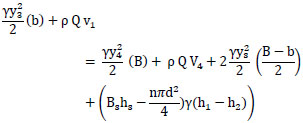 |
(8) |
Divided equation 8 by B

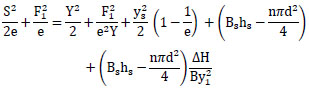 |
(9) |
Multiplying equation 9 by 2e
 |
(10) |
Rearrangement equation 10
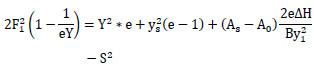 |
(11) |
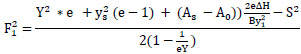 |
(12) |
Taking Anet = As - Ao, where Anet is the net screen area
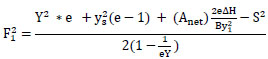 |
(13) |
The above equation 13 is the general equation of the submerged hydraulic jump that occurred in a stilling basin provided by the screen. If the screen is not fixed in the basin, the following equation is proposed for the submerged hydraulic jump in a sudden expanding channel (i.e., the case of no screen).
 |
(14) |
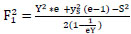
In the case of the perfect free hydraulic jump in the sudden expanding stilling basin taking S=1 and from equation 14.
 |
(15) |
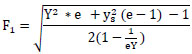
In the case of the classical hydraulic jump in a rectangular stilling basin (i.e., e =1.0), equation 15 yielded to;
 |
(16) |
Equation 16 gave the same results as the well-known Blanger’s equation of smooth rectangular channel.
2.3. Dimensional Analysis
Based on the theoretic realization of the flow field between the sluice gate and the screen, many flow parameters were characterized to perform the dimensional analysis.
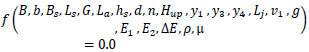 |
(17) |
Where ρ is the density of water and µ is the dynamic viscosity of water. By merging the resultant dimensionless parameters;
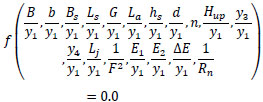 |
(18) |
Rn has a very small effect in the open channel, and it can be neglected.
1/F2 is replaced by F2, from (B/y1) and (b/y1) yielded to B/b=e. From (Bs/y1) and (b/y1) we get the relative screen width (Bs/b). The hydraulic jump efficiency =E2/E1 may be calculated using (E 2/y 1) and (E 1/y 1). Subtract E2/E1 from unity (1-E2/E1) = (E1- E2)/ E1=ΔE/ E1, the relative energy loss through the hydraulic jump. From Bs/y1, hs/y1, d2/y12 we can get (y1/Bs*y1/hs*d2/y12)=d2/Bshs=nπd2/As=Aholes/Ascreen, from (Ls/y1) and (Lb/y1) we obtained Ls/y1* y1/Lb = Ls/Lb the relative length of the screen. When the screen height, screen area and the expansion ratio were constants through this study;
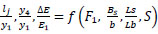 |
(19) |
3. RESULTS AND DISCUSSIONS
3.1. Case of No Screen
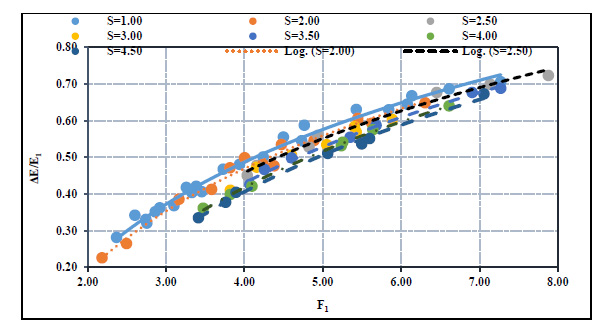
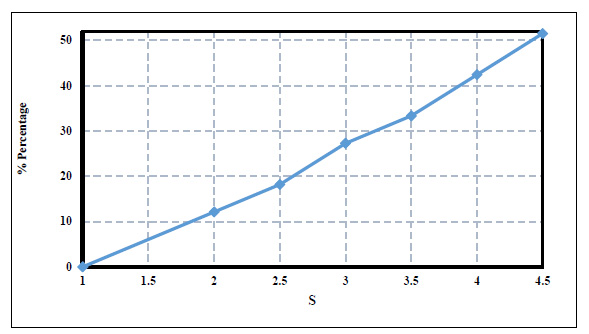
Fig. (3) shows the relation of the initial Froude number (F1) and the relative energy loss (ΔE/E1) for different submergence ratios. The relative energy loss increased as the Froude number increased for all submergence ratios. Moreover, the relative energy loss decreased as the submergence ratio increased at a specific Froude number. Fig. (4) shows the decreasing percentage of the relative energy loss due to the increase in the submergence ratio at F1=5.00. The percentage of decrease rose when the submergence ratio was increased e.g., at F1=5.00, the relative energy loss decreased by 12% roughly for the submergence ratio S=4.50 with respect to S=1.00. It was also found that the decreasing percentage of the relative energy loss decreased linearly with the submergence ratio.
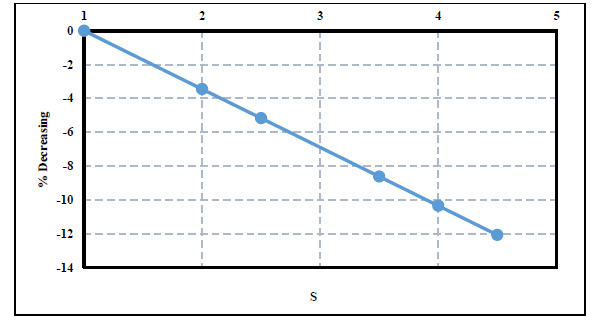
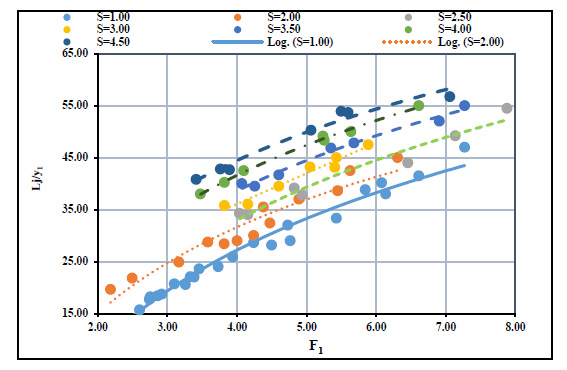
Figs. (5 and 6) show the relation between the initial Froude number and the relative depth of the hydraulic jump (Y) and the relative length of jump (Lj/y1), respectively. From these figures, as the Froude number increased, the relative depth of the submerged hydraulic jump and the relative length of the hydraulic jump increased for any submergence ratio. For a certain value of an initial Froude number, the relative depth and the relative length of the hydraulic jump increased with the increase of the submergence ratio. The increasing percentage of the relative depth and length of the hydraulic jump also has a linear increasing trend, as shown in Fig. (7). In other words, for a given submergence ratio, the increasing percentage of the depth and length of the hydraulic jump has a nearly constant slope.
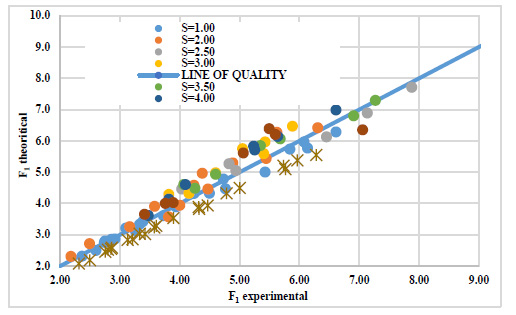
The relation between the theoretical and experimental Froude numbers for the perfect hydraulic jump (i.e.,S=1.00) matched closely, as shown in Fig. (8). In this Figure, the equation’s results of Hager (1985) [24] were below the estimated results of the present study. This difference can be attributed to the assumption of a curved linear dead zone (separation zone) downstream the sudden expansion instead of the abrupt expansion done by Hager (1985) [24]. Moreover, Hager (1985) assumed that the separation zone was a smooth solid boundary [24]. This hypothesis simplified the problem and caused the acceptable errors in the theoretical Froude number of Hager (1985) [24]. The deviation of the theoretical results of this study around the line of quality increased positively with the increase of the submergence ratio. Rajaratnam (1965) concluded that the submerged hydraulic jump jet decreased the mixing between forward and backward flow, especially at the higher submergence ratios [1]. Moreover, the occurrence of the asymmetric flow below the sudden expansion caused a remarkable change in the lateral water depths downstream the abrupt expansion. Consequently, the hypotheses of pressure linear distribution through the jump are affected by the higher submergence ratio and the asymmetric flow conditions (Figs. 9-11).

3.2. Effect of Submergence Ratio at Different Locations of Screen on the Hydraulic Jump Characteristics
The relative energy loss decreased when the screen was fixed far away from the gate. For example, at F1=5.00 and S= 4.5, the decreasing percentages were 29.41%, 27.45%, 21.57% and 17.65% when the screen was fixed at the relative distances 0.25, 0.5, 0.75 and 1.00, respectively, compared to the no screen case. While, at S= 2.5, the increasing percentages of the relative energy loss for the same previously mentioned screen locations were 30.91, 25.45, 23.64 and 17.27, respectively. The decreasing percentages of the relative depth of the hydraulic jump were 35.8%, 34.37%, 26.01 and 20.05% at the relative distances 0.25, 0.5, 0.75 and 1.00, respectively, compared to the case of no screen at F1=4.50 and S= 4.5. However, in the case of S=2.50, the decreasing percentages of the relative hydraulic jump depth were 44.86, 41.84, 36.56 and 29.76 for the (ls/la) = 0.25, 0.50, 0.75 and 1.00, respectively. As well, for example, at F1=5 and S= 4.5, the decreasing percentages of the relative length were 35.40%, 34.20%, 26.00 and 19.60% at the relative distances of 0.25, 0.5, 0.75 and 1.00, respectively, compared to the case of no screen. Furthermore, at S=2.50 the decreasing percentages of the relative length of the hydraulic jump were 43.59, 40.26, 35.90 and 28.21 for (ls/la) =0.25, 0.5, 0.75 and 1.00, respectively.
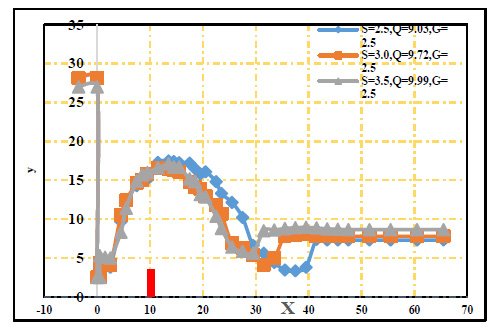
The water surface profiles of the submerged hydraulic jump were plotted to show the effect of the screen location. The water surface profile for the case of no screen and with a screen at 10 cm from the gate was presented in Figs. (10 and 11), respectively, as representative examples. From these figures, the changes in the water depths in the case of no screen were gentile and smooth. The expansion in the vertical direction (i.e., the water depths) needed an extra length compared to the case with a screen at any location under the same flow conditions. The flow jet impacted the screen. Consequently, it generated a reverse flow and raised the water surface over the screen. When the screen was located far away from the gate, the fluctuation of water depths around the screen decreased for all the submergence ratios, as shown in Fig. (12).
3.3. Effect of Screen Location
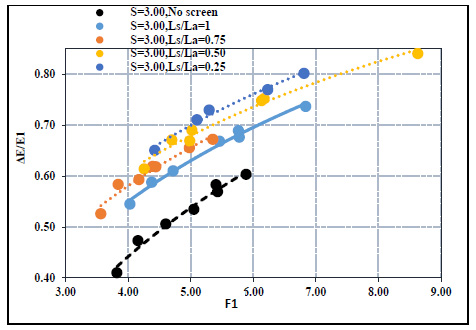
The effect of the screen location on the characteristics of the hydraulic jump was studied for the different submergence ratios. Fig. (13) showed the relation between the initial Froude number and the relative energy loss for the different locations and the submergence ratio of 3.0. It was found that the relative energy loss increased compared to the case of no screen for the different screen locations. The increasing percentage gradually decreased as the screen was fixed far from the gate. The maximum energy loss occurred at the relative distance of 0.25. For example, at F1 = 5.00 and S= 3.00, the increasing percentage of the relative energy loss at the different locations (ls/la = 0.25, 0.5, 0.75 and 1.0) decreased gradually that were 29.63%, 25.93%, 21.85% and 16.67%, respectively. In addition, the percentage of increase in the relative energy loss is inversely proportional with the submergence ratio. In other words, the efficiency of the screen from the energy loss point of view decreases as the submergence ratio and the screen relative location increase. This means that when the screen is located far away from the gate, it has a low effect at the higher submergence ratio, while when the screen is fixed close to the gate, the screen is more effective at the low submergence ratio.
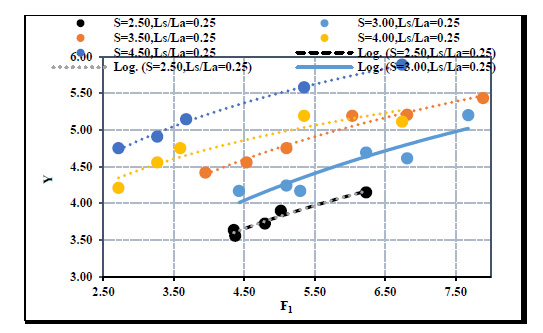
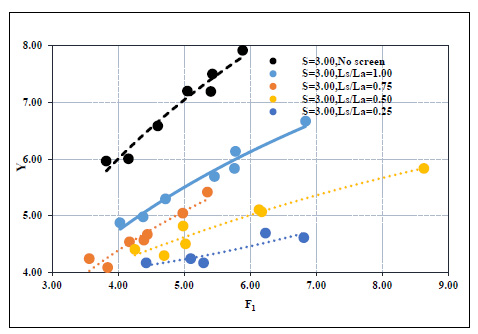
The sequent depth of the hydraulic jump was sensitive to the energy loss changing through the jump. Hence, as the energy loss through the hydraulic jump increased, the sequent depth of the jump decreased, then the relative depth of the hydraulic jump also decreased. Fig. (14) showed the relation between the relative depth of the hydraulic jump and the initial Froude number at S= 3.00 for different relative screen locations. For all different submergence ratios, any increase of the initial Froude number directly leads to an increase in the relative depth of the hydraulic jump. In addition, for the same submergence ratio and at any specific Froude number, the relative depth of the hydraulic jump increased when the screen was fixed close to the end of the contraction. The best location of the screen was found at ls/la =0.25 that gave the minimum values of the relative depth of the hydraulic jump.
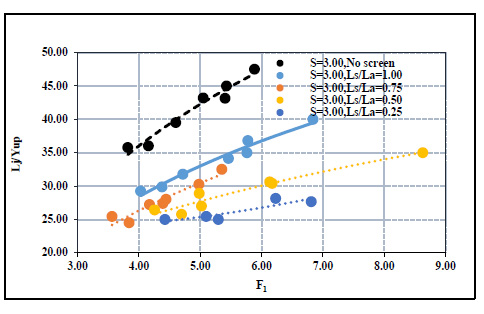
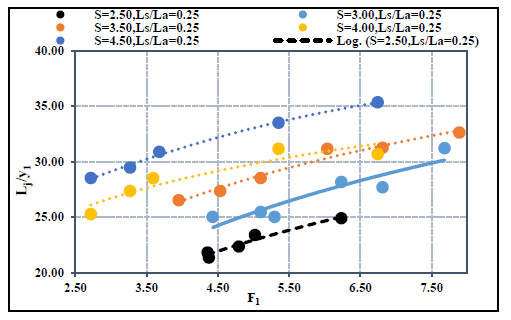
The higher submergence ratios need more tailwater depth. Thus, the flow needs an extra length to reach steady and no remarkable changes in the water depths (i.e., uniform flow). This explains why the relative lengths of the hydraulic jump increase as the submergence ratio increases, as shown in Fig. (11). Fig. (15) showed the relation between the relative length of the hydraulic jump and the initial Froude number at different submergence ratios. For all different submergence ratios, any increase in the initial Froude directly leads to an increase in the relative length of the hydraulic jump. In addition, for the same Froude number, the length of the hydraulic jump decreases when the screen locates near the gate. The higher length of the hydraulic jump occurred in the case of no screen, while the shortest length of the hydraulic jump occurred at ls/la = 0.25.
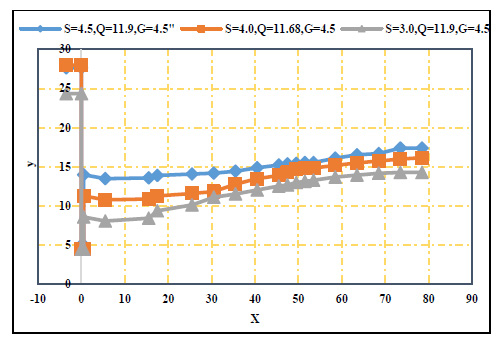
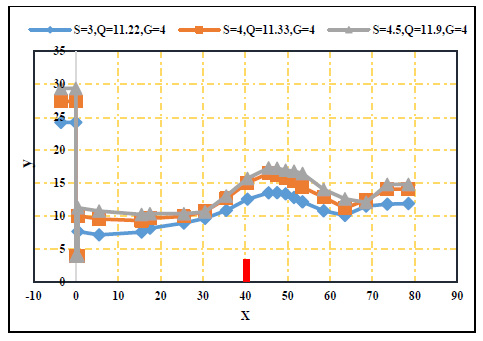
The effect of the screen location on the water surface profile was plotted in Fig. (16). The presence of the screen caused a flow jet similar to projectiles. The top of the jet rises extra when the screen closes to the gate. As the jet rises extra, the turbulence downstream of the screen magnifies, and the energy loss increases. The difference between the top of the jet and the minimum depth of water downstream the screen increases when the screen locates near the gate. Thus, it generates a back pressure that obstructs and resists the flow. For this reason, the presence of the screen accelerates the energy loss and then reduces the length and depth of the hydraulic jump. These differences in the water surfaces slowed down when the screen was located far away from the gate. Consequently, in this case, the energy loss was relatively smaller than the case of the screen fixed near the gate. This led to a rise in the sequent depth of the hydraulic jump, and its length increased. All values of the energy loss, sequent depth and length of the hydraulic jump lay between the values of the hydraulic jump parameters of the no screen case and screen close to the gate. Hence, all cases of the screen require stilling basin walls with a height more than the case of no screen. Otherwise, the case of no screen needs more embankments height than the case with a screen Fig. (17).
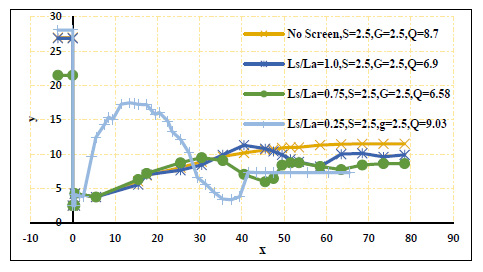
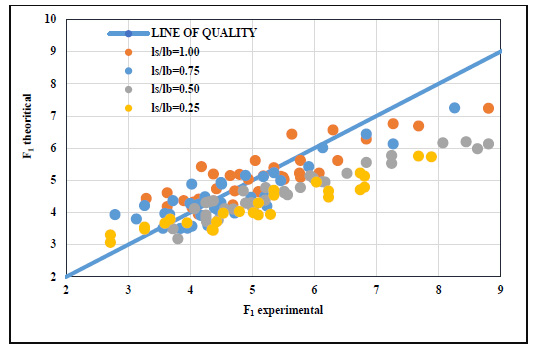
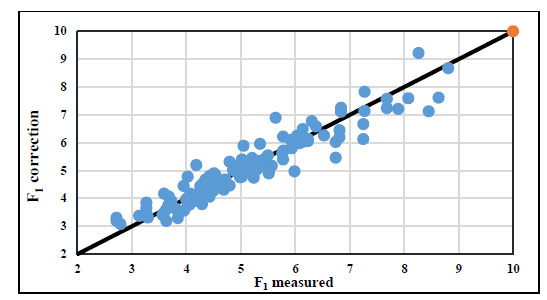
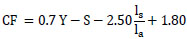
Fig. (19) illustrated the relation between both the theoretical and experimental Froude numbers for the screened case at different locations with different submergence ratios using equation 13. The deviation around the equality line increased with the increase of the Froude number; it also increased with the decreasing of the relative screen location with a 29.0% maximum error. In fact, the impact between the flow jet and the screen played an important role. As the screen location was fixed close to the gate, the impact between the flow jet and the screen increased, causing high turbulences and more energy loss. In this case, the impact caused a rise in the water surface profile upstream of the screen, pushing the water speedily and stretching the surface profile downstream. Consequently, it gave minimum tailwater depths that caused a corresponding reduction in the theoretical Froude number. A correction factor (CF) was utilized as a function of the relative screen location, the relative depth of jump, and the submergence ratio, as specified in equations 20 and 21, respectively, to set the theoretical Froude number with the experimental Froude number,
 |
(20) |
Where; CF is the correction factor and Fcth is the corrected theoretical Froude number
 |
(21) |
Figs. (18-20) showed the relationship between the corrected theoretical Froude number and the experimental Froude number. A good agreement between the results of equation 21 and the experimental results was clearly noticed.
CONCLUSION
Laboratory experiments were conducted to discriminate the submerged hydraulic jump characteristics due to the vertically-placed screen in a sudden expanding stilling basin. The effective screen position was also studied to increase the energy dissipation and improve the characteristics of the submerged hydraulic jump. The conclusions were as follows:
1. The relative energy loss, relative depth and relative hydraulic jump length increased as the inflow Froude number increased for all different submergence ratios.
2. For the same Froude number, a significant decrease in the relative energy loss was associated with the increase of the submerged ratio. Moreover, the relative depth and relative length of the hydraulic jump increased with the increase of the submergence ratio.
3. The presence of the screen in the stilling basin has a significant effect on the submerged hydraulic jump characteristics in terms of the relative energy dissipation, relative sequent depth and relative jump length compared to the case of no screen.
4. The best relative position of the screen in the contracted part was found at the relative screen length of 0.25. The relative energy loss increased by 30% in the case of F1=4.50 and 2.50 submergence ratio with a corresponding decrease in the relative depth and relative hydraulic jump length by 35% and 40%, respectively with respect to no screen case.
5. The derived theoretical equations of the relative depth of the hydraulic jump and the inflow Froude number gave an acceptable agreement with the experimental data.
LIST OF ABBREVIATIONS
| As | = The total screen area (L2) |
| Ao | = Area of holes (L2) |
| b | = Contracted width (L) |
| B | = Channel width (L) |
| Bs | = Screen width (L) |
| d | = Diameter of holes of the screen (L) |
| ∆E | = Energy loss through jump (L) |
| E1 | = Total energy at y1. (L) |
| E2 | = Total energy at y4 (L) |
| e | = Expansion ratio (-) |
| F1 | = Inflow Froude number (-) |
| g | = Gravitational acceleration (LT-2) |
| G | = Gate opening (L) |
| Hup | = Upstream water depth (L) |
| hs | = Screen height (L) |
| ΔH | = The difference between water depths U.S and D.S the screen |
| La | = Length of abutment downstream the gate |
| Lj | = Jump length (L) |
| Ls | = Distance from gate to screen (L) |
| P1 | = Hydrostatic pressure at the beginning of the hydraulic jump |
| P4 | = Hydrostatic pressure at the end of the hydraulic jump |
| Ps | = Hydrostatic pressure below one side of contraction |
| pc1 | = Hydrostatic pressure before the screen |
| pc2 | = Hydrostatic pressure after screen |
| pcnet | = Net pressure applied on screen |
| n | = Number of holes (-) |
| S | = Submergence ratio (y3/y1) (-) |
| v1 | = Velocity at section 1(LT-1) |
| v4 | = Velocity at y4 (LT-1) |
| X | = Distance from the gate at any water depth |
| Y | = Relative depth of jump |
| y | = Depth of water at distance X |
| y1 | = Initial water depth (L) |
| y2 | = Sequent water depth (L) |
| y3 | = Back flow depth (L) |
| y4 | = Tail water depth (L) |
| ys | = Depth at the side expansions of the basin (L) |
| ρ | = Density of water (ML-3) |
| RANS | = Reynolds-Averaged-Navier-Stok |
CONSENT FOR PUBLICATION
Not applicable.
AVAILABILITY OF DATA AND MATERIALS
The data that support the findings of this study are available within the article.
FUNDING
None.
CONFLICT OF INTEREST
The authors declare no conflict of interest, financial or otherwise.
ACKNOWLEDGEMENTS
None declared.

