All published articles of this journal are available on ScienceDirect.

Investigation of Flexural Capacity of Normal and Recycled Aggregate Concrete Filled Steel Tubes
Authors Info & Affiliations
Abstract
Aims:
This paper aims to compare the experimental and theoretical results of the flexural capacity of normal and recycled aggregate concrete-filled tubes (CFT).
Background: The experimental results of 47 CFT specimens made of natural aggregate (NA), recycled concrete aggregate (RCA), and recycled asphalt pavement (RAP) with steel thicknesses of 2 and 2.4 mm from previous research performed by the authors are adopted.
Methods:
The NA was replaced in the CFT specimens by RCA and RAP with replacement levels of 20%, 40%, 60%, 80%, and 100%. The theoretical study is conducted in this paper based on the provisions of many international codes, available models from the literature, and finite element analysis (FEA) using Abaqus software to obtain the best approach for determining the flexural capacity of CFT.
Results:
The results showed that all code provisions were safe to use as they provided conservative results except for the ACI 318-19. The ANSI/AISC 360-16 and CoPHK provided the best conservative and accurate results.
Conclusion:
Besides, the finite element analysis results were found in good agreement with the experimental results as they provided the most accurate estimation.
1. INTRODUCTION
Concrete filled tubes (CFT) have been the focus of recent research due to the advantages they provide to the construction industry [1-18]. The composite action between the steel and concrete infill helps to enhance the characteristics of each element. The steel tube provides triaxial confinement to the concrete infill that improves the concrete strength, which permits using different kinds of concrete such as normal concrete, foamed and lightweight concrete, recycled aggregate concrete, and fly ash, quarry waste and low strength concrete. On the other hand, concrete enhances the steel characteristics by filling the inside void and preventing steel buckling, which improves the structural capacity.
Flor et al. [19] conducted an experimental study on the flexural behavior of large-scale rectangular CFT beams. Two 12 m long specimens were tested under two different methods to pour the concrete into the tubes and six 6 m long beams were tested under pure bending. The ultimate moment capacity was determined based on the plastic stress distribution with all safety factors set to unity. Results proved that for the tested CFT beams, the predicted moment capacity was about 2% higher than the experimental flexural capacity. Xiong et al. [20] investigated the flexural performance of CFT with high tensile steel and ultra-high strength concrete. A total of eight circular, square, single-tube, and double-tube CFSTS were adopted. Results showed that the estimation of the flexural capacity according to the euro code (EC4) could be safely extended to ultra-high strength concrete by considering a reduction factor. Nghiem et al. [21] investigated the flexural performance of circular concrete-filled tubes without axial forces and conducted a comparison using the calculated and measured moment strength of CFT of the current and previous experiments. A total of five specimens were considered in their program, including four CFTS. Theoretical capacities were estimated by using ACI, AISC, and Eurocode 4 equations. All codes predicted the moment strength of CFT beams reasonably well, in which the ACI is the most conservative one among the three codes. Javed et al. [22] conducted a finite element analysis of the flexural behavior of square CFT at ambient and elevated temperature using ANSYS software. The model was verified with the experimental results from previous studies. It was found that the developed FE model can accurately predict the moment capacity of the square CFT beams subjected to flexural loads and fire resistance time, where the load-deflection curves and the ultimate moment capacity were found in a reasonable agreement with the experimental results. El-Nimri R. [23] investigated the flexural behavior of light-gauge steel box sections filled with normal and recycled aggregate concrete under a four-point loading test. A total of forty-seven beams were tested. The experimental results showed that the flexural capacity of CFT beams decreased with the increase of RCA and RAP percentage.
Although prediction of the flexural strength of CFT has been highlighted in several previous research using different codes; there are no clear conclusions on the best approach for determining the flexural capacity of CFT.
In this paper, the experimental results of 47 CFT specimens made of natural aggregate (NA), recycled concrete aggregate (RCA), and recycled asphalt pavement (RAP) with steel thickness of 2 and 2.4 mm from previous research [23] performed by the authors are adopted. The NA was replaced in the CFT specimens by RCA and RAP with replacement levels of 20%, 40%, 60%, 80%, and 100%. The experimental results are compared with the theoretical results from different international codes such as: Building Code Requirements for Structural Concrete (ACI 318-19) [24], Eurocode 4: Design of composite steel and concrete structures (EC4) [25], Specification for Structural Steel Buildings (ANSI/AISC 360-16) [26], Load and resistance factor design specification for structural steel buildings (AISC-LRFD 1999) [27], Recommendations for the design and construction of concrete filled steel tubular structures (AIJ 1997) [28], British Standards for steel, concrete, and composite bridges (BS 5400-5:1979) [29], the rigid plastic theory (RPT) [30], Code of Practice for the Structural Use of Steel 2005 (CoPHK) [31], and the proposed method by Han [5]. Moreover, the experimental results were compared with the finite element analysis (FEA) results by using Abaqus software to obtain the best approach for determining the flexural capacity of CFT.
2. THEORETICAL STUDY USING CODES AND MODELS
2.1. ACI 318-19
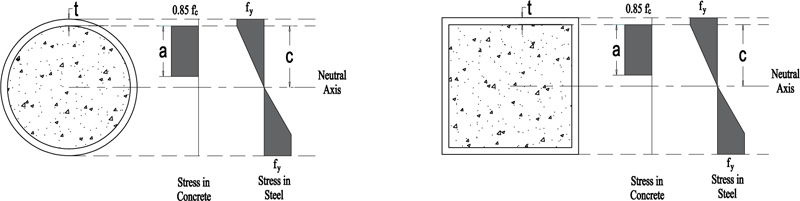
The ACI 318-19 code [24] assumes that the maximum strain at the extreme concrete compression fiber εc equals 0.003, while the tensile strength is neglected. Moreover, a uniformly distributed stress of 0.85f'c is assumed over an equivalent compression zone bounded by edges of the cross-section and a line parallel to the neutral axis located distance (a) from the fiber of maximum compressive strain, as calculated by a = β1c, where c is the perpendicular distance from the most compressed fiber to the neutral axis, β1 is a factor relating the depth of equivalent rectangular compressive stress block to depth of neutral axis, and f'c is the specified compressive strength of concrete.
Furthermore, the ACI 318-19 assumes that the reinforcement stress is proportional for strain below the specified yield strength fy. Fig. (1) illustrates the stress distribution along the cross section according to the ACI 318-19.
2.2. EUROCODE 4
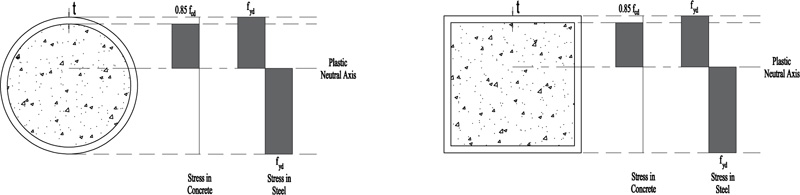
The EC4 [25] assumes the full interaction between steel and concrete, in which the effective area of concrete in compression resists a constant stress of 0.85fcd over the whole depth between the plastic neutral axis and the most compressed fiber of the concrete, where fcd is the design cylinder compressive strength. On the other hand, the steel is stressed to its design yield strength fyd in tension or compression. Fig. (2) illustrates the stress distribution along the cross section according to the EC4.
2.3. ANSI/AISC 360-16
The nominal strength of composite sections is calculated based on either the plastic stress distribution method, the strain compatibility method, the elastic stress distribution method, or the effective stress-strain method.
2.3.1. Plastic Stress Distribution Method (PSDM)
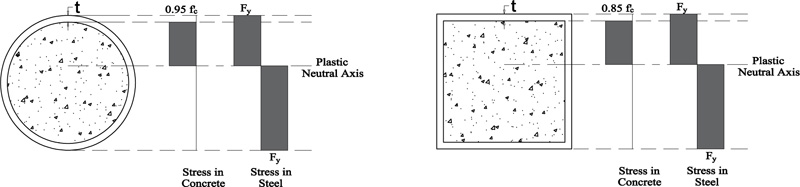
The steel is assumed to reach its yield stress (Fy) in tension and compression, and the concrete in compression is stressed to 0.85f'c due to axial force or flexure, where f'c is the specified compressive strength of concrete. For round hollow structural steel (HSS), concrete, compression stress of 0.95f'c can be used because of concrete confinement. Fig. (3) provides an illustration of the stress distribution according to PSDM method.
2.3.2. Strain Compatibility Method (SCM)
Across the section, a linear strain distribution is assumed with the strain of concrete at the maximum compressed compression fiber equals 0.003.
2.4. AISC-LRFD (1999)
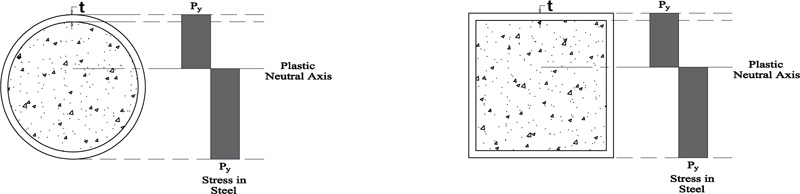
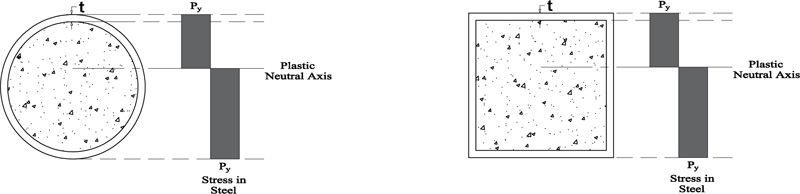
The AISC-LRFD [27] provisions assume that the moment capacity of hollow structural steel beams filled with concrete depends only on the steel section alone. Thus, the ultimate moment of resistance is assumed to be calculated based on a full plastic stress distribution on the steel section without any contribution from concrete. The stress distribution along the cross section according to the AISC-LRFD is shown in Fig. (4).
2.5. AIJ
The AIJ code [28] provisions assume that when calculating the ultimate moment of resistance of a concrete-filled tube member, each of the steel and concrete infills develops their individual plastic strengths, without accounting for the compatibility between steel and concrete. For members subjected to pure flexural load, the ultimate moment of resistance is calculated based on a full plastic stress distribution on the steel section alone, which is the same method used in the AISC-LRFD. Fig. (5) illustrates the stress distribution along the cross section according to the AIJ.
2.6. BS 5400-5:1979
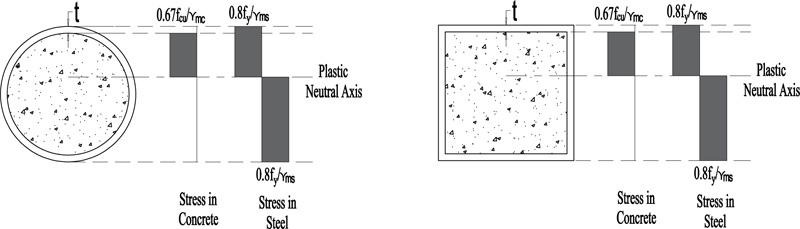
BS 5400-5 [29] assumes the concrete stress in compression equal to  over the whole compression zone, where fcu is the characteristic concrete cube strength and γmc is a partial safety factor for strength and is equal to 1.5. In the case of rectangular sections and flanged, ribbed, and voided sections where the neutral axis lies within the flange, the concrete compressive stress may be taken as 0.4fcu. In both cases, the strain at the maximum compression fiber at failure is 0.0035. Stresses in steel in both tension and compression equals
  , where fy is the characteristic strength of reinforcement and γms is a partial safety factor for strength and equals 1.15. Fig. (6) illustrates the stress distribution along the cross section according to the BS 5400-5.
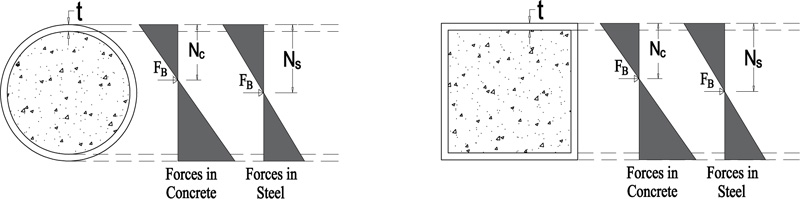
2.7. Rigid Plastic Theory (RPT)
Rigid plastic analysis theory [30] is used to calculate the moment capacity for concrete-filled steel tubes. The flexural strength is obtained by determining the force distribution of both the steel and concrete individually and introducing the interaction between the steel and concrete by a bond force. Fig. (7) illustrates the stress distribution along the cross section according to the RPT.
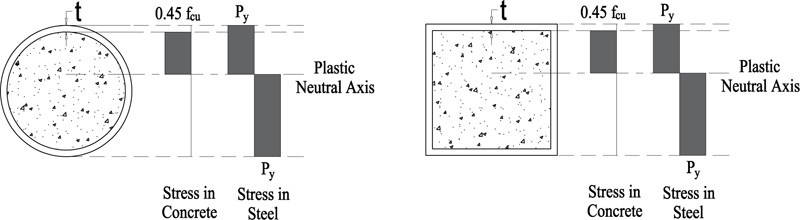
2.8. Code of Practice for the Structural Use of Steel 2005 (CoPHK)
The plastic moment capacity is calculated according to the assumption of concrete is stressed to 0.45fcu over the whole depth from the most compressed fiber to the plastic neutral axis, where fcu is the cube compressive strength of concrete. On the other hand, the structural steel is stressed to its designed yield stress of Py either in tension or compression. Fig. (8) illustrates the stress distribution along the cross section according to the CoPHK [31].
2.9. The Proposed Method by Han
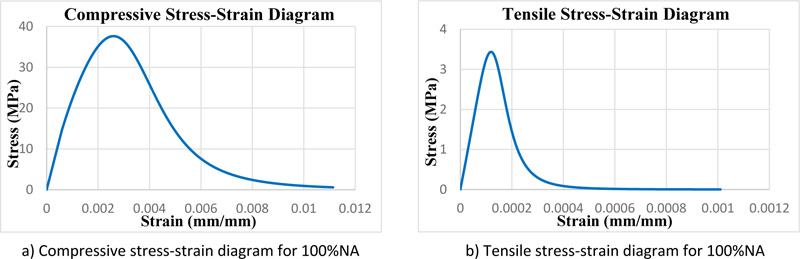
Han 2004 [5] defines the flexural strength as:
 |
(1) |
where:
Mu is the moment capacity of the composite beams.
fscy is the nominal yielding strength of the composite sections, given by:
• ƒ scy = (1.18 + 0.85 ξ) x ƒck for square and rectangular sections
• ƒ scy = (1.14 + 1.02 ξ) x ƒck for circular sections
Wscm is the section modulus of the composite beam, given by:
• B3/6 for composite beams with square sections
• BD2/6 and B2D/6 about major (x–x) and minor (y–y) axes, respectively, for composite beams with rectangular sections
• (πD3)/32 for composite beams with circular sections
γm is a flexural strength index, given by:
• γm = 1.04 + 0.48 ln(ξ + 0.1) for square and rectangular sections
• γm = 1.1 + 0.48 ln(ξ + 0.1) for circular sections
ξ is a confinement factor equal to
 |
Where As is the cross-sectional area of the steel tube, Ac is the cross-sectional area of the concrete core, fsy is the yield stress of the outer steel tube, and fck is the compression strength of concrete in which for normal strength concrete is determined using 67% of the compression strength of cubic blocks.
3. MATERIALS AND METHODS
A set of previous tests performed by El-Nimri et al. [23] were used to measure the accuracy of the existing code provisions. The samples were light-gauge steel beams filled with NA, RCA, and RAP. The NA was replaced by RCA and RAP with different replacement levels of 0%, 20%, 40%, 60%, 80%, and 100% by weight. In addition, RCA and RAP were incorporated in the same mixes with four replacement levels of (20% RCA and 80% RAP); (40% RCA and 60% RAP); (60% RCA and 40% RAP); and (80% RCA and 20% RAP). The mass, density, and compressive strength for all concrete mixes are illustrated in Table 1.
| Mix Number | Mass (kg) |
Density (kg/m3) |
fcu at 7 Days (MPa) | fcu at 28 Days (MPa) | Relative fcu |
|---|---|---|---|---|---|
| Control Mix | 8.44 | 2501.16 | 23.41 | 37.62 | 0.62 |
| 20% RCA + 80% NA | 8.04 | 2382.32 | 19.75 | 32.36 | 0.61 |
| 40% RCA + 60% NA | 7.84 | 2322.72 | 16.14 | 29.04 | 0.56 |
| 60% RCA + 40% NA | 7.80 | 2310.86 | 16.99 | 30.09 | 0.57 |
| 80% RCA + 20% NA | 7.87 | 2330.86 | 17.80 | 27.946 | 0.64 |
| 100% RCA | 7.59 | 2247.7 | 13.42 | 20.83 | 0.64 |
| 20% RAP + 80% NA | 8.04 | 2383.49 | 20.47 | 27.96 | 0.73 |
| 40% RAP + 60% NA | 7.84 | 2323.75 | 16.89 | 26.94 | 0.63 |
| 60% RAP + 40% NA | 7.81 | 2314.37 | 19.73 | 26.96 | 0.73 |
| 80% RAP + 20% NA | 7.66 | 2269.63 | 16.36 | 25.14 | 0.65 |
| 100% RAP | 7.51 | 2225.93 | 17.99 | 23.02 | 0.78 |
| 20% RCA + 80% RAP | 7.57 | 2242.12 | 17.78 | 23.24 | 0.77 |
| 40% RCA + 60% RAP | 7.68 | 2274.57 | 15.27 | 21.81 | 0.70 |
| 60% RCA + 40% RAP | 7.65 | 2265.98 | 17.65 | 21.89 | 0.81 |
| 80% RCA + 20% RAP | 7.69 | 2279.44 | 18.09 | 27.74 | 0.65 |
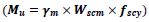
The composite beams had two steel thicknesses of 2 mm and 2.4 mm. Fifteen composite specimens of each steel thickness were considered, producing a total of thirty composite beams, all having a square cross-section of 100x100 mm and 1200 mm length. Fig. (9) shows the specimen's cross-section.
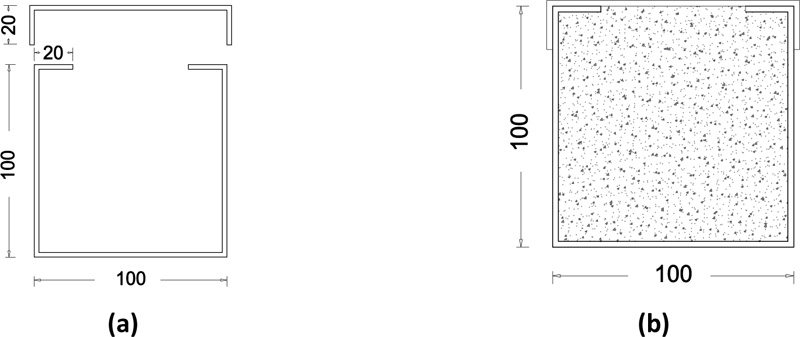
All specimens were considered as simply supported beams tested under Two-point loading test configuration using a 700 kN capacity MFL Prüf-systeme Universal Testing Machine. Fig. (10) shows the test setup. The deflection at the mid span and the applying load locations was measured using three LVDT devices with an accuracy of 0.01 mm. The deflection was measured at 10 kN intervals until failure.
4. THEORETICAL STUDY USING FINITE ELEMENT ANALYSIS (FEA)
A finite model was adopted using Abaqus software to calculate the flexural capacity of CFT based on the material properties defined in the previous section.
4.1. Parts
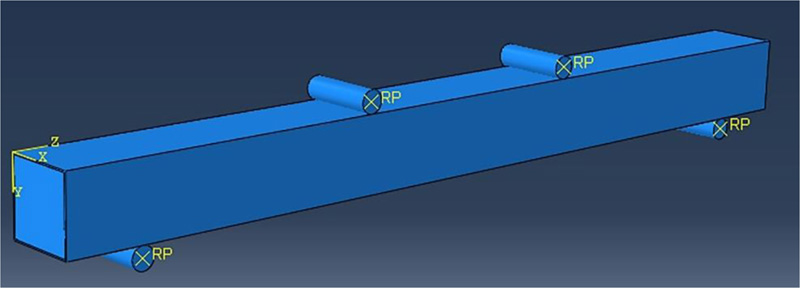
The composite beams were constructed using two solid homogeneous parts - the steel tube and concrete infill. Discrete rigid rods were defined to simulate the supports and to apply the experimental displacement to the beams.
4.2. Material Models
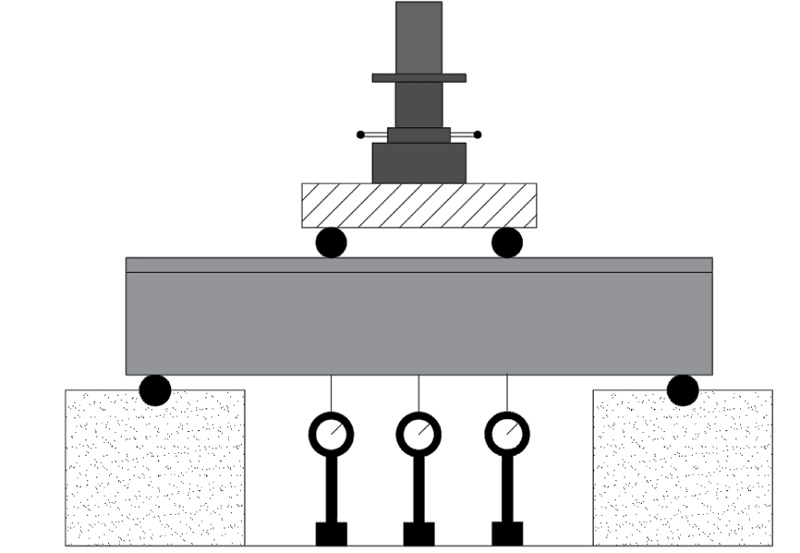
Steel was defined as elastic-plastic material, while Tsai’s equations were used to simulate the compressive and tensile behavior of concrete [32] Fig. (11) illustrates the stress-strain diagrams used for concrete.
4.3. Meshing
A sensitivity analysis was performed with different seeds sizes (50, 30, and 25 mm) and mesh shapes (hexahedral and wedge shapes) to obtain the most accurate results with the least computational time. The best results were recorded using 30 mm mesh size and hexahedral shape; thus, this mesh was approved to continue the analysis. All parts were meshed prior to the assembly of the beams.
4.4. Interactions
General contact with hard contact properties and 0.3 friction coefficient was defined between the beam and the steel rods that were used to induce the deflection to the beam as shown in Fig. (12), while a cohesive property was defined between the steel inner face and the concrete outer face based on the tensile stress of each mix defined in the Materials section.
4.5. Boundary Conditions and Test Setup
The supports were defined as pin supports to simulate the actual setup. A displacement control analysis was performed by applying the experimental displacement to the composite beams using two discrete rigid rods in a dynamic explicit step. The two rods were prohibited from translating in any direction except for the direction of the displacement (U2).
4.6. Abaqus Results
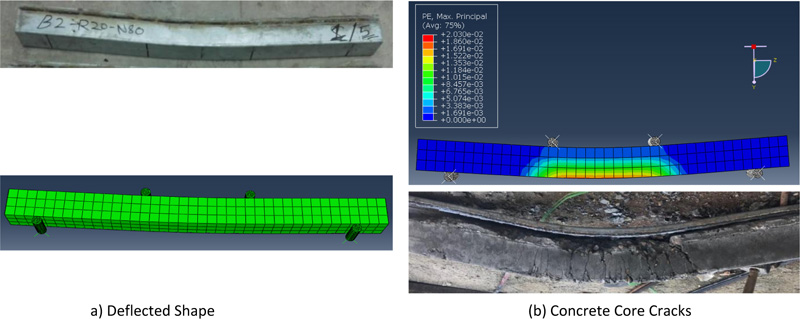
The calibration of the model took place by comparing the deflected shape of beams, concrete core cracks at failure, and the load-deflection behavior. The deflected shape of beams and the cracks in concrete agreed well with the experimental results as shown in Fig. (13).
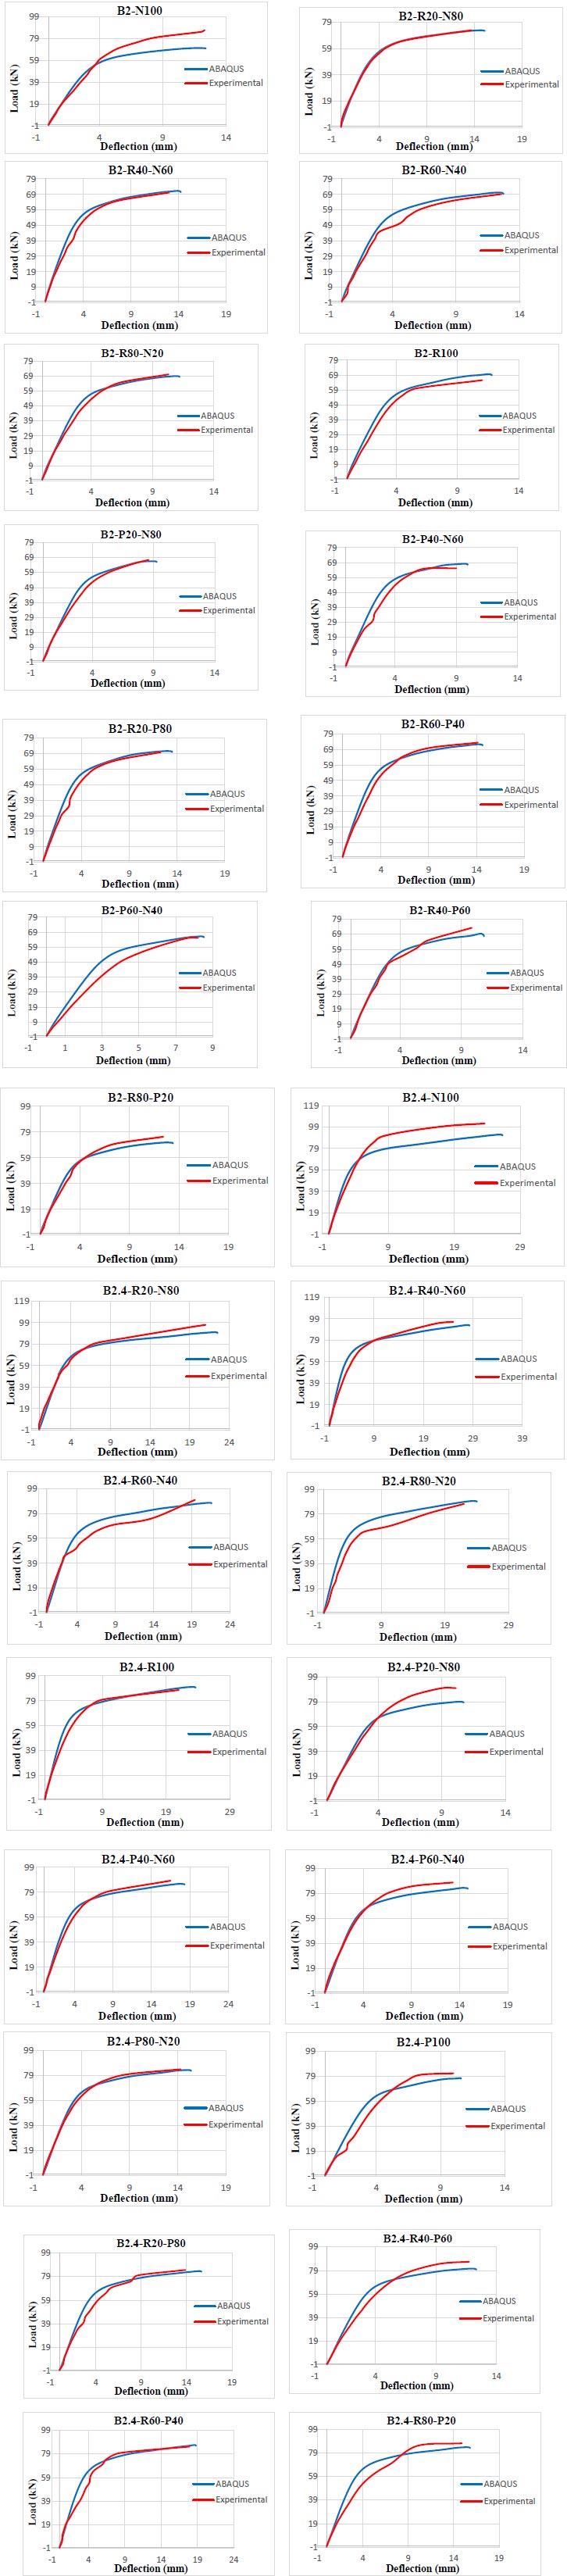
The load-deflection behavior obtained from Abaqus was also compared with the experimental behavior of all beams and the results are illustrated in Fig. (14).
5. RESULTS
The theoretical capacities were calculated according to the above-mentioned codes and compared with the experimental and finite element analysis results. All results are illustrated in Tables 2 and 3 for 2 mm and 2.4 mm steel tubes, respectively.
| Sample | Muexp [23] | ACI 318-19 [24] | EC4 [25] | ANSI/AISC 360-16 [26] | AISC-LRFD [27] | AIJ [28] | BS 5400-5 with ɤmc and ɤms [29] | BS 5400-5 without ɤmc and ɤms [29] | RPT [30] | CoPHK [31] | Han [5] | FEA Model | |||||||||||
|---|---|---|---|---|---|---|---|---|---|---|---|---|---|---|---|---|---|---|---|---|---|---|---|
| MACI | MACI/Mue | MEC4 | MEC4/Mue | MANSI | MANSI/Mue | MAISC | MAISC/Mue | MAIJ | MAIJ/Mue | MBS | MBS/Mue | MBS | MBS/Mue | MRPT | MRPT/Mue | MCoPHK | MCoPHK/Mue | MHan | MHan/Mue | MFE | MFE/Mue | ||
| B2 – N100 | 14.48 | 13.50 | 0.932 | 10.28 | 0.710 | 11.04 | 0.762 | 9.66 | 0.667 | 9.66 | 0.667 | 7.67 | 0.530 | 8.83 | 0.610 | 10.49 | 0.724 | 11.02 | 0.761 | 10.30 | 0.711 | 11.71 | 0.808 |
| B2 – R20 – N80 | 12.18 | 13.30 | 1.092 | 10.24 | 0.841 | 11.03 | 0.906 | 9.66 | 0.793 | 9.66 | 0.793 | 7.67 | 0.630 | 8.83 | 0.725 | 10.45 | 0.858 | 11.02 | 0.905 | 10.06 | 0.826 | 12.13 | 0.996 |
| B2 – R40 – N60 | 11.75 | 13.16 | 1.120 | 10.21 | 0.869 | 11.03 | 0.939 | 9.66 | 0.822 | 9.66 | 0.822 | 7.67 | 0.652 | 8.82 | 0.751 | 10.41 | 0.886 | 11.01 | 0.937 | 9.92 | 0.844 | 11.88 | 1.011 |
| B2 – R60 – N40 | 11.58 | 13.21 | 1.141 | 10.22 | 0.883 | 11.03 | 0.953 | 9.66 | 0.834 | 9.66 | 0.834 | 7.67 | 0.662 | 8.83 | 0.762 | 10.42 | 0.900 | 11.02 | 0.951 | 9.96 | 0.860 | 11.70 | 1.010 |
| B2 – R80 – N20 | 11.75 | 13.12 | 1.116 | 10.2 | 0.868 | 11.03 | 0.939 | 9.66 | 0.822 | 9.66 | 0.822 | 7.67 | 0.652 | 8.82 | 0.751 | 10.4 | 0.885 | 11.01 | 0.937 | 9.87 | 0.840 | 11.51 | 0.979 |
| B2 – R100 | 10.98 | 12.77 | 1.163 | 10.13 | 0.923 | 11.02 | 1.004 | 9.66 | 0.880 | 9.66 | 0.880 | 7.66 | 0.698 | 8.82 | 0.803 | 10.25 | 0.934 | 11.01 | 1.002 | 9.58 | 0.873 | 11.60 | 1.057 |
| B2 – P20 – N80 | 11.3 | 13.12 | 1.161 | 10.2 | 0.903 | 11.03 | 0.976 | 9.66 | 0.855 | 9.66 | 0.855 | 7.67 | 0.678 | 8.82 | 0.781 | 10.4 | 0.920 | 11.01 | 0.975 | 9.87 | 0.873 | 11.10 | 0.983 |
| B2 – P40 – N60 | 10.91 | 13.07 | 1.198 | 10.19 | 0.934 | 11.03 | 1.011 | 9.66 | 0.885 | 9.66 | 0.885 | 7.67 | 0.703 | 8.82 | 0.809 | 10.39 | 0.952 | 11.01 | 1.009 | 9.83 | 0.901 | 11.37 | 1.042 |
| B2 – P60 – N40 | 10.93 | 13.07 | 1.196 | 10.19 | 0.932 | 11.03 | 1.009 | 9.66 | 0.884 | 9.66 | 0.884 | 7.67 | 0.701 | 8.82 | 0.807 | 10.39 | 0.951 | 11.01 | 1.008 | 9.83 | 0.899 | 11.04 | 1.010 |
| B2 – R20 – P80 | 11.69 | 12.89 | 1.103 | 10.16 | 0.869 | 11.03 | 0.943 | 9.66 | 0.826 | 9.66 | 0.826 | 7.66 | 0.655 | 8.82 | 0.754 | 10.28 | 0.879 | 11.01 | 0.942 | 9.67 | 0.828 | 11.77 | 1.007 |
| B2 – R40 – P60 | 12.28 | 12.82 | 1.044 | 10.14 | 0.826 | 11.02 | 0.898 | 9.66 | 0.787 | 9.66 | 0.787 | 7.66 | 0.624 | 8.82 | 0.718 | 10.27 | 0.836 | 11.01 | 0.896 | 9.62 | 0.783 | 11.57 | 0.943 |
| B2 – R60 – P40 | 12.28 | 12.82 | 1.044 | 10.15 | 0.827 | 11.02 | 0.898 | 9.66 | 0.787 | 9.66 | 0.787 | 7.66 | 0.624 | 8.82 | 0.718 | 10.27 | 0.836 | 11.01 | 0.896 | 9.62 | 0.784 | 12.05 | 0.981 |
| B2 – R80 – P20 | 12.6 | 13.11 | 1.040 | 10.2 | 0.810 | 11.03 | 0.875 | 9.66 | 0.767 | 9.66 | 0.767 | 7.67 | 0.608 | 8.82 | 0.700 | 10.4 | 0.825 | 11.01 | 0.874 | 9.86 | 0.783 | 11.80 | 0.937 |
| Mean | 1.104 | 0.861 | 0.932 | 0.816 | 0.816 | 0.648 | 0.745 | 0.876 | 0.930 | 0.831 | 0.982 | ||||||||||||
| Coefficient of variation | 0.065 | 0.068 | 0.070 | 0.070 | 0.070 | 0.070 | 0.070 | 0.068 | 0.070 | 0.063 | 0.061 | ||||||||||||
| Reduction Percent | -10.4 | 13.9 | 6.8 | 18.4 | 18.4 | 35.2 | 25.5 | 12.4 | 7.0 | 16.9 | 1.8 | ||||||||||||
| Sample | Muexp [23] | ACI 318-19 [24] | EC4 [25] | ANSI/AISC 360-16 [26] | AISC-LRFD [27] | AIJ [28] | BS 5400-5 with ɤmc and ɤms [29] | BS 5400-5 without ɤmc and ɤms [29] | RPT [30] | CoPHK [31] | Han [5] | FEA Model | |||||||||||
|---|---|---|---|---|---|---|---|---|---|---|---|---|---|---|---|---|---|---|---|---|---|---|---|
| MACI | MACI/Mue | MEC4 | MEC4/Mue | MANSI | MANSI/Mue | MAISC | MAISC/Mue | MAIJ | MAIJ/Mue | MBS | MBS/Mue | MBS | MBS/Mue | MRPT | MRPT/Mue | MCoPHK | MCoPHK/Mue | MHan | MHan/Mue | MFE | MFE/Mue | ||
| B2.4 – N100 | 17.10 | 15.87 | 0.928 | 12.22 | 0.715 | 13.19 | 0.771 | 11.58 | 0.677 | 11.58 | 0.677 | 9.16 | 0.536 | 10.55 | 0.617 | 12.45 | 0.728 | 13.17 | 0.770 | 12.15 | 0.711 | 15.32 | 0.896 |
| B2.4 – R20 – N80 | 16.22 | 15.65 | 0.965 | 12.18 | 0.751 | 13.18 | 0.813 | 11.58 | 0.714 | 11.58 | 0.714 | 9.16 | 0.565 | 10.54 | 0.650 | 12.3 | 0.758 | 13.16 | 0.811 | 11.92 | 0.735 | 15.02 | 0.926 |
| B2.4 – R40 – N60 | 16.08 | 15.49 | 0.963 | 12.15 | 0.756 | 13.18 | 0.819 | 11.58 | 0.720 | 11.58 | 0.720 | 9.16 | 0.570 | 10.54 | 0.656 | 12.27 | 0.763 | 13.16 | 0.818 | 11.79 | 0.733 | 15.54 | 0.966 |
| B2.4 – R60 – N40 | 15.05 | 15.54 | 1.033 | 12.16 | 0.808 | 13.18 | 0.876 | 11.58 | 0.769 | 11.58 | 0.769 | 9.16 | 0.609 | 10.54 | 0.700 | 12.28 | 0.816 | 13.16 | 0.874 | 11.83 | 0.786 | 14.62 | 0.971 |
| B2.4 – R80 – N20 | 14.60 | 15.44 | 1.058 | 12.14 | 0.832 | 13.18 | 0.903 | 11.58 | 0.793 | 11.58 | 0.793 | 9.16 | 0.627 | 10.54 | 0.722 | 12.25 | 0.839 | 13.16 | 0.901 | 11.74 | 0.804 | 14.93 | 1.023 |
| B2.4 – R100 | 14.66 | 15.06 | 1.027 | 12.06 | 0.823 | 13.17 | 0.898 | 11.58 | 0.790 | 11.58 | 0.790 | 9.15 | 0.624 | 10.53 | 0.718 | 12.16 | 0.829 | 13.15 | 0.897 | 11.50 | 0.784 | 15.01 | 1.024 |
| B2.4 – P20 – N80 | 15.21 | 15.44 | 1.015 | 12.14 | 0.798 | 13.18 | 0.866 | 11.58 | 0.761 | 11.58 | 0.761 | 9.16 | 0.602 | 10.54 | 0.693 | 12.25 | 0.805 | 13.16 | 0.865 | 11.74 | 0.772 | 13.18 | 0.866 |
| B2.4 – P40 – N60 | 14.76 | 15.39 | 1.042 | 12.13 | 0.822 | 13.17 | 0.892 | 11.58 | 0.784 | 11.58 | 0.784 | 9.16 | 0.620 | 10.54 | 0.714 | 12.24 | 0.829 | 13.16 | 0.891 | 11.70 | 0.793 | 14.29 | 0.968 |
| B2.4 – P60 – N40 | 14.68 | 15.39 | 1.048 | 12.13 | 0.826 | 13.17 | 0.897 | 11.58 | 0.789 | 11.58 | 0.789 | 9.16 | 0.624 | 10.54 | 0.718 | 12.24 | 0.834 | 13.16 | 0.896 | 11.70 | 0.797 | 13.91 | 0.947 |
| B2.4 – P80 – N20 | 14.05 | 15.29 | 1.089 | 12.11 | 0.862 | 13.17 | 0.938 | 11.58 | 0.824 | 11.58 | 0.824 | 9.16 | 0.652 | 10.54 | 0.750 | 12.22 | 0.870 | 13.15 | 0.936 | 11.64 | 0.828 | 13.90 | 0.990 |
| B2.4 – P100 | 13.60 | 15.18 | 1.117 | 12.09 | 0.889 | 13.17 | 0.969 | 11.58 | 0.852 | 11.58 | 0.852 | 9.15 | 0.673 | 10.54 | 0.775 | 12.19 | 0.897 | 13.15 | 0.967 | 11.56 | 0.851 | 12.91 | 0.950 |
| B2.4 – R20 – P80 | 14.16 | 15.19 | 1.073 | 12.09 | 0.854 | 13.17 | 0.930 | 11.58 | 0.818 | 11.58 | 0.818 | 9.15 | 0.646 | 10.54 | 0.744 | 12.19 | 0.861 | 13.15 | 0.929 | 11.57 | 0.817 | 13.95 | 0.985 |
| B2.4 – R40 – P60 | 14.46 | 15.11 | 1.045 | 12.07 | 0.835 | 13.17 | 0.910 | 11.58 | 0.801 | 11.58 | 0.801 | 9.15 | 0.633 | 10.53 | 0.728 | 12.17 | 0.841 | 13.15 | 0.909 | 11.53 | 0.797 | 13.44 | 0.929 |
| B2.4 – R60 – P40 | 14.26 | 15.12 | 1.060 | 12.07 | 0.846 | 13.17 | 0.923 | 11.58 | 0.812 | 11.58 | 0.812 | 9.15 | 0.642 | 10.53 | 0.739 | 12.17 | 0.853 | 13.15 | 0.922 | 11.53 | 0.808 | 14.43 | 1.012 |
| B2.4 – R80 – P20 | 14.58 | 15.43 | 1.058 | 12.4 | 0.851 | 13.18 | 0.904 | 11.58 | 0.794 | 11.58 | 0.794 | 9.16 | 0.628 | 10.54 | 0.723 | 12.25 | 0.840 | 13.16 | 0.902 | 11.73 | 0.805 | 13.97 | 0.958 |
| Mean | 1.035 | 0.818 | 0.887 | 0.780 | 0.780 | 0.617 | 0.710 | 0.824 | 0.886 | 0.788 | 0.961 | ||||||||||||
| Coefficient of variation | 0.047 | 0.055 | 0.057 | 0.057 | 0.057 | 0.057 | 0.057 | 0.053 | 0.124 | 0.046 | 0.045 | ||||||||||||
| Reduction Percent | -3.5 | 18.2 | 11.3 | 22.0 | 22.0 | 38.3 | 29.0 | 17.6 | 11.4 | 21.2 | 3.9 | ||||||||||||
B2, B2.4: composite beam of 2 mm and 2.4 mm steel thickness, respectively.
N: Natural aggregate concrete (NA).
R: Recycled concrete aggregate (RCA).
P: Recycled asphalt pavement aggregate (RAP).
6. DISCUSSION
For both 2 mm and 2.4 mm steel thicknesses, not all codes were conservative in predicting the theoretical capacity. The ACI 318-19 [24] overestimated the capacity by about 10% and 4% for 2 mm and 2.4 mm steel, respectively. It gave higher results of 12 specimens out of 13 for 2 mm steel and 12 specimens out of 15 for 2.4 mm steel. Fig. (15) shows a comparison of results for both steel thicknesses.
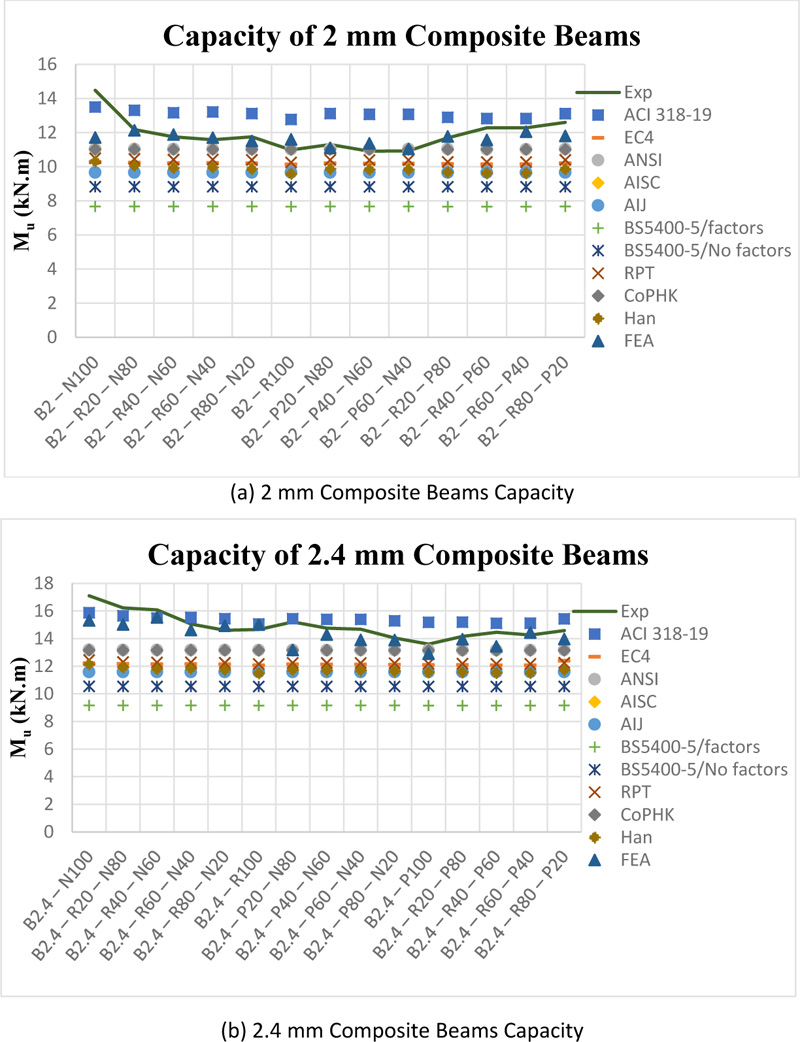
For 2 mm steel, the ANSI/AISC 360-16 [26] and CoPHK [31] provided conservative and the most accurate results among all codes with a reduction percent of about 7% and a coefficient of variation of 0.070. Both codes predicted the exact capacities of 3 specimens, namely, B2 – R100; B2 – P40 – N60; and B2 – P60 – N40, while the calculated moments of other samples were smaller than the experimental ones. The RPT [30], EC4 [25], and the proposed method by Han [5] provided good estimation of moments, but they underestimated the capacities by about 12%, 14%, and 17%, respectively.
The AISC-LRFD [27] and AIJ [28] used the same approach to calculate the bending moments of CFT. Both codes provided conservative results with a reduction percent of about 18%. Finally, the theoretical moments were calculated according to the BS 5400-5 [29] twice, one time with γmc and γms having their values as defined by the code and another time taken as unity. In the case where γmc and γms were taken as unity, a 26% reduction percent was recorded, while when their values were under consideration, the highest reduction percent was recorded, which was about 35%.
For 2.4 mm steel tubes, the accuracy of the codes was found to have the same order as the 2 mm steel thickness but with different reduction percent. The lowest reduction was recorded for the ANSI/AISC 360-16 [26] and CoPHK [31] with a value of 11%, followed by the RPT [30] and EC4 [25] with a value of 18%. The proposed method by Han [5] recorded values with 21% reduction percent. Because both the AISC-LRFD [27] and AIJ [28] used the same assumptions, their values were 22% lower than the experimental ones. Finally, the BS 5400-5 [29] recorded capacities with 29% reduction when γmc and γms were taken as unity and 38% lower than the experimental values when γmc and γms were considered.
Another aspect was used to assess the effect of the compressive strength of concrete on the results obtained by the previous methods [32-34]. Tables 4 and 5 illustrate the reduction in the flexural capacity obtained from previous equations compared to the actual reduction in the experimental results according to the reduction of compressive strength for 2 and 2.4 mm steel thicknesses, respectively. Since the AISC-LRFD [27] and AIJ [28] codes do not consider the concrete core in the calculations, they were not included in the comparison. It can be seen from the tables that the flexural capacity of all composite beams was reduced due to the reduction in the compressive strength of concrete. The capacity of composite beams filled with recycled aggregates was (13%-25%) and (5%-20%) lower than the composite beams filled with normal concrete for 2 and 2.4 mm beams, respectively. However, the reduction in flexural strength according to the ANSI/AISC 360-16 [26], BS 5400-5 [29], and CoPHK [31] was 0% for all composite beams, while for the ACI 318-19 [24], EC4 [25], RPT [30], Han [5], and the Abaqus results were negligible, with the highest reduction recorded for the Abaqus results. This does not agree well with the experimental results.
| f'c (MPa) | Mu (kN.m) | Reduction in f'c | Reduction in Mu | MACI | MEC4 | MANSI |
MBS/ factors |
MBS/no factors | MRPT | MCoPHK | MHan | MFE | |
|---|---|---|---|---|---|---|---|---|---|---|---|---|---|
| B2 – N100 | 37.62 | 14.48 | - | - | - | - | - | - | - | - | - | - | - |
| B2 – R20 – N80 | 32.36 | 12.18 | 14% | 16% | 1% | 0% | 0% | 0% | 0% | 0% | 0% | 2% | -4% |
| B2 – R40 – N60 | 29.04 | 11.75 | 23% | 19% | 3% | 1% | 0% | 0% | 0% | 1% | 0% | 4% | -1% |
| B2 – R60 – N40 | 30.09 | 11.58 | 20% | 20% | 2% | 1% | 0% | 0% | 0% | 1% | 0% | 3% | 0% |
| B2 – R80 – N20 | 27.95 | 11.75 | 26% | 19% | 3% | 1% | 0% | 0% | 0% | 1% | 0% | 4% | 2% |
| B2 – R100 | 20.83 | 10.98 | 45% | 24% | 5% | 1% | 0% | 0% | 0% | 2% | 0% | 7% | 1% |
| B2 – P20 – N80 | 27.96 | 11.30 | 26% | 22% | 3% | 1% | 0% | 0% | 0% | 1% | 0% | 4% | 5% |
| B2 – P40 – N60 | 26.94 | 10.91 | 28% | 25% | 3% | 1% | 0% | 0% | 0% | 1% | 0% | 5% | 3% |
| B2 – P60 – N40 | 26.96 | 10.93 | 28% | 25% | 3% | 1% | 0% | 0% | 0% | 1% | 0% | 5% | 6% |
| B2 – P80 – N20 | 25.14 | - | - | - | - | - | - | - | - | - | - | - | - |
| B2 – P100 | 23.02 | - | - | - | - | - | - | - | - | - | - | - | - |
| B2 – R20 – P80 | 23.24 | 11.69 | 38% | 19% | 5% | 1% | 0% | 0% | 0% | 2% | 0% | 6% | -1% |
| B2 – R40 – P60 | 21.81 | 12.28 | 42% | 15% | 5% | 1% | 0% | 0% | 0% | 2% | 0% | 7% | 1% |
| B2 – R60 – P40 | 21.89 | 12.28 | 42% | 15% | 5% | 1% | 0% | 0% | 0% | 2% | 0% | 7% | -3% |
| B2 – R80 – P20 | 27.74 | 12.60 | 26% | 13% | 3% | 1% | 0% | 0% | 0% | 1% | 0% | 4% | -1% |
| f'c (MPa) | Mu (kN.m) | Reduction in f'c | Reduction in Mu | MACI | MEC4 | MANSI |
MBS/ factors |
MBS/no factors | MRPT | MCoPHK | MHan | MFE | |
|---|---|---|---|---|---|---|---|---|---|---|---|---|---|
| B2.4 – N100 | 37.62 | 17.10 | - | - | - | - | - | - | - | - | - | - | - |
| B2.4 – R20 – N80 | 32.36 | 16.22 | 14% | 5% | 1% | 0% | 0% | 0% | 0% | 1% | 0% | 2% | 2% |
| B2.4 – R40 – N60 | 29.04 | 16.08 | 23% | 6% | 2% | 1% | 0% | 0% | 0% | 1% | 0% | 3% | -1% |
| B2.4 – R60 – N40 | 30.09 | 15.05 | 20% | 12% | 2% | 0% | 0% | 0% | 0% | 1% | 0% | 3% | 5% |
| B2.4 – R80 – N20 | 27.95 | 14.60 | 26% | 15% | 3% | 1% | 0% | 0% | 0% | 2% | 0% | 3% | 3% |
| B2.4 – R100 | 20.83 | 14.66 | 45% | 14% | 5% | 1% | 0% | 0% | 0% | 2% | 0% | 5% | 2% |
| B2.4 – P20 – N80 | 27.96 | 15.21 | 26% | 11% | 3% | 1% | 0% | 0% | 0% | 2% | 0% | 3% | 14% |
| B2.4 – P40 – N60 | 26.94 | 14.76 | 28% | 14% | 3% | 1% | 0% | 0% | 0% | 2% | 0% | 4% | 7% |
| B2.4 – P60 – N40 | 26.96 | 14.68 | 28% | 14% | 3% | 1% | 0% | 0% | 0% | 2% | 0% | 4% | 9% |
| B2.4 – P80 – N20 | 25.14 | 14.05 | 33% | 18% | 4% | 1% | 0% | 0% | 0% | 2% | 0% | 4% | 9% |
| B2.4 – P100 | 23.02 | 13.60 | 39% | 20% | 4% | 1% | 0% | 0% | 0% | 2% | 0% | 5% | 16% |
| B2.4 – R20 – P80 | 23.24 | 14.16 | 38% | 17% | 4% | 1% | 0% | 0% | 0% | 2% | 0% | 5% | 9% |
| B2.4 – R40 – P60 | 21.81 | 14.46 | 42% | 15% | 5% | 1% | 0% | 0% | 0% | 2% | 0% | 5% | 12% |
| B2.4 – R60 – P40 | 21.89 | 14.26 | 42% | 17% | 5% | 1% | 0% | 0% | 0% | 2% | 0% | 5% | 6% |
| B2.4 – R80 – P20 | 27.74 | 14.58 | 26% | 15% | 3% | -1% | 0% | 0% | 0% | 2% | 0% | 3% | 9% |
According to the literature review mentioned in this current research, Han et al. [5] concluded that the EC4 gave the best conservative estimation among all considered codes with the highest accuracy. It gave an average of 14% lower than the experimental results, while the LRFD (1999) and AIJ (1997) provided a section capacity of about 25% lower than the tested values, and this order is consistent with the results of this study except for the BS5400. According to Han et al. [5], the BS5400 [29] provided results higher than the AISC-LRFD [27] and AIJ [28], which is not the case of this study unless all factors were taken as unity.
Furthermore, it was highlighted that several codes could be extended to get a conservative estimation for different conditions such as new slenderness range [9], elliptical shape [17], and high tensile steel with ultra-high concrete strength [20].
For the cases where steel corrosion is a key factor [4], it is safe to use different codes such as DB36/J001-2007 (2007), AIJ (1997), and EN 1994-1-1:2004 (2004) to estimate the moment capacity of beams, taking into consideration the reduction in yield strength of the outer steel tube, while for the GB 50936-2014 (2014), the loss in wall thickness should also be considered to provide a conservative estimation.
Other code provisions such as CIDECT were also considered in the literature. Soundararajan and Shanmugasundaram [3], Elchalakani et al. [9], and Wheeler and Bridge [13] used the CIDECT standard to calculate the flexural capacity of CFTs and found that CIDECT generally provided conservative results.
In recent research, computer technologies have been playing an important role in capacity calculation and behavior simulation. The finite element analysis was used to predict the performance of CFT, and a very good agreement was found between the models and the experimental results, according to the literature using Abaqus [23, 6, 7] and ANSYS [22]. In this study, the flexural capacity of CFT was calculated according to El-Nimri et al’ s [23] model and the results were found to record the lowest reduction percent among all codes. For 2 mm and 2.4 mm steel, the capacities were about 2% and 4% lower than the experimental results, respectively.
CONCLUSION
From the results of this study, as well as the past research, the following conclusions can be reached:
(1) There is a lack of information and tests on the flexural behavior of concrete-filled tubes.
(2) All available codes can be used to predict the moment capacity of CFT regardless of the steel type and concrete infill used, as they gave conservative results if used according to the limitations mentioned in each code, except for the ACI 318-19, where it provided results higher than the experimental ones by (3%-10%)
(3) The ANSI/AISC 360-16 and CoPHK have proven that they are the most accurate methods to calculate the flexural capacity of CFTs.
(4) The RPT, EC4, the proposed method by Han [5], AISC-LRFD, AIJ, and BS5400-5 can be used to conservatively predict the flexural capacity of CFTs, with the RPT providing the highest accuracy and BS5400-5 providing the lowest one.
(5) The flexural capacity of composite beams decreased with the decrease of the concrete compressive strength because of the use of recycled aggregates; however, the reduction in capacity recorded according to the equations in the literature was negligible.
(6)All code provisions can be extended to cover further cases such as different steel tube shapes, steel corrosion, new slenderness ranges, and high tensile steel with ultra-high concrete strength by considering specific factors.
(7) The finite element analysis results were found to compare favorably with the experimental ones, where they recorded the lowest reduction in capacity for both steel thicknesses.
CONSENT FOR PUBLICATION
Not applicable.
AVAILABILITY OF DATA AND MATERIALS
The data associated with this paper are available upon request.
FUNDING
None.
CONFLICT OF INTEREST
The authors declare no conflict of interest, financial or otherwise.
ACKNOWLEDGEMENTS
Declared none.

