All published articles of this journal are available on ScienceDirect.

Correlation of Performance of Reinforced Concrete Buildings with Energy-Based Parameters
Abstract
Background:
The intensity of ground shaking and the demand on structures during earthquakes have been generally characterized using parameters such as peak ground acceleration as well as strength-based parameters such as response spectrum ordinates (e.g., spectral acceleration), which represent the maximum amplitude of shaking for structures with specified natural period and damping values.
Methods:
It has long been recognized that to assess the demands on structures during earthquakes, one might employ an energy-based approach (as an alternative to the more common strength-based one), especially when there is an interest in assessing the damage potential of ground motions. The study focuses on the correlation between Ground Motion Parameters (GMPs) and structural damage indicators for reinforced concrete frames. The relationship between ground motion intensity and structural damage is of primary concern in seismic regions. Here, we consider GMPs that are strength-based (such as spectral acceleration, Sa) and energy-based (such as input energy-equivalent acceleration, Ai, and absorbed energy-equivalent acceleration, Aa), as defined in the study. In order to evaluate Ground Motion Parameters (GMPs) for efficiency, power-law format regression studies of damage measures (DM) on each GMP are utilized.
Results:
The general objective of this paper is to investigate if energy-based parameters can correlate well with structural damage. Thus, power-law formats in regression of damage on GMP are considered. In regression studies of this type, a lower standard deviation of the damage measure given the value of the ground motion parameter (GMP) is considered an indication of a stronger correlation between that damage measure and the corresponding ground motion parameter.
Conclusion:
These extensive regression studies are carried out for both low-rise and high-rise reinforced concrete buildings. Conclusions are discussed following these analyses.
1. INTRODUCTION
Various researchers have studied the correlation of energy- and strength-based parameters with structural damage measures. Rahnama and Manuel (1996) [1] studied seismic demands focusing on energy demands for bilinear systems. They investigated the effect of strong-motion duration with the help of simulations of strong ground motion. Since it was assumed that the duration of strong shaking has a direct effect on the number of inelastic excursions experienced by the structure, their study involved the dynamic analyses of bilinear SDOF systems with periods ranging from 0.1 to 4.0 seconds. They considered 19 Western U.S. recorded motions at rock sites as well as simulated motions with four controlled durations. They concluded that while strength demands and strength reduction factors are not very sensitive to strong motion duration, input energy demands are significantly dependent on this duration. The input energy and hysteretic energy demands were seen to increase with an increase in duration, while the ratio of hysteretic energy to input energy was seen to be relatively less sensitive to strong-motion duration. They suggested that the relative proportion of input energy dissipated in hysteresis is not dependent on duration, although the absolute hysteretic energy alone (an indicator of cumulative damage) is dependent on duration.
Linde and Manuel (1998) [2] studied the sensitivity of several response variables for structural wall models to strength- and energy-based parameters of the recorded ground motions. A nonlinear macro model was employed to describe the behavior of reinforced concrete structural walls. It was found that the structural wall’s nonlinear response character was strongly correlated to the input energy and moderately correlated to parameters such as peak ground acceleration or spectral acceleration of the ground motion.
Elenas (1997, 1998, and 2000) [3-5] and Elenas and Meskouris (2001) [6] studied the dependence of several parameters such as peak ground acceleration, peak ground velocity, peak ground displacement, spectral acceleration, input energy, Arias intensity, etc., on diverse structural damage indices. Twenty ground motion records were considered, and the response of a reinforced concrete frame structure with a first natural period of 1.18 seconds was analyzed using IDARC 2D Version 4.0 (Reinhorn et al., 1996) [7]. These studies concluded that spectral acceleration and input energy are both good indicators of the damage potential for the R/C structure analyzed. These studies only considered one structure and twenty ground motion records. They also only included global damage measures such as maximum inter-story drift and the Park and Ang overall damage index (Park and Ang, 1985) [8].
Giovenale et al. (2003) [9] compared intensity measures that characterize the seismic action at a site and their influence on damage by means of incremental dynamic analysis (Vamvatsikos and Cornell, 2002) [10]. These intensity measures were distinguished as either ground motion-dependent measures (such as peak ground acceleration and peak ground velocity) or structure-specific measures (such as spectral acceleration). Energy-based intensity measures were, however, not studied. A total of 30 ground motion records from 25 different earthquakes were used, and the intensity measures from these motions were related to response characteristics of two reinforced concrete frame structures (a four-story structure and an eight-story structure). While this study did not include an energy-based parameter, it brought out some useful insights that need to be considered when studying the correlation of damage in nonlinear MDOF structures with any intensity measure.
Choi and Kim (2009) [11] carried out a seismic analysis to examine the effect of ground motion characteristics and structural properties on energy demands using 100 earthquake ground motions recorded in different soil conditions. Analysis results showed that ductility ratios and the site conditions have a significant influence on input energy, and the ratio of hysteretic to input energy is considerably influenced by the ductility ratio and the strong-motion duration. It was also observed that as the predominant periods of the input energy spectra are significantly larger than those of acceleration response spectra used in the strength design, the strength demand on a structure designed based on energy should be checked, especially in short period structures. For that reason, framed structures with buckling-restrained-braces (BRBs) were designed in such a way that all the input energy was dissipated by the hysteretic energy of the BRBs, and the results were compared with those designed by conventional strength-based design procedure.
Paolacci (2013) [12] aimed to study the seismic response of structures equipped with viscoelastic dampers (VED). The performance of such a passive control system was analyzed using the energy balance concept, which led to an optimal design process. The methodology was based on an energy index (EDI) whose maximization permits the determination of the optimal mechanical characteristics of VED. On the basis of a single degree of freedom model, it was shown that the maximum value of EDI corresponds to simultaneous optimization of the significant kinematic and static response quantities, independently of the input. By using the proposed procedure, the optimal design of new and existing structures equipped with VED, inserted in traditional bracing systems, were analyzed and discussed.
Cao and Ronagh (2014) [13] selected 204 near-fault pulse-type records and determined their seismic parameters. Time history and damage analyses of a tested 3-story reinforced concrete frame representing low-rise reinforced concrete buildings subjected to those earthquake motions were performed after calibration and comparison with the available experimental results. The aim of their paper was to determine, amongst several available seismic parameters, the ones that have strong correlations with the structural damage measured by a damage index and the maximum inter-story drift. The results showed that Velocity Spectrum Intensity is the leading parameter demonstrating the best correlation, followed by Housner Intensity, Spectral Acceleration, and Spectral Displacement. These seismic parameters were recommended as reliable parameters of near-fault pulse-type motions related to the damage potential of low-rise reinforced concrete structures. The results also reaffirm that the conventional and widely used parameter of Peak Ground Acceleration did not exhibit a good correlation with the structural damage. While this study did not include an energy-based parameter, it brought out some useful insights that need to be considered when studying the correlation of damage in low-rise structures with any intensity measure.
Ozakgul (2015) [14] investigated the seismic energy response of inelastic steel structures under earthquake excitations. For this purpose, a numerical procedure based on nonlinear dynamic analysis was developed by considering the material, geometric, and connection nonlinearities. The cyclic behaviour of steel connections was taken into account by employing an independent hardening model. Energy response analysis of space frames was performed by using a numerical method. The distribution of the different energy types versus time at the duration of the earthquake ground motion was obtained. In addition, error analysis for the numerical solutions was carried out.
Ozmen and Inel (2016) [15] investigated ground motion parameters and their damage potential for building-type structures. They focused on low and mid-rise reinforced concrete buildings. Correlations of 19 parameters of 466 earthquake records with nonlinear displacement demands of 1056 Single Degree of Freedom (SDOF) systems were investigated. The correlation of damage and ground motion characteristics was examined with respect to the number of story and site classes. Velocity-related parameters were generally found to have better results than the acceleration, displacement, and frequency-related ones. Velocity Spectrum Intensity and Peak Ground Velocity were found to have the highest correlation values for almost all site classes and the number of story groups.
A nonlinear static procedure considering the work-energy principle and global failure mechanism to estimate base shears of reinforced concrete (RC) frame-type structures was presented by Merter and Ucar (2017) [16]. The relative energy equation comprising of elastic vibrational energy, plastic strain energy, and seismic input energy was obtained. The input energy was modified with a factor depending on damping ratio and ductility, and the energy that contributes to damage was obtained. Relative input energy of multi-degree of freedom (MDOF) system was approximated by using the modal-energy-decomposition approach. Energy-based design base shears were compared with those obtained from nonlinear time history (NLTH) analysis using recorded accelerograms. It was found that some of the energy-based base shears are in reasonable agreement with the mean base shear obtained from NLTH analysis.
Tyrtaiou and Elenas (2020) [17] aimed to present new frequency-related seismic intensity parameters (SIPs) based on the Hilbert-Huang Transform (HHT) analysis. The proposed procedure was utilized for the processing of several seismic accelerograms. Thus, the entire evaluated Hilbert Spectrum (HS) of each considered seismic velocity time-history was investigated first, and then, a delimited area of the same HS around a specific frequency was explored for the proposition of new SIPs. The first application of the suggested new parameters revealed the interrelation between them and the structural damage of a reinforced concrete frame structure. The index of Park and Ang describes the structural damage. The fundamental frequency of the structure was considered as the mentioned specific frequency. Two statistical methods, namely correlation analysis and multiple linear regression analysis, were used to identify the relationship between the considered SIPs and the corresponding structural damage. The results confirmed that the new proposed HHT-based parameters are effective descriptors of the seismic damage potential and helpful tools for forecasting the seismic damages on buildings.
Several researchers studied damage indices. Yan et al. (2020) [18] coupled the effect of time-varying durability damage of materials and the time-varying attenuation effect of damage index to analyze the seismic performance of offshore bridges. They found out that the time-varying attenuation effect of the damage index has a great impact on the seismic performance of bridges in the service period. Yazdani and Jahangiri (2020) [19] evaluated the seismic behavior of aging arch bridges by using the Intensity Measure-based demand. Their results revealed that decreasing the span length of the unreinforced arch bridges leads to the increase in the return period of exceeding various limit states and factored capacity and decrease in the displacement demand, the probability of failure, the factored demand, as well as the factored demand to factored capacity ratios, loss ratio, and seismic vulnerability.
In our numerical studies, we investigate the correlation of damage measures with first-mode strength- and energy-based parameters. We also study the change in correlation that results when these parameters are evaluated at different periods that might be more appropriate when the response is inelastic (and thus accompanied by period lengthening) and/or the higher modes contribute significantly. In the following sections, we describe the numerical studies carried out to estimate the correlation of the different structures with the alternative strength- and energy-based ground motion parameters.
2. MATERIALS AND METHODS
2.1. Ground Motion Data
A total of 60 ground motion records obtained during 20 events from all over the world, as presented in Table 1, are used in this study. The time histories used in this study may be obtained at the website of the Pacific Earthquake Engineering Research Center (http://peer.berkeley.edu). The peak ground acceleration (pga) values for these records varied between 0.1 and 0.7g, where g is the acceleration due to gravity. In the database of strong motion records, 16 of the ground motions were recorded at stations with site class A or B (referred to as “A&B” in the following), 25 of them at site class C, and the remaining 19 at site class D. The closest distance from the epicenter to the recording stations varied between 2.5 and 87 km. The moment magnitudes of the earthquakes are also presented in Table 1. A definition of the site classes in terms of shear wave velocities over the top 30 m of the soil layer is presented in Table 2.
| No | Earthquake Name |
Date | Moment Magnitude | Fault Type | No. of Recordings | ||||
|---|---|---|---|---|---|---|---|---|---|
| A | B | C | D | ||||||
| 1 | Anza (Horse Cany.) | 02/25/80 | 4.9 | Strike-Slip | - | 1 | - | - | |
| 2 | Borrego Mtn | 04/09/68 | 6.8 | Strike-Slip | - | - | 1 | - | |
| 3 | Cape Mendocino | 04/25/92 | 7.1 | Reverse Normal | - | 2 | 1 | - | |
| 4 | Chi-Chi, Taiwan | 09/20/99 | 7.6 | Reverse Normal | - | - | - | 8 | |
| 5 | Coalinga | 05/02/83 | 6.4 | Reverse Oblique | - | - | 2 | - | |
| 6 | Coyote Lake | 08/06/79 | 5.7 | Strike-Slip | 1 | 2 | 3 | - | |
| 7 | Hollister | 11/28/74 | 5.2 | Strike-Slip | - | - | 1 | - | |
| 8 | Imperial Valley | 5/19/40 | 7.0 | Strike-Slip | - | - | 1 | - | |
| 9 | Imperial Valley | 10/15/79 | 6.5 | Strike-Slip | - | 2 | 4 | 1 | |
| 10 | Imperial Valley | 10/15/79 | 5.2 | Strike-Slip | - | - | - | 1 | |
| 11 | Kern County | 07/21/52 | 7.4 | Reverse Oblique | - | 1 | - | - | |
| 12 | Kobe | 01/16/95 | 6.9 | Strike-Slip | - | - | - | 4 | |
| 13 | Kocaeli, Turkey | 08/17/99 | 7.4 | Strike-Slip | - | - | - | 1 | |
| 14 | Landers | 06/28/92 | 7.3 | Strike-Slip | 1 | - | - | - | |
| 15 | Loma Prieta | 10/18/89 | 6.9 | Reverse Oblique | 1 | 1 | 12 | 2 | |
| 16 | Morgan Hill | 04/24/84 | 6.2 | Strike-Slip | 1 | - | - | - | |
| 17 | N. Palm Springs | 07/08/86 | 6.0 | Reverse Oblique | 2 | - | - | - | |
| 18 | Superstitn Hills(B) | 11/24/87 | 6.7 | Strike-Slip | - | - | - | 1 | |
| 19 | West Morland | 04/26/81 | 5.8 | Strike-Slip | - | - | - | 1 | |
| 20 | Whittier Narrow | 10/04/87 | 5.3 | Reverse Oblique | 1 | - | - | - | |
| Total No. of Recordings | 16 | 25 | 19 | ||||||
| Site Class | Shear Wave Velocity |
|---|---|
| A | > 750 m/s |
| B | 360 m/s to 750 m/s |
| C | 180 m/s to 360 m/s |
| D | < 180 m/s |
2.2. Energy-Based Ground Motion Parameters
The focus of this study is on comparing the correlation of strength- and energy-based parameters to damage, as well as to each other.
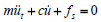
Since there are several different energy descriptors that have been used, it is important to define the energy-based parameters that are employed here. In order to do so, it is useful to start with the equation of motion of a single-degree-of-freedom structural (SDOF) system. This may be written as:
 |
(1) |
where m, c, and fs are the mass, viscous damping coefficient, and restoring force, respectively, of the SDOF system. Also, ut is the absolute (total) displacement of the mass, while u is the relative displacement of the mass with respect to ground, and ug is the ground displacement.
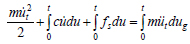
Transformation of the equation of motion into an energy balance equation can be easily accomplished by integrating Eq. (1) with respect to u from the beginning of the input ground motion (Uang and Bertero, 1988). This leads to:
 |
(2) |
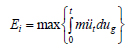
Since the inertia force, müt, equals the sum of the damping and restoring forces, it is also equal to the total force applied at the base of the structure. Therefore, the right-hand side of Eq. (2) is, by definition, the energy input to the system at any time, t. Hereinafter, we will define Input Energy, Ei, as the maximum value of the energy input into the system during ground shaking. It can also be thought of as the maximum value of the work done by the total base shear on foundation/ground displacement during the ground motion. Thus, we have:
 |
(3) |
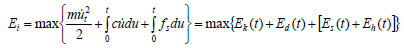
The first term on the left-hand side of Eq. (2) is the kinetic energy, Ek(t), while the second term is the damping energy, Ed(t), and the last term is made up of the sum of recoverable elastic strain energy, Es(t), and irrecoverable hysteretic energy, Eh(t). Thus, the input energy, Ei, can also be described as follows:
 |
(4) |
Similarly, to facilitate reporting of various results in this study and comparisons with other studies, it is useful to define Absorbed Energy, Ea, as the maximum value of the sum of the recoverable strain energy and the irrecoverable hysteretic energy as follows:
 |
(5) |
It is important to note that for linear elastic systems, the absorbed energy-equivalent velocity, Va, is the same as spectral velocity, Sv, and the absorbed energy-equivalent acceleration, Aa, is the same as spectral acceleration, Sa. Thus, in a sense, elastic absorbed energy-equivalent velocity and acceleration represent parameters that may be defined either from strength or energy considerations. It is convenient to define a velocity parameter (Vi) based on input energy, Ei, termed as “input energy-equivalent velocity”:
 |
(6) |
Similarly, we define another velocity parameter (Va) based on absorbed energy, Ea, termed as “absorbed energy-equivalent velocity”:
 |
(7) |
Chou and Uang (2000) [20] and Sari (2003) [21] defined strain energy, Es, hysteresis energy, Eh, input energy, Ei, and absorbed energy, Ea. Also, to facilitate comparison with studies that involve the more conventional design parameter, spectral acceleration, Sa, we define an “input energy-equivalent acceleration,” Ai, in terms of Vi and an “absorbed energy-equivalent acceleration,” Aa, in terms of Va, as follows:
 |
(8) |
The ground motion parameters are all computed for elastic 5%-damped SDOF systems with various natural periods ranging between approximately 0.5 and 4.0 seconds. The actual periods used in subsequent discussion are generally chosen for each structure studied so as to match the fundamental period of vibration of that structure. This will be discussed when details regarding the structures are presented.
2.3. Measures of Structural Damage
The damage in reinforced concrete structures depends on both the maximum inelastic deformation and the cumulative deformation under repeated stress reversals (Singhal, 1996) [22]. Several damage models exist that can help characterize structural damage in terms of a damage index. Structural damage may be generally represented by global and local damage indices. It is believed that a damage model for reinforced concrete (R/C) structures should include not only the peak inelastic response but also the effect of reversals of inelastic deformations.
Global structural damage indices include Park and Ang overall damage index values, OSDI (Park and Ang, 1985) [8], and local damage indices include average Park and Ang story damage index values, AVSDI. These indices may be treated as measures of structural performance.
Base shear, Vb, is also treated as a performance measure in this study. Local structural damage indices quantify the damage in individual members or elements of the structure (e.g., at the story level). On the other hand, global damage indices reflect combined effects of the structural damage to individual members at the overall system level. The Park and Ang damage index is a superposition of the structural damage caused by large deformations and repeated cyclic loading effects. The Park and Ang story damage index (AVSDI) for any story in a building is defined in terms of the damage indices of all of the elements in that story. The overall Park and Ang damage index (OSDI) is a weighted average of the various Park and Ang story damage indices. In this study, we use a global damage index, overall Park and Ang structural damage index (OSDI) for R/C frame structures because it summarizes all existing damage in the structural components by a single numerical value. Park et al. (1986) [23] defined five different damage stages for R/C structures in terms of the overall structural damage index (OSDI). These are expressed qualitatively as “slight,” “minor,” “moderate,” “severe,” and “collapse” damage states. Table 3 presents a list of these damage states together with physical descriptions associated with each, as defined by Park et al. (1986) [23]. Gunturi et al. (1992) [24] simplified the damage stages defined above. They classified the degree of damage according to the following criteria: OSDI values greater than 0.8 were defined as total damage; OSDIs value between 0.6 and 0.8 were defined as great damage; OSDI values between 0.3 and 0.6 were defined as medium damage, and OSDI values smaller than 0.3 were assumed to be associated with low damage that is repairable.
3. RESULTS AND DISCUSSION
3.1. Description of Structures used in the Numerical Analyses
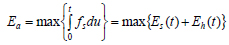
The study consists of four reinforced concrete (R/C) moment-resisting frame structures. These are 3-, 5-, 8-, and 15-story structures. The reinforced concrete frame structures were designed according to the 2000 International Building Code (ICBO 2000) [25]. Dead, live, and seismic loads were taken into account in the design. All the structures consist of three-bay frames, with 8-meter spacing between column center lines. Schematic elevation views of the 2-D frame models for the four R/C structures, along with member sizes, are presented in Fig. (1), where cross-sectional dimensions are expressed in centimeters. The typical reinforcement ratios for the columns and beams are around 0.015 and 0.004, respectively. The typical spacing of the ties and stirrups in the confinement zones is 10 cm.
| Damage Stages | Damage Index Ranges | Physical Description | State of Structure |
|---|---|---|---|
| Collapse | >1.0 | Partial or total collapse | Loss of Building |
| Severe | 0.4 – 1.0 | Extensive crashing of concrete; disclosure of buckled reinforcement | Beyond repair |
| Moderate | < 0.4 | Extensive large cracks; spalling of concrete in weaker elements | Repairable |
| Minor | - | Minor cracks; partial crushing of concrete in columns | - |
| Slight | - | Sporadic occurrence of cracking | - |
3.2. Nonlinear Time History Analyses
The 3-, 5-, 8-, and 15-story reinforced concrete (R/C) frame structures are analyzed using IDARC 2D, Version 4.0 (Reinhorn et al., 1996) [7]. The intent here is to describe only those characteristics of the numerical models that are noteworthy when we discuss results of the correlation studies of structural performance with the energy- and strength-based ground motion parameters.
The hysteretic behavior of the reinforced concrete beams and columns is described at the member ends using the “Park Hysteretic Model.” This model incorporates stiffness degradation, strength deterioration, non-symmetric response, slip lock, and a tri-linear monotonic envelope. The load-deformation characteristics for the beam-column elements available in IDARC 2D were calibrated to match the behavior of a typical test assemblage of a reinforced concrete element. IDARC 2D takes into consideration stiffness changes in a member that take place during an earthquake. The program starts by assuming a gross sectional stiffness and changes this to an effective stiffness according to the magnitude of the moment induced in the member. It also includes a spread plasticity formulation to capture the variation of section flexibility that might result when a member experiences inelastic deformation causing cracks to spread from the joint interface.
Two-dimensional frame models of the R/C structures are developed for the inelastic dynamic time-history analyses using IDARC 2D Version 4.0. The fundamental periods of the 3-, 5-, 8-, and 15-story frames are computed to be 0.49, 0.65, 0.84, and 1.53 seconds, respectively (Table 4). Masses are assumed to be lumped at the joints. Beams and columns are assumed to follow a three-parameter load-deformation relationship needed in order to simulate stiffness degradation, strength deterioration, and pinching behavior of these R/C elements. Rayleigh damping with a damping ratio of 5% is considered in the models.
3.3. Correlation Studies
In order to evaluate alternative GMPs for efficiency, it is common to carry out regression studies of damage measures (DM) on each GMP. A power-law format is commonly used (Cornell et al., 2000, 2002) [26, 27]:
 |
(9) |
where DM is the structural response or damage measure, a and b are coefficients estimated in the regression, and ε is a term describing the dispersion in the power-law relationship and has, by definition, a median value of unity and a logarithmic standard deviation, σ. The random variable, ε, is assumed to be lognormally distributed.
The power-law model in Equation 4 is employed together with damage measure, OSDI, for the R/C structures and with the three GMP alternatives. In regression studies of this type, a lower standard deviation (dispersion) of the damage measure given the value of the GMP will be considered a better indication of correlation between that damage measure and the corresponding GMP.
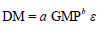
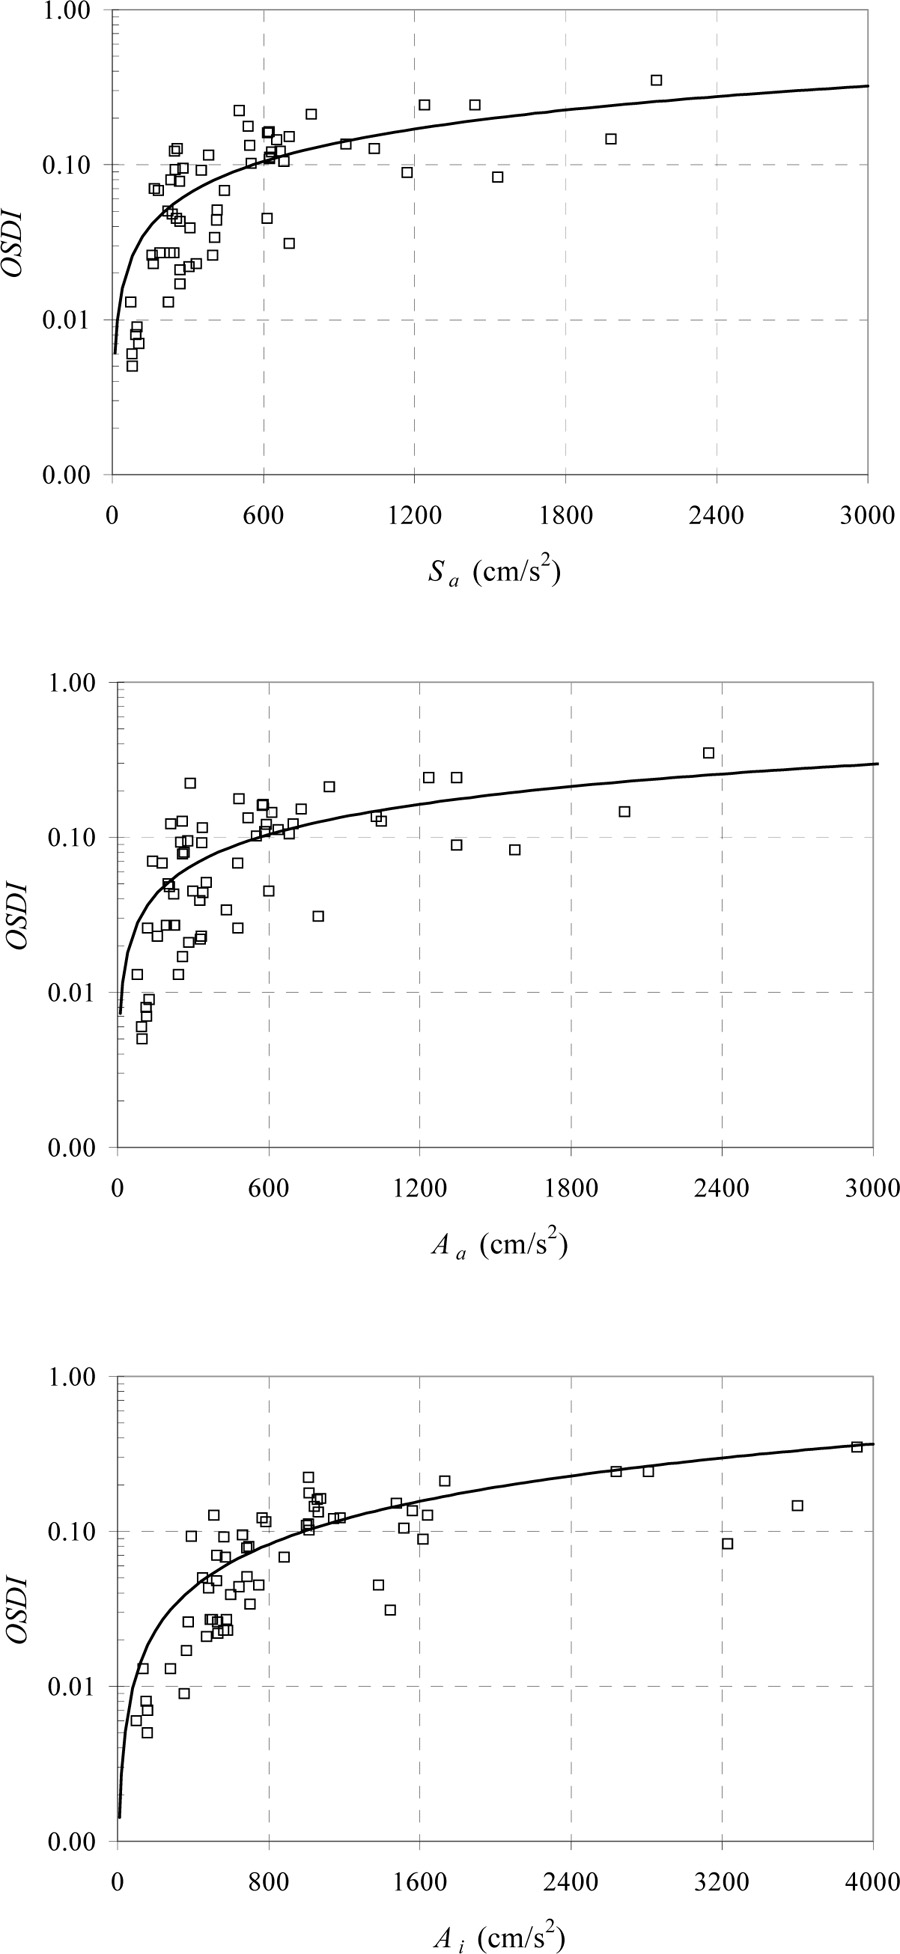
In Table 5, results of the power-law format regression analyses are summarized for the three R/C frame structures. The table includes regression coefficients, a and b, as well as dispersions (logarithmic standard deviations of the damage measure, OSDI, given the GMP). From this table, it may be concluded that Ai is somewhat more efficient than Sa and Aa because the dispersion of the estimated DM given Ai is lower than that given Sa or Aa, especially for the 3- and 15-story R/C structures.
Figs. (2-5) show plots of the global damage measure, OSDI, versus the three fundamental-mode GMPs (Sa, Aa, and Ai) for the four R/C structures. The power-law fits to the data are also shown for each structure and GMP. In summary, if a power-law format is employed in the regression, the GMP, Ai, is seen to be the best predictor of damage.
| - | Modes | 1 | 2 | 3 |
|---|---|---|---|---|
| 3-STORY | T (s) | 0.49 | 0.14 | 0.07 |
| Г (%) | 94 | 5 | 1 | |
| 5-STORY | T (s) | 0.65 | 0.21 | 0.11 |
| Г (%) | 87 | 9 | 3 | |
| 8-STORY | T (s) | 0.84 | 0.27 | 0.14 |
| Г (%) | 80 | 11 | 4 | |
| 15-STORY | T (s) | 1.53 | 0.48 | 0.26 |
| Г (%) | 78 | 10 | 5 |
| - | Sa (cm/s2) | Aa (cm/s2) | Ai (cm/s2) | |
|---|---|---|---|---|
| 3-STORY (T=0.49 s) |
a×10000 | 12.25 | 16.48 | 1.69 |
| b | 0.70 | 0.65 | 0.93 | |
| σlnDM/GMP | 0.72 | 0.78 | 0.64 | |
| 5-STORY (T=0.65 s) |
a×10000 | 5.17 | 5.62 | 2.30 |
| b | 0.80 | 0.77 | 0.83 | |
| σlnDM/GMP | 0.60 | 0.67 | 0.59 | |
| 8-STORY (T=0.84 s) |
a×10000 | 2.34 | 2.24 | 1.25 |
| b | 0.97 | 0.97 | 0.98 | |
| σlnDM/GMP | 0.56 | 0.62 | 0.55 | |
| 15-STORY (T=1.53 s) |
a×10000 | 19.07 | 16.66 | 6.93 |
| b | 0.68 | 0.69 | 0.79 | |
| σlnDM/GMP | 0.88 | 0.94 | 0.81 | |
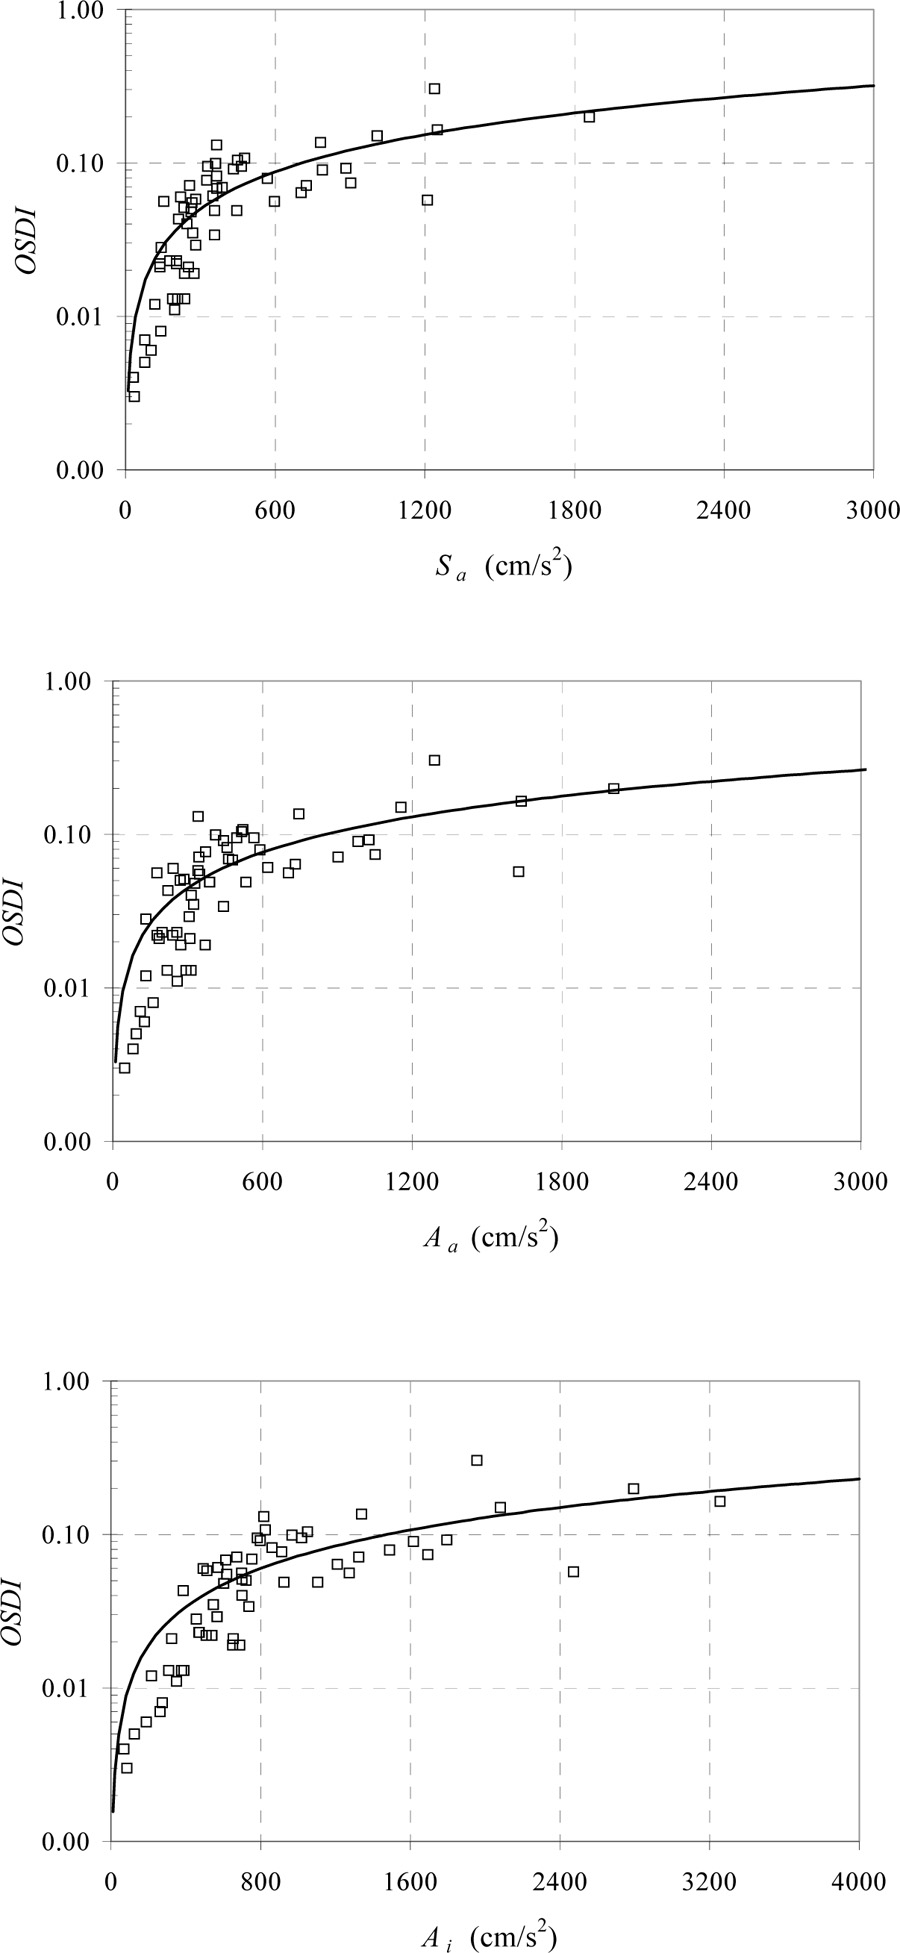
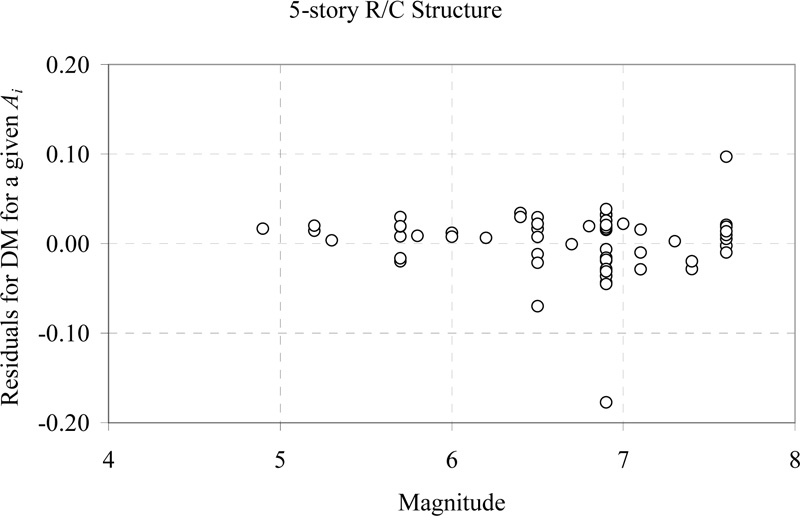
Since Ai was the most efficient GMPs for the R/C structures, we investigated the sufficiency of this GMP next. The variation of the residuals from the regression with various source and site characteristics for the steel structures is studied next. Results are presented only for the 5-story R/C structure in Figs. (4-6) because findings are similar for the other R/C structures. No significant trends are seen again; the mean of the residuals is very close to zero with variation in each source/site measure. Dispersion in the residuals is again seen to be slightly larger at large magnitudes and for softer soil sites, but this might be because of the non-uniform data with each source/site measure.

| Sa,1 Sa,2 | Ai,1 Ai,2 | ||
|---|---|---|---|
| 3-STORY (T=0.49 s) |
a×10000 | 8.37 | 0.24 |
| b | 0.57 | 0.26 | |
| c | 0.19 | 0.87 | |
| σlnDM/GMP | 0.71 | 0.62 | |
| 5-STORY (T=0.65 s) |
a×10000 | 3.38 | 0.59 |
| b | 0.71 | 0.46 | |
| c | 0.15 | 0.54 | |
| σlnDM/GMP | 0.59 | 0.56 | |
| 8-STORY (T=0.84 s) |
a×10000 | 0.55 | 0.17 |
| b | 0.73 | 0.54 | |
| c | 0.45 | 0.67 | |
| σlnDM/GMP | 0.54 | 0.48 | |
| 15-STORY (T=1.53 s) |
a×10000 | 12.70 | 2.78 |
| b | 0.59 | 0.60 | |
| c | 0.14 | 0.29 | |
| σlnDM/GMP | 0.87 | 0.79 | |
3.3.1. Ground Motion Parameters at Various Natural Periods
The ground motion parameters (GMPs), Sa, Aa, and Ai, used in the regression and correlation studied earlier are 5%-damped SDOF elastic response values evaluated at the fundamental (first mode) period of the structure of interest. This means that the correlation of damage measures with Sa, Aa, and Ai will, in general, not be strong because of possible higher mode effects that are reflected in the overall dynamic response as well as period lengthening that might accompany significant inelastic behavior and onset of damage.
An obvious approach to obtain an improved prediction of damage is to include contributions of the GMP evaluated at the second mode of vibration in regression studies. A power law format based on GMP1 and GMP2, first- and second-mode GMP values, may be expressed as follows:
 |
(10) |
where, a, b, and c are coefficients estimated in the regression and, as before, ε is a term describing the dispersion in the power-law relationship.
Results of the regression analyses that include GMPs at the first two natural periods for the steel structures are summarized in Table 6. These regression analyses are performed using first and second mode values of both Sa and Aa in units of cm/s2. When the second mode GMP value is added in the power-law regression, the dispersions decrease as expected (Tables 5 and 6). The greatest reduction in dispersion was observed for the 8-story structure when the second-mode period input energy-equivalent acceleration, Ai,2, is included.
In order to improve the efficiency of any single GMP, the whole range of natural periods should be investigated for each GMP, and the dispersion of the results from regression of the damage for each period, T, should be studied with respect to the GMP(T) at that period, T. In the case of the analyses carried out for the R/C and steel structures, one can then search for that period where the dispersion of a power-law format regression from the data is smallest. This optimal period for maximum efficiency of the GMP will, in general, be different from the fundamental period due to higher mode effects and/or period lengthening associated with damage that occurred.
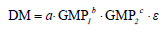
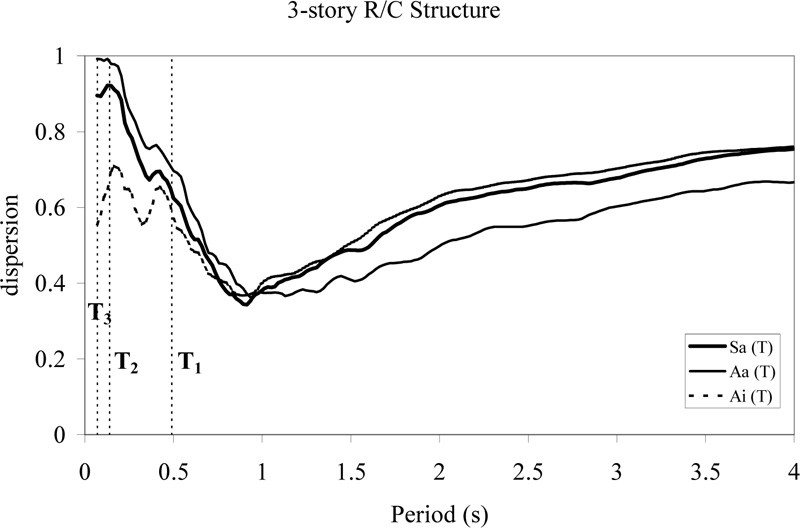
Dispersion values for the 3-, 5-, 8-, and 15-story R/C structures are plotted in Figs. (7-10), respectively. The optimal periods to be used with each GMP correspond to the periods where the dispersion is smallest. In order to make clear where these optimal periods lie relative to the natural periods of the structure in question, the first three modal periods are shown in Figs. (7-10).
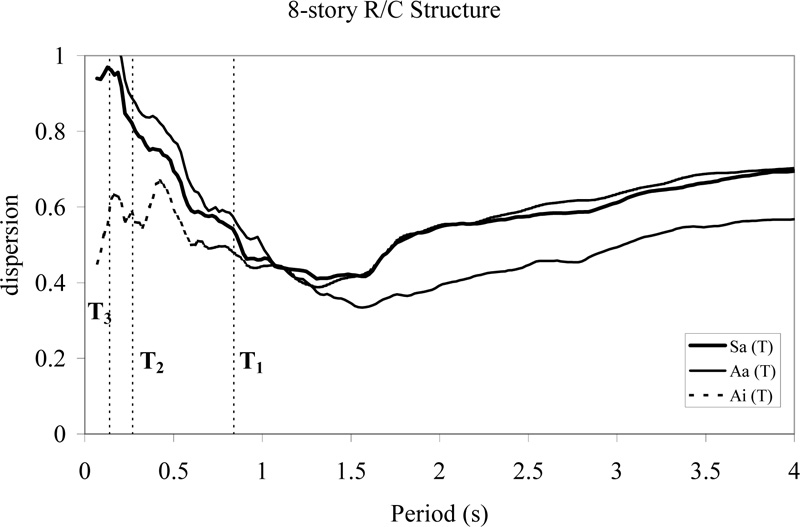
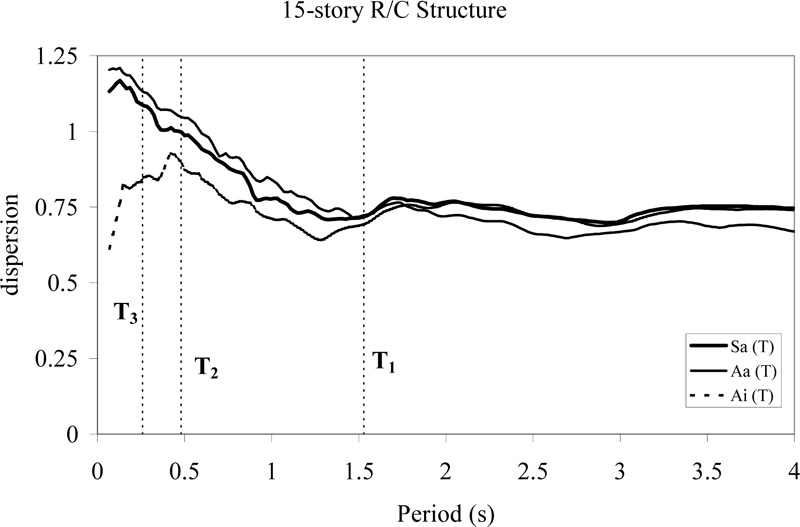
When all the Figs. (7-10) are studied, it is found that generally, Ai yields the smallest dispersion for short periods and Aa yields the smallest dispersion for long periods. The results suggest that the choice of the most efficient GMP and associated optimal period will depend on the type of structure, the participation of the various modes, and the degree of inelastic behavior that is expected.
Dispersions (i.e., logarithmic standard deviation values) of the damage measure conditional on each of the GMPs with its associated optimal period are presented in Table 7.
| Topt | σlnDM/GMP | ||
|---|---|---|---|
| 3-STORY (T=0.49 s) |
Sa | 0.91 | 0.34 |
| Aa | 0.93 | 0.36 | |
| Ai | 0.89 | 0.37 | |
| 5-STORY (T=0.65 s) |
Sa | 0.91 | 0.30 |
| Aa | 1.15 | 0.32 | |
| Ai | 0.93 | 0.32 | |
| 8-STORY (T=0.84 s) |
Sa | 1.31 | 0.41 |
| Aa | 1.56 | 0.33 | |
| Ai | 1.31 | 0.39 | |
| 15-STORY (T=1.53 s) |
Sa | 2.94 | 0.70 |
| Aa | 2.68 | 0.64 | |
| Ai | 1.29 | 0.34 | |
CONCLUSION
We first studied the linear correlation between various ground motion parameters and recognized that the strength- and energy-based parameters are strongly correlated with each other except at short periods (around 0.1 seconds).
In order to understand which ground motion parameter is a more efficient indicator of damage, the various ground motion parameters were compared and evaluated using extensive regression analyses in a power-law format. Results of these regression analyses showed that, in general, input energy-equivalent acceleration (Ai) was more efficient compared to spectral acceleration (Sa) and absorbed energy-equivalent acceleration (Aa) because the dispersion in the estimated damage measure given input energy-equivalent acceleration was smaller than it was given spectral acceleration or absorbed energy-equivalent acceleration levels. This was especially true for the 3- and 15-story R/C structures.
Regression analyses were performed using the fundamental mode and second mode period ground motion parameters (GMPs). When the second mode GMP was taken into consideration in the power-law format regressions, dispersions decreased slightly for the R/C structures.
In order to improve the efficiency of any single ground motion parameter, the whole range of natural periods was investigated for each ground motion parameter, and the dispersion of the results from regression of the damage for each period was studied. Period lengthening and higher mode effects were observed in plots of dispersion versus period for each ground motion parameter. It was found that generally, input energy-equivalent acceleration (Ai) yielded the smallest dispersion for short periods, and absorbed energy-equivalent acceleration (Aa) yielded the smallest dispersion for long periods. There were clear indications of period lengthening in the 3-, 5-, and 8-story R/C structures. In the case of the 15-story R/C structure, the optimal period was shorter than the fundamental period, suggesting the importance of one or more higher modes in the overall dynamic response.
From this, we may conclude that both energy-based parameters may be used in the prediction of damage and in seismic hazard studies.
CONSENT FOR PUBLICATION
Not applicable.
AVAILABILITY OF DATA AND MATERIALS
Not applicable.
FUNDING
None.
CONFLICT OF INTEREST
The authors declare no conflict of interest, financial or otherwise.
ACKNOWLEDGEMENTS
Declared none.

