All published articles of this journal are available on ScienceDirect.

Investigation of the Impact of Tropical Red Clay Soils' Mineralogical Composition on their Physical and Mechanical Properties– a Case Study Ruaka – Kenya
Abstract
Introduction:
Residual soils covering large areas of the earth have been chiefly discovered in the last 30 years in most volcanic tropical and subtropical countries. Understanding their behaviour is essential for various infrastructure developments.
Methods:
The physical and mechanical properties of the soils are affected by their mineralogical composition. There is a need to determine the mineralogical composition of the soils and investigate the impact on properties. This paper presents the results of a laboratory study conducted on red clay soil from Ruaka, a suburb in Kenya, to investigate the effect of mineral and chemical composition on the soil’s physical and mechanical properties. Disturbed and undisturbed samples were subjected to different tests such as Atterberg limits, soil classification, consolidation test, X-ray fluorescence, X-ray diffraction and petrology test based on the British Standard soil classification system (1377-1994). The soils were classified as clay with high plasticity, and high clay content varied between 59-79% resulting in mechanical instability of the soil in this site.
Results:
The mineral and chemical analysis indicated the formation of unique minerals like Halloysite, Quartz, Kaolinite, and Mica, which influenced the geotechnical properties of clay. The index properties of clay recorded high values; the moisture content and plastic limit varied between 37- 46% with a slight increase as depth increased; the liquid limit varied between 63-68% with increased depth.
Conclusion:
The average value of maximum dry density was reported as around 1247 kg/m3 with high optimum moisture content, reaching 35.5%. Besides that, the soil had a high void ratio of 1.145 to 1.63, which increased the permeability of the clay to 1.223E-5 cm/s. The properties of red clay soils in more than ten tropical regions in Kenya compared with the soil under study are also presented in this paper.
1. INTRODUCTION
Residual soils, covering large areas of the earth, have been discovered for the last 30 years in most volcanic tropical and subtropical countries. The soils are mainly formed from the physical and chemical weathering of the parent rocks and minerals. They are found in the following African countries: Cameroons, Ethiopia, Tanzania, Rwanda, Kenya, Spanish Guinea, and the Canary Islands. Countries in the East African region, such as Kenya, usually experience high rainfall during which red-brown nitosols soil is derived from volcanic rocks of steep slopes. The soils generally have an acidity of pH 4.0 to pH 6.0, particularly in the Murang'a, Nyeri and Nyandarua districts of central Kenya and several parts of the Eastern province of Kenya [1]. East Africa includes six distinct climate zones: the Lake equatorial climate, the modified equatorial climate, the Kenya highland sub-tropical climate, the tropical climate, the coastal tropical climate, and the desert and semi-desert climate. Kenya has a subtropical and a coastal tropical climate, which results in a diverse range of tropical red clay soils formed over various igneous (both volcanic and intrusive) rocks.
Geotechnical engineers usually assume that the residual soils conform to preconceived patterns of soil in terms of mechanical behaviour. However, applying concepts from other soil types, such as sedimentary soils, may or may not be relevant to these soils.
Red soil is a type of residual soil and one of the most problematic soils characterized by swelling due to wetting and shrinkage due to the high clay content inherent in its structure [2]. It is very hard when dry; however, it loses this strength when in a wet condition.
The relationship between residual soil structure and engineering qualities does not provide a qualitative explanation for the soil's unusual properties in practice. As a result, the mineralogical composition and structure are usually used to characterize the residual soil [3-6]. The unusual properties of some forms of residual soil are attributed to their specific clay minerals, which cause their mechanical and physical properties to be strongly linked to their mineralogy composition [7]. Residual soils' mineralogy composition influences their behaviour more than stress history [8, 9]. Physical and chemical weathering produces particular clay minerals that can control its behaviour. Residual soil, unlike sedimentary soil, does not consider stress history. Therefore, the terms' normally consolidated' and 'over consolidated' are irrelevant to residual soils.
According to Wesley [6, 8], the residual soils are divided into three main groups (A, B, and C) mentioned in detail by Wesley. (2009) [8]. The current study will focus on group (C) - tropical soil, specifically tropical red clays, categorized under three sub-groups that included the group of residuals characterized by unusual properties. In engineering literature, tropical soils are sometimes described as falling into two broad categories: tropical black and red.
The uniqueness of residual soils has been demonstrated in previous studies. Despite the availability and importance of residual soils, few dedicated efforts have been made to develop a comprehensive document that characterizes their behaviour. This would allow the decision-makers to think accordingly and in time to avoid unanticipated problems. Physical and chemical weathering produces particular clay minerals that can control its behaviour. This type of soil has recently received special attention from researchers due to its unusual behaviour attributed to its remarkable properties. The red soil in this paper was studied in Ruaka, a suburb of a large African city, Nairobi, where relevant data on physical and mechanical properties are lacking. Kenya is one of the developing countries under the pressure of economic development. The country is currently involved in massive infrastructure expansion projects including the construction of bridges, roads, water supply pipes, underground structures, and other infrastructure throughout the country especially in Nairobi. Therefore, more research on red soils is necessary to meet the requirements of the ever-increasing construction works. This study investigated the effect of the chemical and mineralogy composition of Ruaka soil on its engineering properties. The present study results will inform infrastructure development in the area and the general behaviour of tropical red soils.
2. REVIEW OF PREVIOUS WORKS
The first systematic study of this soil in Kenya was conducted between 1937 and 1945 for the Ruiru Dam site [10]. A large earth dam came to be built in the tropical areas of Kenya. It was observed for the first time that the properties of this residual soil were considerably different from those seen in temperate climate sedimentary clays. The optimum moisture content was around 50%, while the maximum dry density was approximately 72 lb/ft3 (11.53 kN/m3). Therefore, Karl [11] reassessed the integrity of this dam on this soil; the results showed that the abnormal properties were assets rather than liabilities, and the clay did not conform to conventional behaviour. Between 1947 and 1949, another site investigation for Sasumua Dam took place, Halloysite was a principal constituent, and the soil showed similar properties. Furthermore, the liquid limit was high, the natural moisture content was high, the maximum dry density varied from 65 to 75 Ib/ft (10.20 to 11.77kN/m3), and the optimal moisture level was between 55 and 45%. The soil cohesion (c') and the friction angle (ϕ') were generally between 26 and 30 kN/m2 and 34֯, respectively.
In yet another study, Newill [12]. investigated the properties of two samples of red clay soil, one from Nairobi's Kabete district and the other from a site near the Sasumua Dam, 40 miles northwest of Nairobi; his research highlighted the unusual properties of Kenya's red clay soils and the difficulties in interpreting laboratory tests such as the plasticity and compaction tests. The same conclusion was presented by B. Huat et al. [9], Dixon & Robertson [10], and Karl [11] when they studied the red clay soil from Nyeri and Ruiru Dam in Kenya. The soil possessed unusual properties, including excessively high moisture absorption, increased index values and abnormally low Maximum Dry Density (MDD); they attributed these properties to its mineralogy composition and structure.
Several other studies [5, 13-16] were carried out to investigate the impact of the mineralogy composition on the physical properties of tropical clay and to obtain further laboratory evidence of the abnormal behaviour of this soil. The comprehensive investigation was launched in 1993 by the Overseas Development Administration for some tropical regions in Kenya and Indonesia [17-19]. They observed that the increase in clay content is consistent with the variation in mineralogical composition, which makes tropical soils' mechanical and physical properties unstable. Additionally, these soils can exhibit swelling characteristics in an intermediate weathering stage.
Wesley [6, 8] emphasized that geotechnical engineers should have open minds about how residual soils may behave and not assume they will conform to preconceived patterns, especially when working with tropical soils. Based on this engineering background, more and more attention has been paid to understanding the behaviour of tropical soils. Further studies [17, 19-25] were carried out to determine the behaviour of red clay and to solve practical engineering problems such as the settlement deformation of buildings. More recently, a study by Xue et al. [26] in southern China investigated red clay's shear strength and crept behaviour to evaluate red clay's long-term shear strength and deformation when subjected to various structural loading. Their study provided promising results that can help solve the settlement problem in this type of soil.
Although there is a universal need to develop a method for indexing the abnormal properties of tropical soils, conventional index tests, particularly Atterberg limits, remain essential tools for the adequate characterization of these soils [6]. Furthermore, Wesley [6] criticized the argument that soil drying affects the results of Atterberg limits tests, stating that the influence of soil drying on the Atterberg limits is confined to shifting the point on the plasticity chart parallel to the A-line. So, this is insignificant because the only criterion for evaluating the soil is the distance above or below the A-line.
However, Gadzama et al. [20] investigated the effect of temperature variation ranging from 25 to 150◦C on the geotechnical properties of selected black cotton soils. Their results revealed decreased liquid and plastic limits and increased MDD. There was no increasing effect on Plasticity Index (PI) and Optimum Moisture Content (OMC).
According to Attah & Etim [2], the reaction of clay mineralogy to an elevated temperature significantly impacts its engineering properties in service. Even though their study was conducted on lateritic soils, their results showed a decrease in the Atterberg limit and an increase in MDD, which was consistent with Gadzama et al. [20].
In the tropics, soil formation is very varied and frequently complex. Because of its high clay content, it is an expansive soil that offers a considerable engineering problem, necessitating its stabilization before being employed for any engineering applications. As a result, the recent investigations by George et al. [21], Hanuma et al. [22], Sani et al. [23], Osinubi et al. [24], and Abner [25] on red clay have contributed to improving its properties. The studies [21-25] concluded that such soils, due to their unpredictable behaviour, are unsuitable for engineering construction, emphasizing the need for soil stabilization to enhance engineering properties.
The difficulty and abnormal behaviour would appear when applying 'conventional' soil mechanical concepts regarding sample drying and preparation. Particularly with tests that require remoulding the samples, such as the triaxial test, controlling the optimum moisture content with the MDD becomes challenging.
The relationship between the mineralogical composition of this soil and its engineering properties is complex and understudied in geotechnical engineering because the properties of this soil are strongly reliant on the weathering condition of the parent rocks, which varies by region. The behaviour of tropical red soil from Ruaka was defined and analyzed using standard testing to determine the usefulness of these tests in the engineering evaluation of tropical red clay soil properties. The results were compared to the chemical, mineralogical, index, and mechanical properties of typical tropical red soils from different tropical climatic regions in Kenya.
3. LOCATION AND GEOLOGY OF STUDY AREA
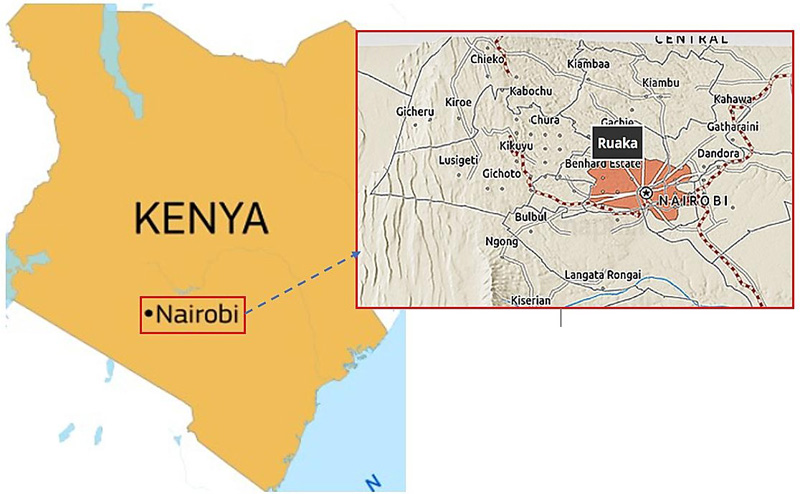
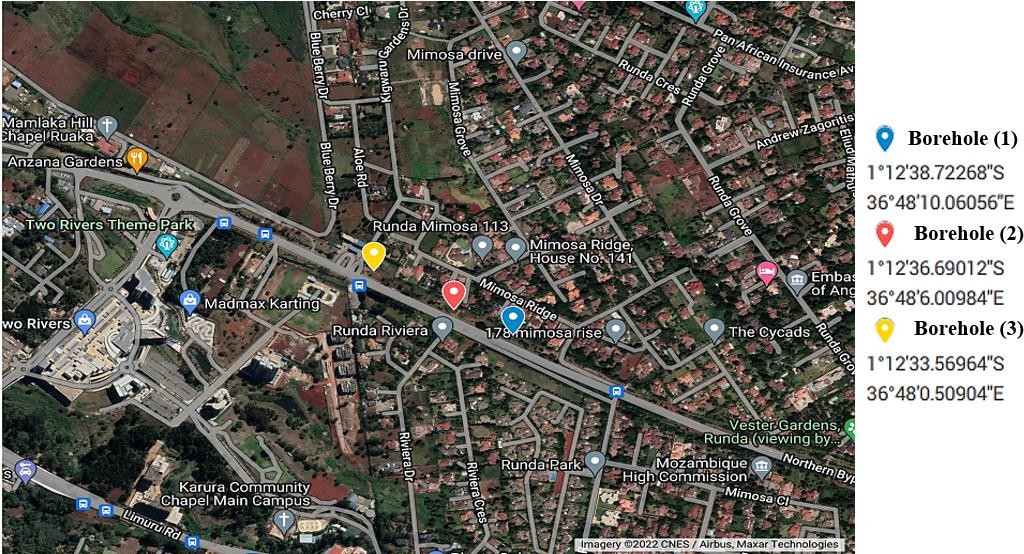
The soil investigated in this study is red clay soil collected from Ruaka. Ruaka town is located in Ndenderu Ward, Kiambaa Sub-County, Kiambu County. The suburb is located northwest of Nairobi and is easily accessible via the Northern Bypass and Limuru Road (Fig. 1). Ruaka is part of the larger Nairobi Metropolitan Area, with easy access to Kiambu, Limuru, Nairobi, Thika, Kajiado, Machakos, and Muranga Towns [26]. The study area is located between Longitude 36° 48' 0.51”, 36° 48' 6”, and 36° 48' 10.1”, East, and latitudes 1° 12' 33.6”, 1° 12' 36.7” and 1° 12' 38.7”, South of the Equator which is characterized as having tropical red soils as shown in Fig. (2).
Three boreholes were used for laboratory investigation to characterize the soil of Ruaka with depths of 10.5m, 8.95m, and 8.95m; the investigation could not go more profound due to the presence of rocks that are out of the scope of this study. The subsoil characteristics of each borehole are studied in detail.
The mineralogy and structure of the soil determine the engineering behaviour, which in turn, is dependent on the original rock type and climatic and drainage conditions both during and after weathering. Grain size, unit weight, strength, and compressibility vary significantly due to these parameters.
4. MATERIALS AND METHODS
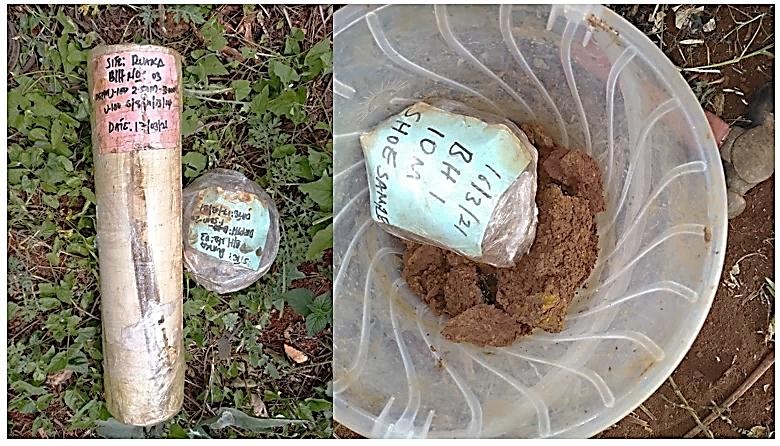
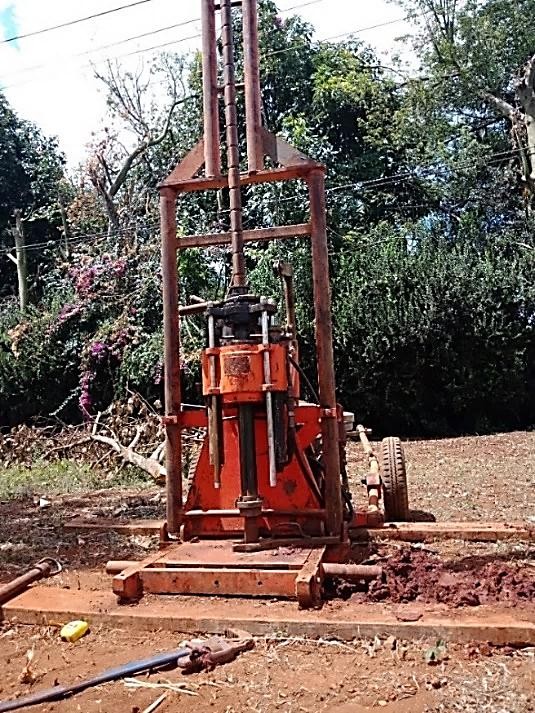
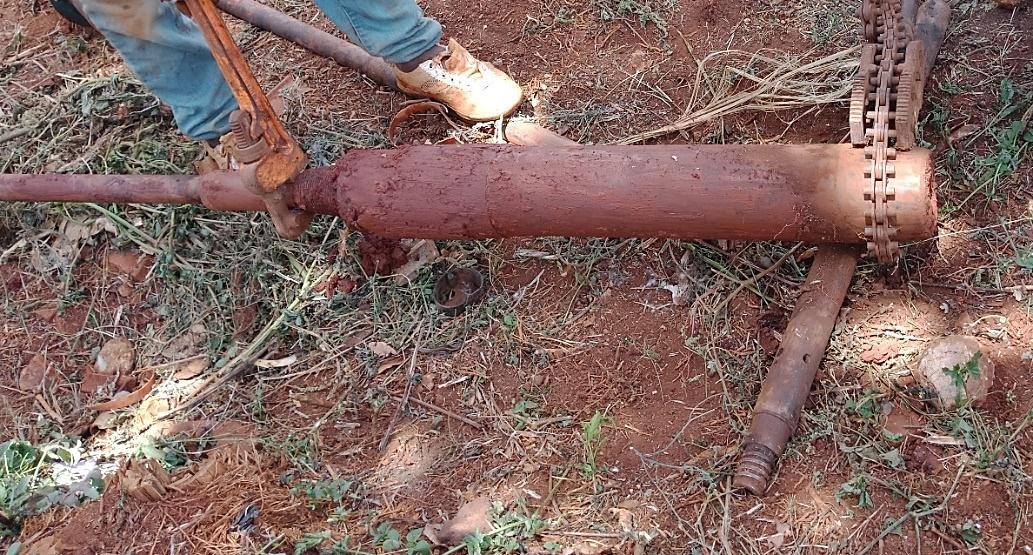
Undisturbed and Disturbed soil samples were extracted from three boreholes, as shown in Fig. (3), at various depths (8.95m and 10.5m). The basic properties obtained from these undisturbed and undisturbed soil samples were determined using a variety of tests. A light excavator with a 100 mm diameter and 500mm long cylindrical corer was pushed into the soil to the desired depth to extract the undisturbed soil (U100) sample; this static push method prevents the corer from rotating, resulting in high-quality samples (Figs. 4 and 5). Disturbed samples were collected using a drill and stored in plastic containers. The samples are then sent to the laboratory in sealed containers to preserve their natural moisture contents, preparing them for subsequent laboratory analysis.
The collected soil samples were subjected to two laboratory tests: soil classification tests (moisture content, Atterberg limits, specific gravity, and particle size distribution) and soil strength tests (standard proctor compaction and consolidation tests). After that, the samples were fully air-dried, and the lumps were pulverized and sieved for different tests performed using the British Standards, as summarized in Table 1. The chemical and mineralogical composition tests were also carried out to determine the characteristics of this soil and their impact on the physical and mechanical properties.
| Test | Standard |
|---|---|
| Natural Moisture Content | BS1377-2 [27] |
| Atterberg Limits ((Falling Cone) and Linear Shrinkage | BS1377-2 [27] |
| Particle Size Distribution (wet sieving) Particle Size Distribution (hydrometer) | BS1377-2 [27] |
| Particle Density / Specific Gravity | BS1377-2 [27] |
| Consolidation - oedometer test | BS1377-5 [28] |
| Compaction – Proctor Effort | BS1377-4 [29] |
5. RESULTS AND DISCUSSION
5.1. Microstructure of Ruaka Clay
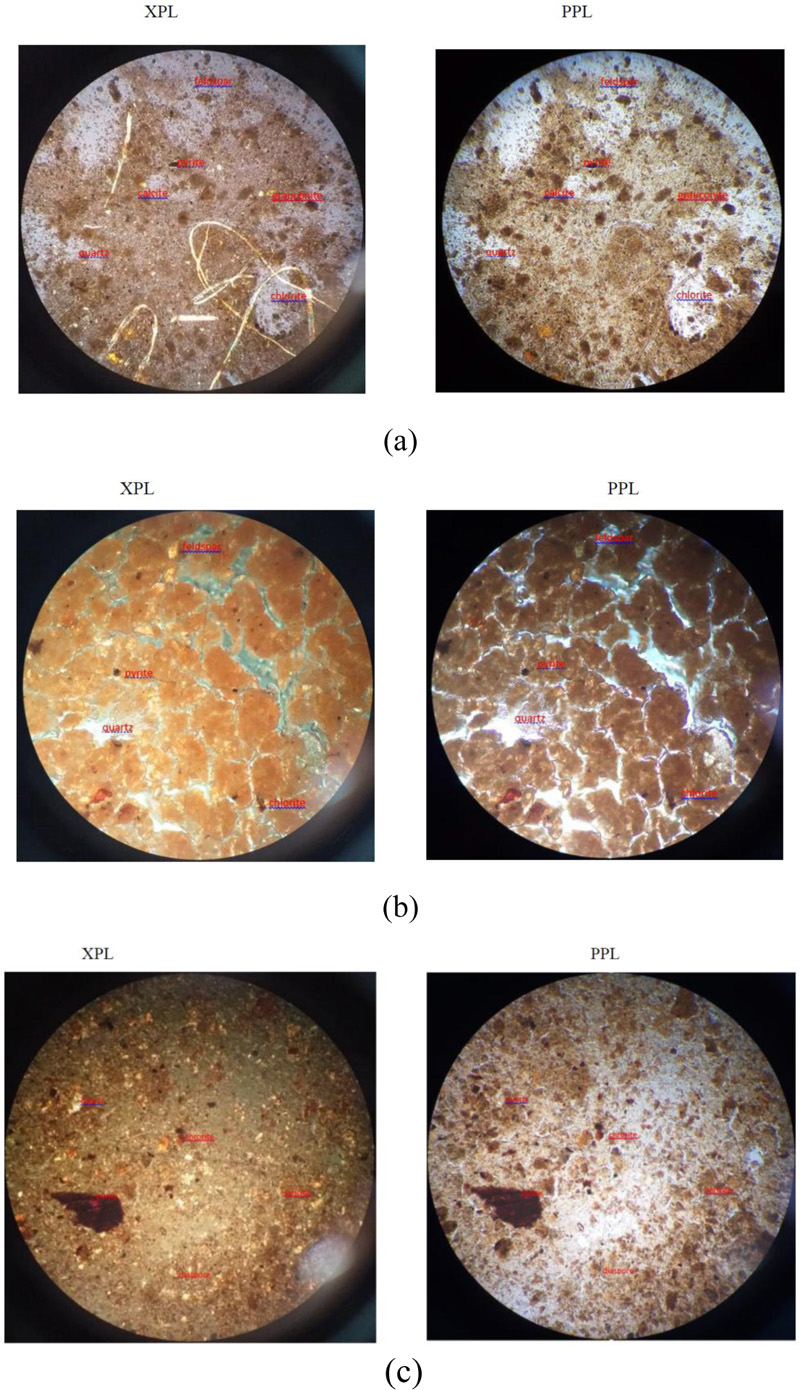
5.1.1. Petrology Test
Petrology refers to the scientific study of rocks focusing on their composition, texture, structure, occurrence, distribution, and origin. It assesses the physicochemical conditions and geologic processes. This test is also concerned with the three major types of rocks: igneous, metamorphic, and sedimentary.
The analyses were performed from three groups of samples from different depths categorized as Group 1, Group 2, and Group 3, respectively. These three groups of samples were prepared, dried, and hardened by heating at 105°C and subjected to a petrological analysis. Group 1 soil represents weathered clay soil with minute Quartz grains; Group 2 are these soils that showed red loam soil. The structure is argillaceous material, rich in organic and porous cementing materials. Finally, Group 3 was characterized by highly weathered aluminosilicate minerals due to alteration of the parent rock, making its behaviour seems like weathered red loam soil; the soil had Pyrite as a trace element. The microscope images are displayed in Fig. (6(a-c)), which describes the microstructure composition of each group.
5.1.2. X-Ray Fluorescence and X-Ray Diffraction Analyses
The chemical and mineral compositions in Ruaka's soils were determined using the standard chemical and mineral tests X-Ray Fluorescence (XRF) and X-Ray Diffraction (XRD), respectively. Several disturbed samples from Ruaka soil were subjected to chemical and mineral analyses to investigate the chemical and mineral composition of the tropical red soils in the study area. The clay of Ruaka had a nearly identical concentration of primary oxides (CaO, Fe2O3, FeO, MgO, Al2O3, SiO2). As listed in Table 2, the Ruaka soil contains high amounts of Al2O3, SiO2, and Fe, among other chemical components, indicating Halloysitic soil behaviour.
| Elements | % |
|---|---|
| Aluminium oxide, AL2O3 | 34.47 |
| Silica oxide, SiO2 | 45.76 |
| Potassium oxide, K2O | 0.509 |
| Calcium oxide, CaO | 0.034 |
| Titanium oxide, TiO | 1.652 |
| Manganese, Mn | 0.467 |
| Iron oxide, Fe2O3 | 16.387 |
| Zirconium, Zr | 0.225 |
| Niobium, Nb | 0.076 |
| Yttrium, Y | 0.022 |
| Rubidium, Rb | 0.012 |
| Zinc, Zn | 0.02 |
| Nickel, Ni | 0.009 |
| Copper, Cu | 0.004 |
| Molybdenum, Mo | 0.003 |
| Cerium, Ce | 0.308 |
| Thorium, Th | 0.015 |
| Thallium, TL | 0.011 |
| Lead, Pb | 0.009 |
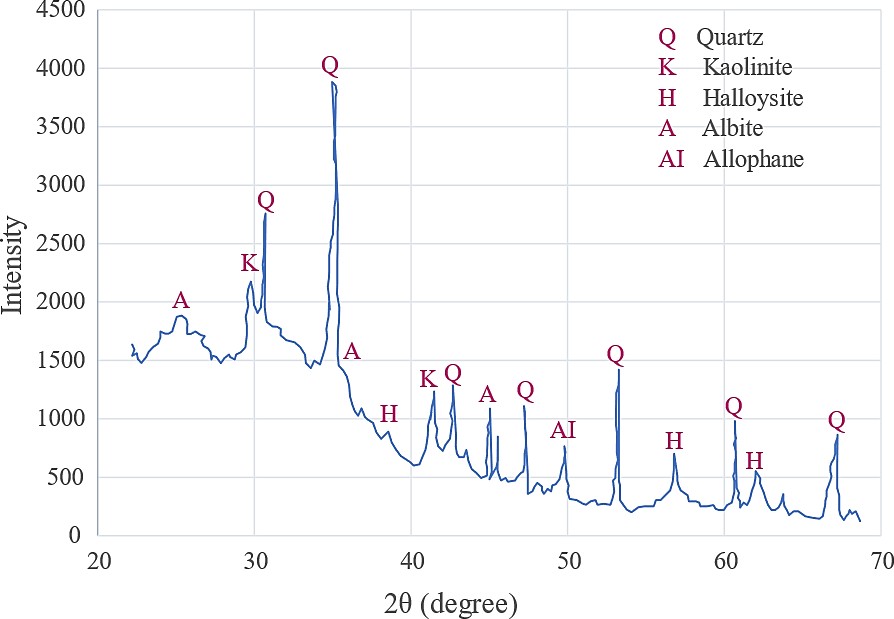
From Table 2, a significant percentage of 'free' iron oxide (16.40%) was observed in the Ruaka clay, which might be responsible for their clustering since iron oxide is known to behave as a cementing agent [30]. The XRD investigation revealed that the dominant clay minerals in Ruaka's soil were Quartz, kaolinite, and Halloysite, with a fraction of Allophane, and albite, as shown in Fig. (7).
Temperature, drainage, and topography have reduced the in-place rocks to residual soils ranging from clays to sandy silts and silty sands, grading into saprolite and partially weathered rocks as depth increases, which are controlled by the minerals in its clay [4, 16, 17, 31]. Quartz is resistant to chemical disintegration during weathering, whereas feldspar and Mica are primarily converted into clay minerals.
5.2. Physical Properties
5.2.1. Moisture Content and Atterberg Limits
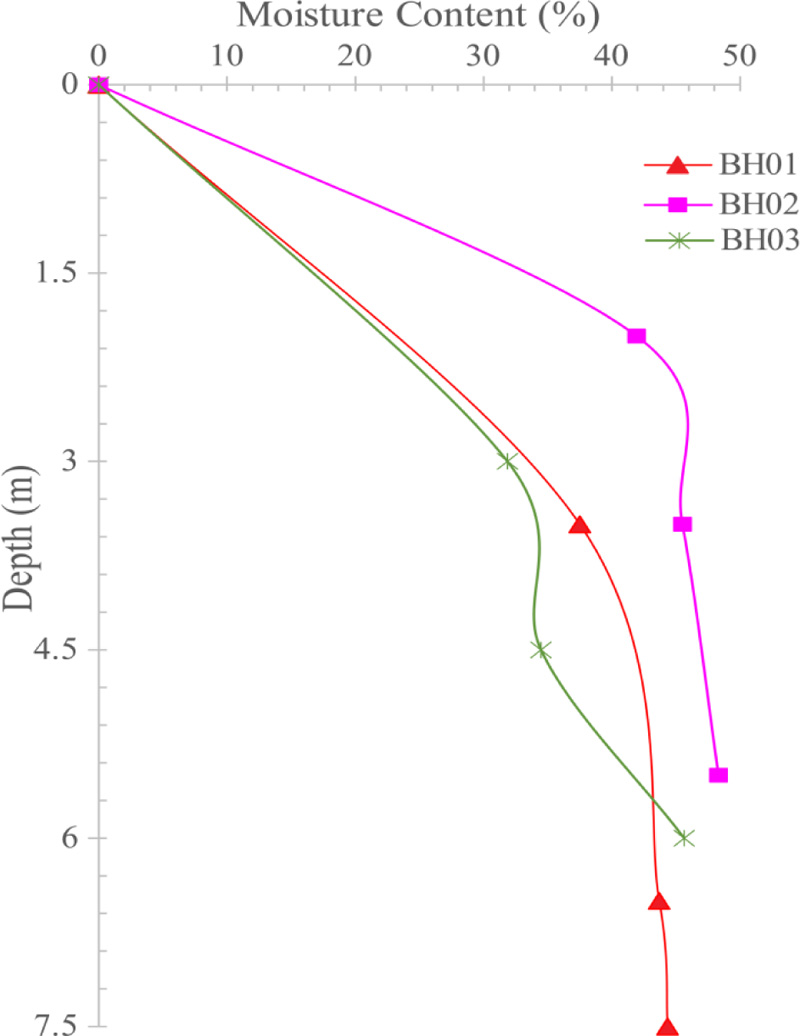
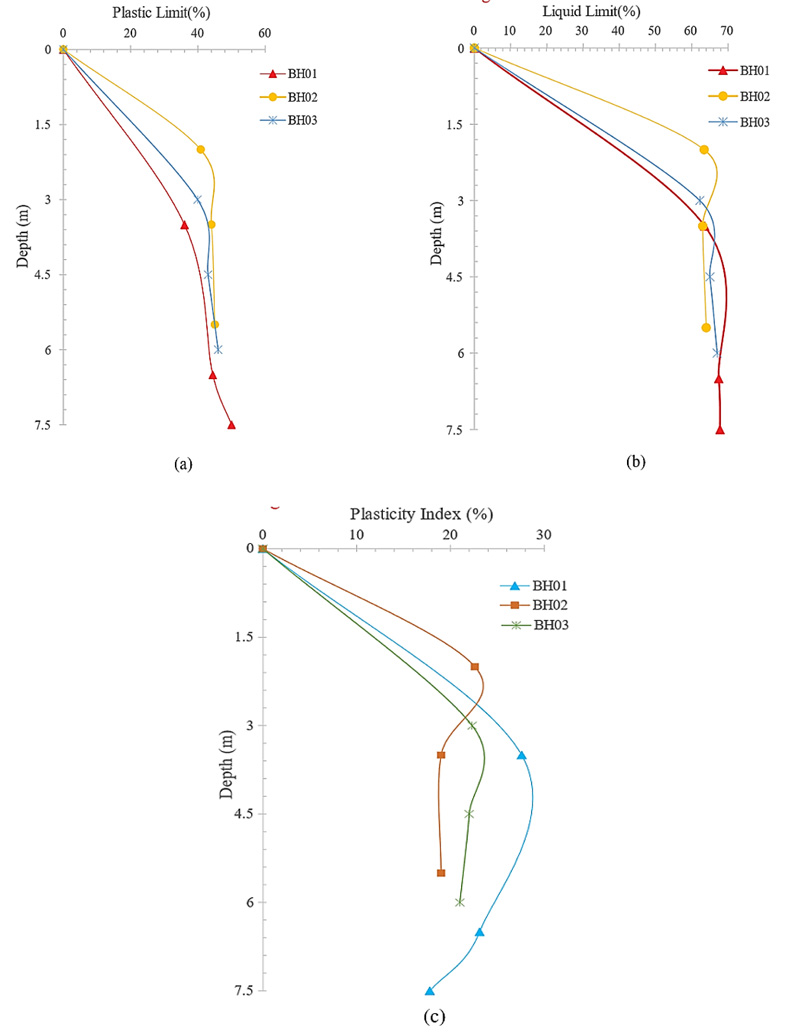
The tests were performed on the natural and heated soils according to the procedure outlined in BS 1377: Part 2: 1990 [27]. Table 3 summarises the values of moisture content (MC) and Atterberg limits (plastic limit (PL), Liquid limit (LL), and plasticity index (PI) in the initial state for the samples; Fig. (8) shows the MC distribution with depth.
| Borehole | Depth | P L | LL | P I | In-MC |
|---|---|---|---|---|---|
| BH01 | 3.5 | 36 | 63.55 | 27.6 | 37.5 |
| 6.5 | 44.4 | 67.45 | 23.1 | 43.7 | |
| 7.5 | 50 | 67.8 | 17.8 | 44.35 | |
| BH02 | 2 | 40.8 | 63.4 | 22.6 | 41.92 |
| 3.5 | 50 | 62.6 | 12.6 | 45.50 | |
| 5.5 | 44.8 | 63.4 | 18.6 | 48.32 | |
| BH03 | 3 | 45.5 | 62.21 | 16.7 | 31.87 |
| 4.5 | 40 | 65 | 20 | 34.48 | |
| 6 | 37.9 | 67 | 29.1 | 45.64 |
Twelve block samples were collected from three boreholes with depths ranging from 3m to 9m. The site investigation revealed that the structure of this soil is susceptible to drying. As a result, the testing was done as close to the natural moisture content MC. So, when drying was required, it was achieved through air-drying or oven drying at a maximum temperature of 105°C.
The initial MC for tropical red clay from Ruaka was high. The trend showed a slight increase in the water content with the depth, which is consistent with what has been reported in earlier studies [3, 10, 11, 32-35] regarding this soil's abnormal behaviour. In contrast, Abner [2] found a decrease in the Atterberg limits and an increase in MDD while studying the effect of temperature on red clay. The initial MC values converged significantly with the PL values. The trend of the water content distribution for BH01 and BH03 seems to be similar, whilst the trend of BH02 was at the upper bound of that trend.
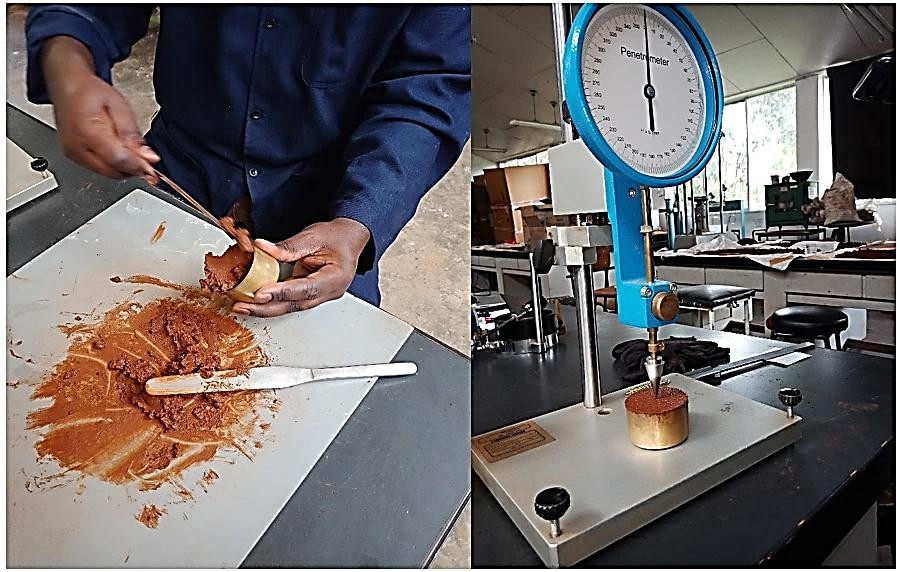
Fig. (9) shows the profile of the Atterberg limits with depth. The LL was determined using the Cone penetrometer test, (Fig. 10), the preferred method for the Casagrande test. The laboratory results in Table 3 indicated that both LL and PL values at different depths in each borehole showed slight variations. However, the trend in BH02 showed a slight increase in the values of LL and PL than other boreholes. The reasoning behind some of these findings is that the capacity of a clay particle to hold exchangeable metal ions is determined by the size of the diffused double layer and the dipolar water attracted to that layer.
For analyzing and defining the residual soils, Atterberg limits are a helpful tool. However, these limits should not be considered separately. The emphasis was placed on the plasticity chart, which is a valuable indicator of its engineering properties. The soil profiles appeared non-uniform at 2m and deeper up to 7.5m, as evidenced by a downward increase in index characteristics (MC and Atterberg limits) with depth. However, these results seem to be different from what has been reported by Northmore et al. [17], who investigated the soil in three locations in central Kenya northwest of Nairobi at 7.9m. Their findings revealed that index properties were homogeneous across sites, with no identifiable trend with depth, which confirms that the behaviour of this soil is unpredictable as it depends mainly on the mineral composition of the soil in the particular region.
5.2.2. Specific Gravity
The specific gravity or particle density, Gs, was determined using the Pyknometer method, (Fig. 11) following BS 1377-2 (1990). The particle densities of the samples were unusual for clay soil, ranging between 2.30 and 2.55 and lower than those reported for residual soils in previous studies [4, 5, 8, 35-37], which could be attributable to the proportion of organic matter inherent in its parent rocks. On the other hand, some of the samples had anomalous values such as 2.94 and 2.21, which agreed with [14, 18, 38] that tropical soils could have unusually high, or unusually low soil characterized by highly variable particle densities. Northmore et al. [17] investigated various samples from some tropical regions in Kenya, and they found a broader range of Gs ranging from 2.67 to 2.95.
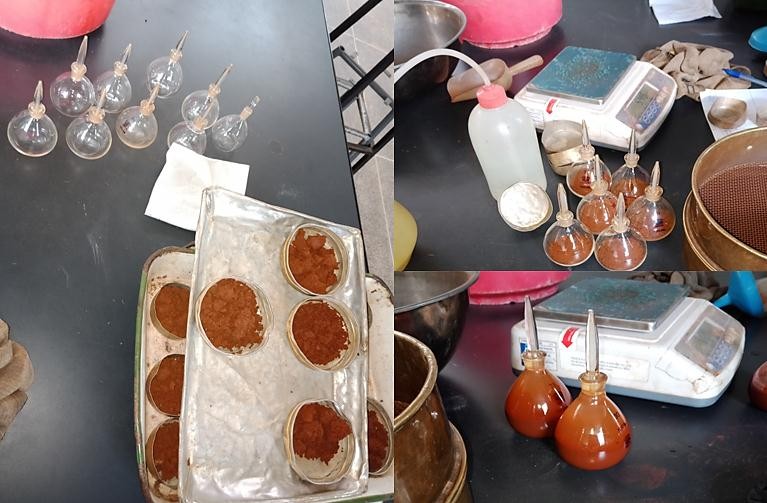
The main factor that affects the Gs of Ruaka soils is the presence of clay minerals with low particle density, such as kaolinite which has a particle density that varies between 2.2 and 2.6. Another factor contributing to reducing the Gs of Ruaka soil was oven drying of samples. Furthermore, the previous research [12, 17, 33] discovered that hydrated minerals such as Halloysite usually lost little inter-layer moisture after oven drying, resulting in a reduction in the Gs of soil.
5.2.3. Particle Size Distribution
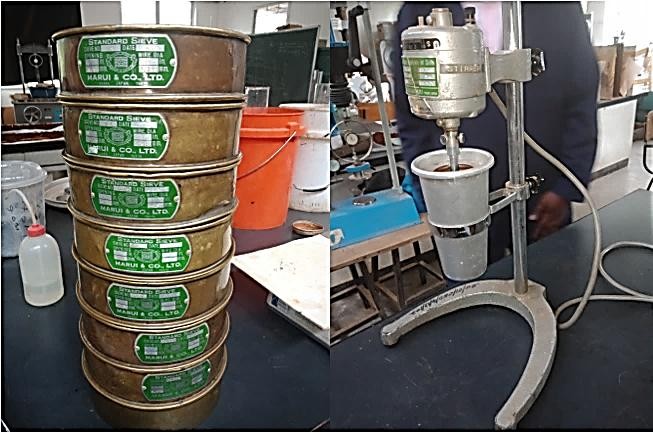
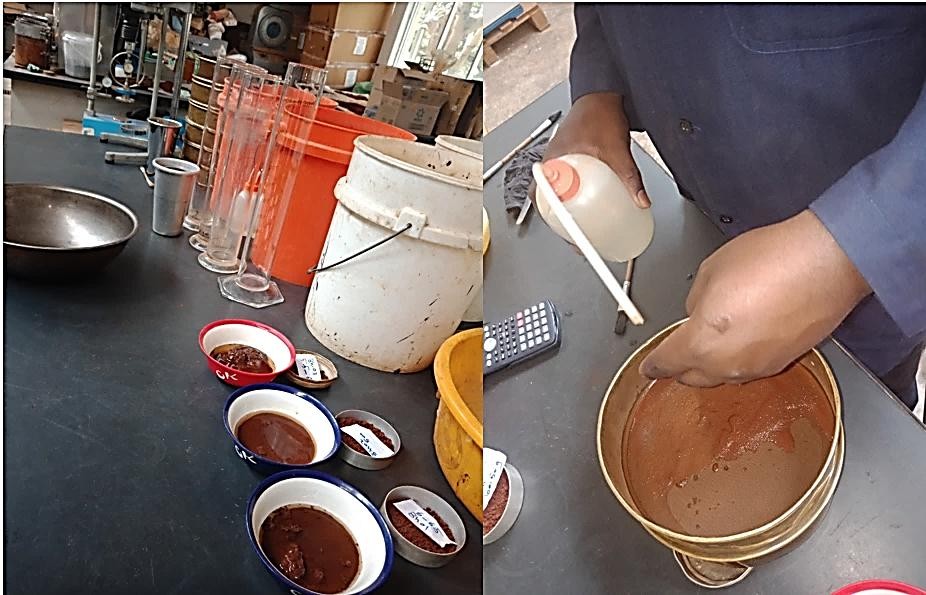
The particle size distributions of the samples were determined using a combination of wet sieving and hydrometer analysis following the standard BS1377-2 [27]. The mechanical or sieve analysis on oven drying samples was performed to determine the distribution of the coarser, larger-sized particles. The remainder (≤ 0.075mm) is determined by a sedimentation technique that assumes that the soil particles in aqueous suspension obey Stokes' Law which provides a smooth curve and complete gradation profile of coarser soils, Fig. (12). When the soil sample is dispersed in water, the particles settle at different rates depending on their shape, size, and weight, as shown in Fig. (13). To avoid the effect of the dispersing agent on the particle size distribution results, Sodium Hexametaphosphate was used as a dispersing agent at a concentration of 2g/litre.
The grading curves of samples from various depths and boreholes are shown in Fig. (14), and the percentages of fine particles in Ruaka's soil are listed in Table 4.
| Borehole | Samples | Ruaka | ||
|---|---|---|---|---|
| Fine fractions | ||||
| Clay % | Silt % | Sand % | ||
| BH01 | S1 | 59 | 40 | 1 |
| S2 | 67 | 31 | 2 | |
| BH02 | S1 | 77 | 22.9 | 0.1 |
| S2 | 78 | 21.9 | 0.1 | |
| BH03 | S1 | 66 | 33.9 | 0.1 |
| S2 | 79 | 21 | 0 | |
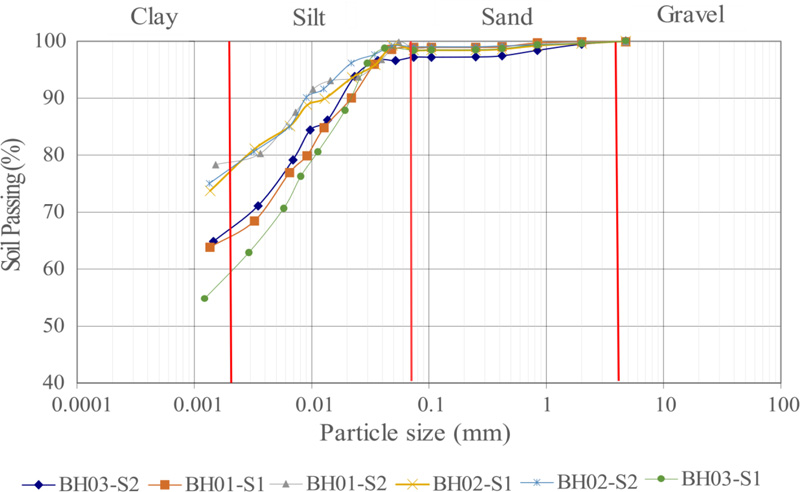
Although the analysis included soil from various boreholes and depths, the trends of grading curves exhibited strikingly similar behaviour. According to the BS system, the soils are classified as clay with high plasticity (CH), with a high percentage of clay and silt ranging from 59-79% and 21-40%, respectively. These results support the findings of Abner [2], who reported that soil exposure to elevated temperature leads to clay minerals and water evaporation reactions. Temperature variation decreases the particle size in sandy soil, whereas in clayey soil, the particle size increases as a result of the accumulation of clay fraction [2]
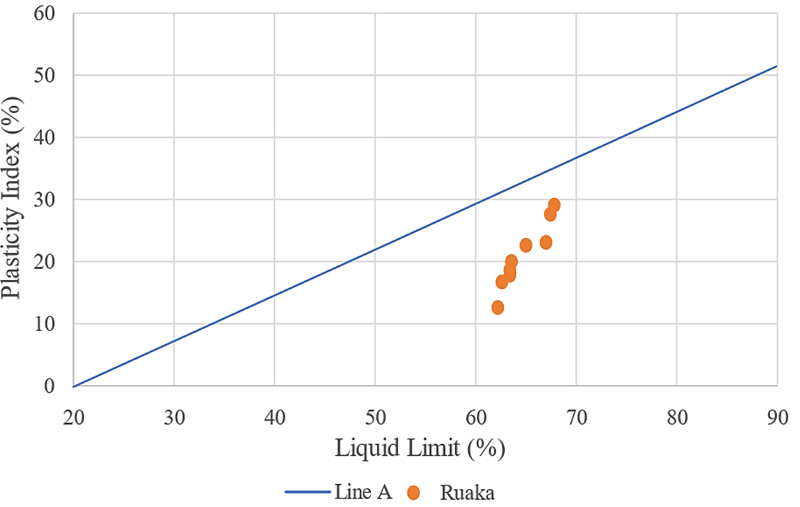
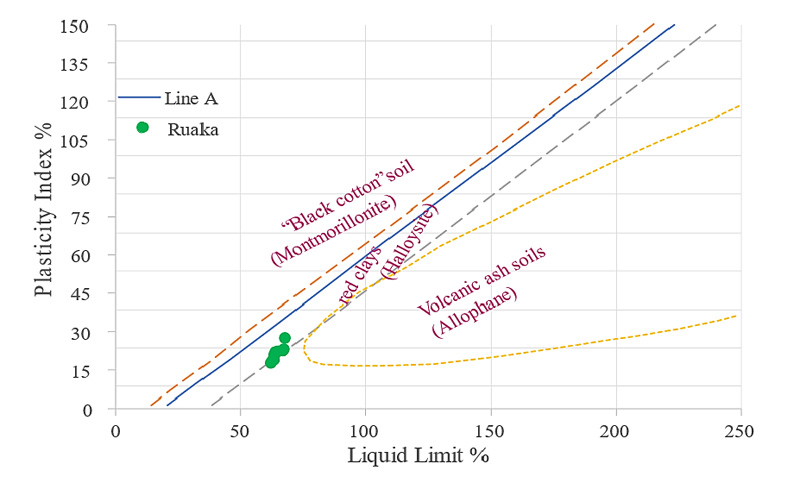
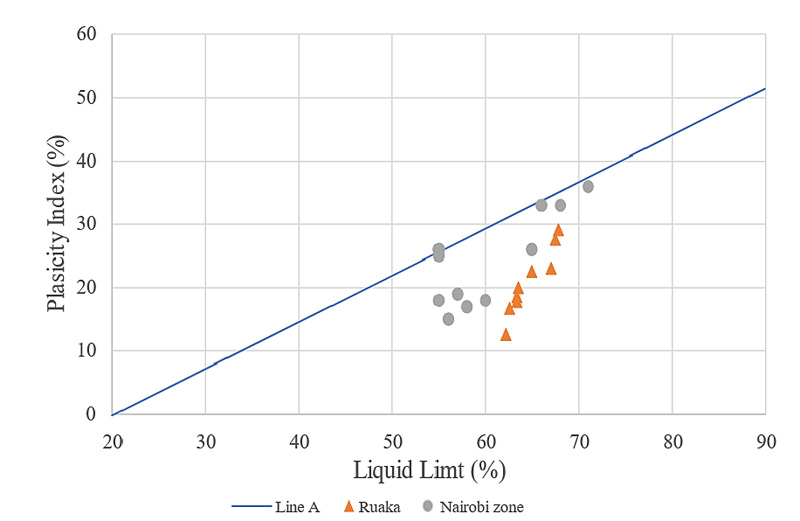
It is noteworthy that problems arise in residual soils when attempting to relate the classification boundaries to LL or PL separately, as in all soil classification systems. As a result, by combining the effects of PL and LL, the plasticity chart becomes a robust criterion for analyzing the behaviour of residual soils. The high values of LL, PL, MC, void ratio, and a significant percentage of clay were contributed to the soil of Ruaka being located below line A, as shown in Fig. (15). This location was consistent with the tropical zone identified by Dixon & Robertson [10] for the tropical soil in Kenya in Fig. (16).
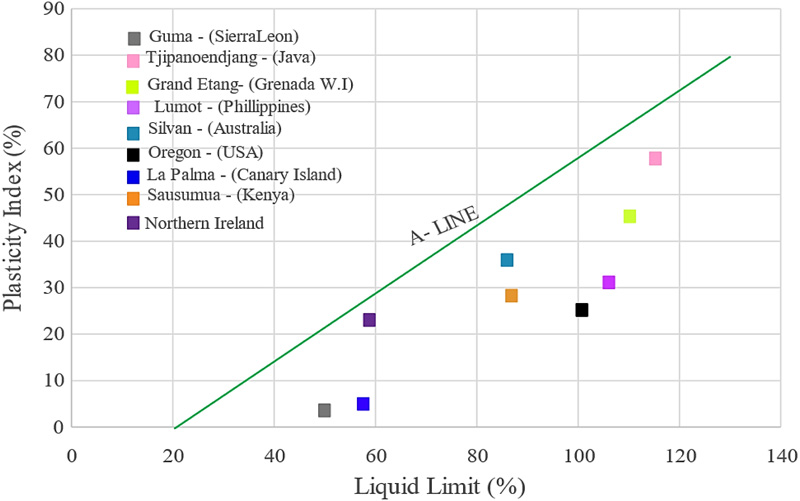
Wesley [8] improved the plasticity chart by combining subdivision lines relevant to the mineralogical composition of residual soils and attempting to concentrate on the ubnormal minerals in clay soil. Moon [40] later validated the Wesely [8] graph using more current data from a range of Halloysite-dominated zones.
It is evident from the Wesely graph in Fig. (17) that the soil in Ruaka tends to be halloystic soil, which was also supported by XRD and XRF analysis. This could explain some of the unusual characteristics of Ruaka soil, such as its high percentage of plasticity and clay content. Northmore et al. [17] found that in most tropical red soils, particularly those containing the hydrated form of Halloysite (A12O.2SiO2. 4H2O), oven drying cannot remove the initial MC from the soil altogether. As a result, soil plasticity increases, resulting in apparently high MC. However, the breakdown of soil structure and the subsequent increase in clay content may also explain the rise in soil index values.
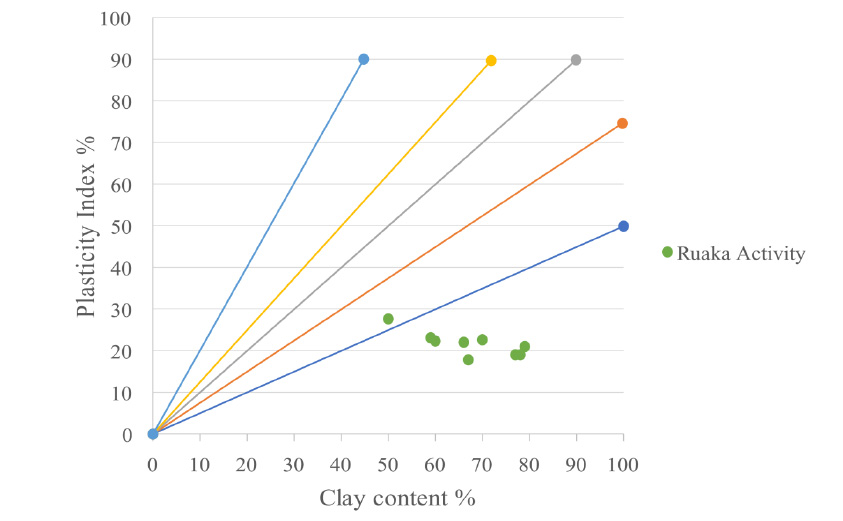
5.2.4. Activity
The PI and the percentage of clay were used to assess the clay activity for Ruaka samples. The plasticity indexes of the samples were plotted against the clay content using Skempton [39] linear relationship based on the calculated PI and clay content. From Fig. (18), according to Skempton [39] categorization, the clay activity of the soils under investigation ranged from 0.41 to 0.63. Akalu [37]. found a range of activity values of 0.11 to 0.7 with an average value of 0.37 when investigating the engineering properties of red soil in western Addis Ababa that was rich in kaolinite. As evidenced by XRD analysis for the samples of Ruaka, Quartz, kaolinite, Halloysite, and Mica were the dominant minerals in Ruaka clay and have all been low activity minerals [8], if not wholly inactive, such as Quartz. According to Skempton [39], there is a strong correlation between the activity, mineralogy, and clay's geological history, as presented in Table 5.
5.3. The Properties of Ruaka to other Tropics Regions in Kenya
According to Northmore et al. [17], when different soils are grouped or classified based on the plasticity chart, any other soil with the same in situ structural state could be embedded into that zone. Subsequently, it will behave similarly to the soils within that group. As a result, similar behaviour and mineralogical composition can be expected for Ruaka soils compared to clay soils in temperate climates. Table 6 summarises the properties of 12 different regions in Kenya compared to the properties of Ruaka.
| Mineral | Activity |
|---|---|
| Quartz | 0.0 |
| Calcite | 0.18 |
| Mica (muscovite) | 0.23 |
| Kaolinite | (0.33 - 0.46) |
| Illite | 0.90 |
| Na-montmorillonite | 7.2 |
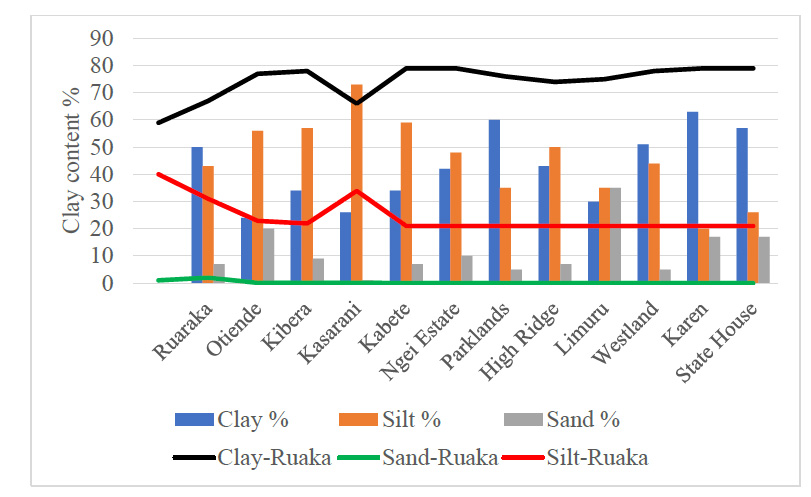
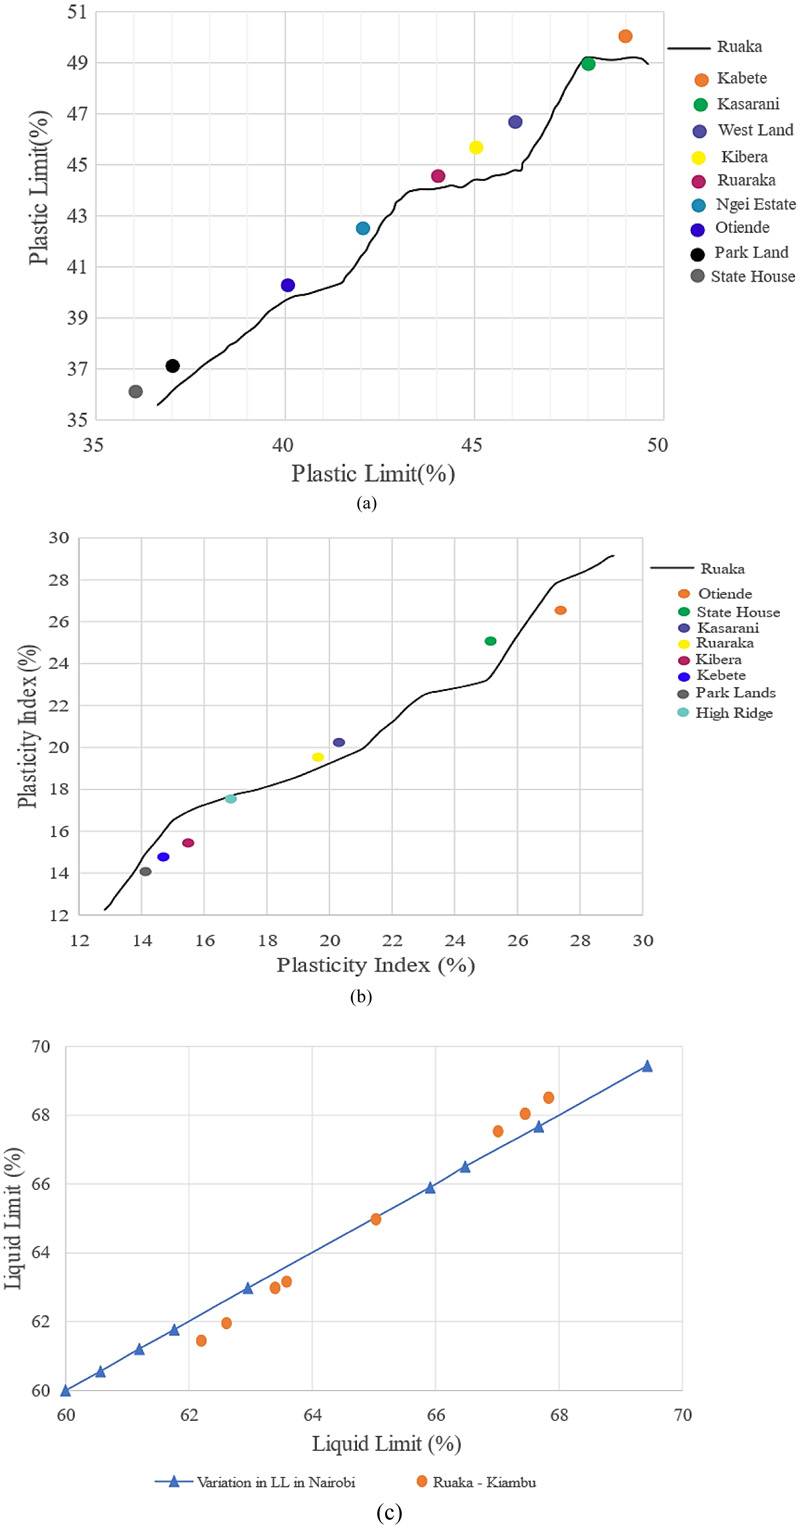
According to Fig. (19), the soil in Ruaka has a higher proportion of clay-sized grains than soil in other regions. As a result of the increased presence of clay particles, samples from this soil appear to have higher plasticity. In contrast, the percentages of clay and silt in soils from other locations varied slightly. The PL and Plasticity Index of Ruaka soils showed a good agreement with the Atterberge limits of other regions detailed in Fig. (20a,b). The LL of Ruaka was slightly higher in a few points and almost homogeneous in all areas in Fig. (20c). However, Ruaka soil had a higher clay concentration than other regions in the analysis. The findings of Northmore et al. [17] were validated by Fig. (21) since the soils of Ruaka, and other regions were in the same group and thus behaved similarly. So, understanding the behaviour of a specific group of soils aids in predicting the behaviour of a new type of soil in the same zone.
| No | Location | Clay % | Silt % | Sand % | Atterberg Limits (%) | Specific Gravity | Compaction | Cc | |||
|---|---|---|---|---|---|---|---|---|---|---|---|
| LL | PL | PI | MDD KN/m3 | OMC | |||||||
| 1 | Ruaraka | 50 | 43 | 7 | 55 | 37 | 18 | 2.65 | 13.4 | 30.5 | _ |
| 2 | Otiende | 24 | 56 | 20 | 66 | 33 | 33 | 2.7 | 14.2 | 28.3 | 0.332 |
| 3 | Kibera | 34 | 57 | 9 | 57 | 38 | 19 | 2.64 | 13.2 | 32.4 | _ |
| 4 | Kasarani | 26 | 73 | 1 | 55 | 30 | 25 | 2.68 | 13.6 | 29.7 | 0.45 |
| 5 | Kabete | 34 | 59 | 7 | 60 | 42 | 18 | 2.66 | 13.6 | 36.5 | 0.43 |
| 6 | Ngei Estate | 42 | 48 | 10 | 71 | 35 | 36 | 2.66 | 13.6 | 31.5 | 0.365 |
| 7 | Parklands | 60 | 35 | 5 | 56 | 41 | 15 | 2.61 | 13.6 | 32.6 | 0.235 |
| 8 | High Ridge | 43 | 50 | 7 | 58 | 41 | 17 | 2.69 | 13.4 | 32 | 0.294 |
| 9 | Limuru | 30 | 35 | 35 | 65 | 39 | 26 | 2.66 | 14.1 | 29.4 | 0.15 |
| 10 | Westland | 51 | 44 | 5 | 65 | 39 | 26 | 2.65 | 13.6 | 32 | _ |
| 11 | Karen | 63 | 20 | 17 | 68 | 35 | 33 | 2.65 | _ | _ | 0.11 |
| 12 | State House | 57 | 26 | 17 | 55 | 29 | 26 | 2.62 | _ | _ | 0.255 |
5.4. Mechanical Properties
The mechanical properties of a number of samples from the study area were carried out in the laboratory according to British Standards Institution [29], BS1377:Part 5:1990 [28], which included the consolidation (oedometer test), standard Proctor test, and permeability test. These properties were then linked to the soil type and its chemical and mineralogy composition.
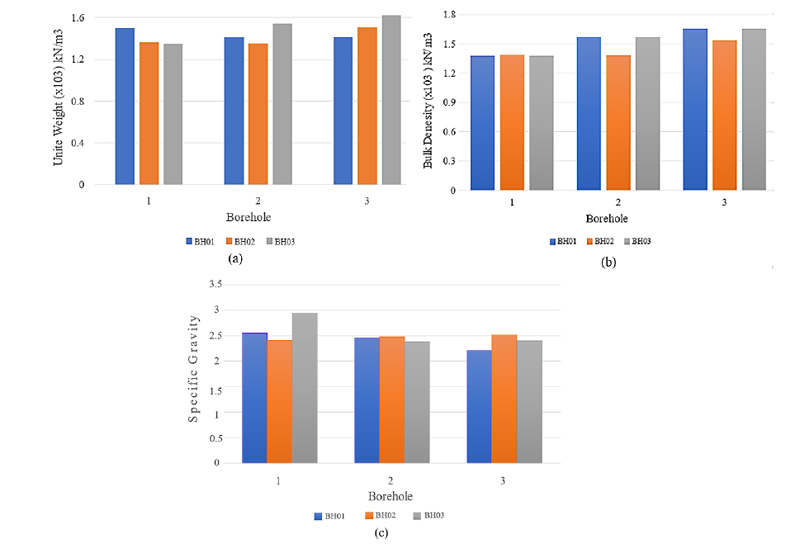
The bulk density and void ratio were calculated using particle density (in situ) for the samples in their natural state. The analysis of results in Fig. (22a-c) indicated that BH02 and BH03 had high convergence properties, while BH01 had slight differences.
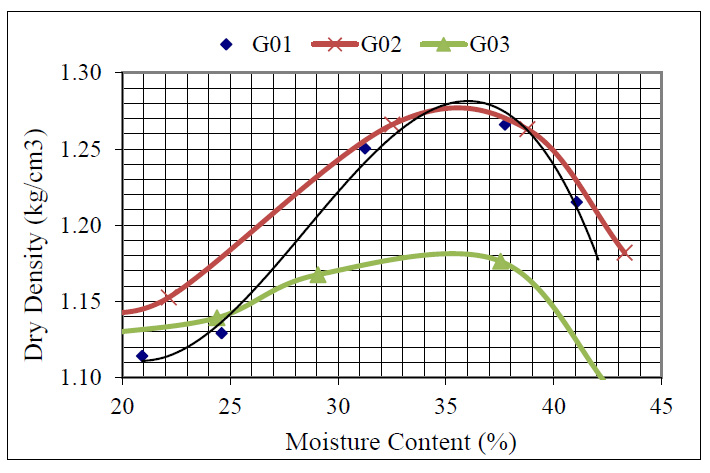
Based on the similarity of the physical properties of the Ruaka soil, the samples were combined and divided into three main groups: Group01 (G01) up to 3.5m, Group02 (G02) up to 6m, and Group03 (G03) up to 7.5m and were sufficient to describe the general behaviour of the Ruaka soil. Furthermore, this reduced the number of samples and laboratory tests, particularly in oedometer tests and the standard proctor test, which helped avoid error and confusion when interpreting the results.
5.4.1. Compaction Test
A series of compaction tests were carried out on the three groups of soils using the Proctor apparatus according to the British Standards Institution [29]; British Standard Light (BSL) or Standard Proctor compaction test was used. The tests involved compacting the soil into three layers, each receiving 25 blows from a 2.5kg rammer falling through a height of 300mm. The blows were uniformly distributed over the surface of each layer during compaction. Individual data and the best fit curve were displayed for moisture content versus dry density. The values of the MDD and OMC obtained from the compaction tests are shown in Table 7 and Figs. (23 and 24).
| Borehole | MDD (kg/m3) | OMC (%) |
|---|---|---|
| Group01 | 1280 | 36 |
| Group02 | 1278 | 36 |
| Group03 | 1181 | 34.5 |
Compared to usual tropical clay soils in Kenya, which have been documented by earlier researchers [5, 35, 37, 40, 41], values of MDD of Ruaka were low, and values of OMC were high, as shown in Fig. (23) and Table 7. The data of Ruaka were closely grouped on a plot of moisture content versus dry density, with OMC of 35% and MDD around 1.2 Mg/m3, which is consistent with the findings by Northmore et al. [40], who reported MDD of approximately 1.2 Mg/m3 and OMC about 45% when investigating typical tropical clay soil in Kenya.
Coleman et al. [42] reported maximum dry density for the Nyeri region in Kenya at around 1313.6 kg/m3, and the optimum moisture content was 36% which is correspondingly high. However, the value reported for red clay was low compared with average clay soils.
Dixon & Robertson [10], reported optimum moisture content of approximately 50% and maximum dry density of about 72 lb/ft a (1153.4 kg/m3) and 65 to 75 Ib/ft with optimum moisture content ranging from 55% to 45% for Ruiru, and Sasumua Dams in Kenya, respectively. However, on the other hand, the high or low density is related to changes in soil lithology.
5.4.2. Consolidation Test (Oedometer Test)
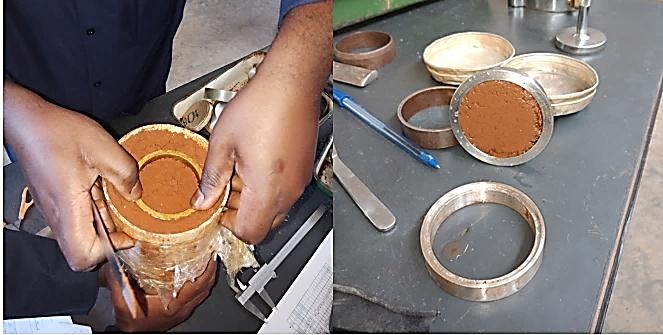
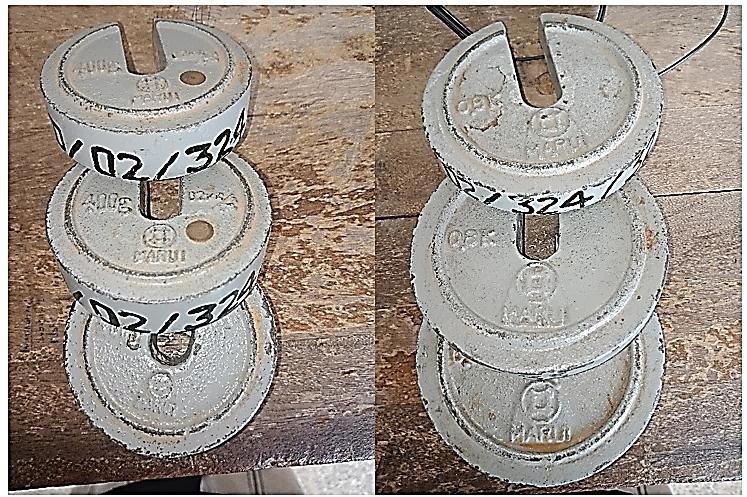
The consolidation tests were carried out according to BS: 1377: Part 5: 1990 [28] on a number of undisturbed samples (U100) from each group. The samples were extruded from the tubes into the ring of consolidation and used directly by 6cm diameter and 2cm height, (Fig. 24). A laboratory experiment, 1-D consolidation was carried out by oedometer test by applying the standard loads of 100, 200, 400, 800, 1600, and 3200 Kp, (Fig. 25). The load increments were kept for at least 24 h or until the pore pressure was entirely dissipated.
It is noteworthy that higher density values were recorded when determined from oedometer specimens, with average differences ranging between 14, 18, and 23% for G01, G02, and G03, respectively. The oedometer ring preparation process was most likely the cause for this slight increase in sample density.
The initial undisturbed void ratios ranged between 1.145 and 1.63, which was lower than the void ratio reported by Northmore et al. [40]. In their study, void ratios of Indonesian and Kenyan soils ranged from 1.14 to 5.36 and 0.92 to 3.47, respectively, and had high natural moisture contents (greater than 150% in some samples), indicating the presence of Allophane in both cases. In the case of Ruaka, on the other hand, the hydrate Halloysite was dominant.
Based on the computed void ratios at the end of each load stage, all load stages are usually merged into a single graph of void ratio as a function of the logarithm of the effective pressure, as shown in Fig. (26). The values of the compression index Cc generated from the logarithmic plot of void ratio and effective pressure to indicate the settlement magnitude are detailed in Table 8.
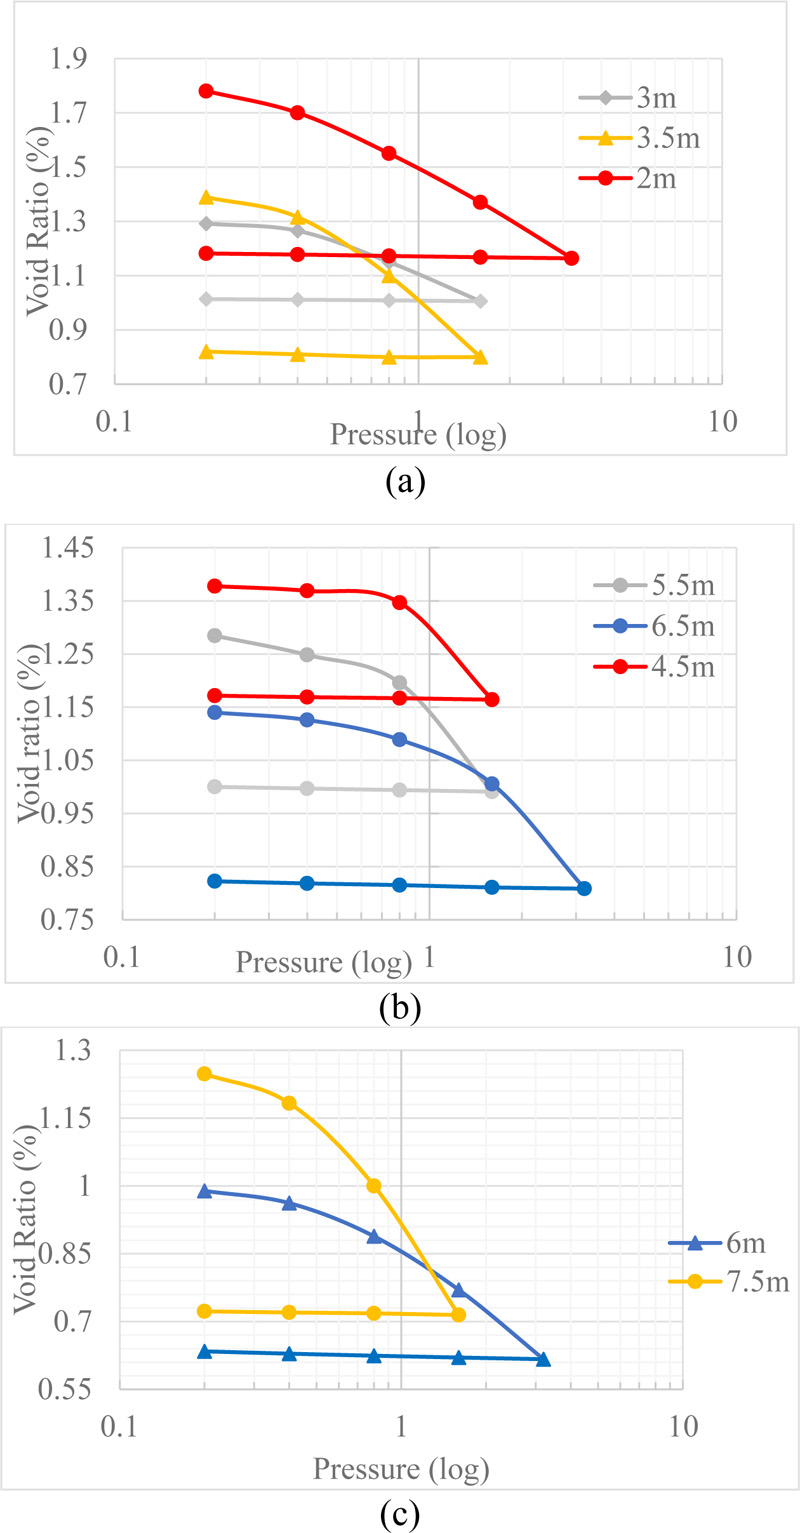
| Borehole | Depth (mm) | Compression index, Cc |
|---|---|---|
| G01 | 3.5 | 0.35 |
| 3 | 0.29 | |
| 2 | 0.21 | |
| G02 | 6.5 | 0.45 |
| 5.5 | 0.3 | |
| 4.5 | 0.25 | |
| G03 | 6 | 0.17 |
| 7.5 | 0.27 |
As the applied pressure increases with depth, the rate of void ratio decreases, increasing Cc values.
The Ruaka soil had high values of void ratio and the degree of saturation which ranged between (1.21- 1.82) and (69- 99) %, respectively. The permeability ranged between (1.223E-5 – 2.464E0-6) cm/s, which was explained because Halloysite occurs in materials with a loose, open structure generated during the depositional and weathering processes resulting in a high porosity and the void ratio [43].
CONCLUSION
This study was designed to investigate the effect of mineral and chemical composition on soils' physical and mechanical properties for the red clay soils selected from Ruaka, Kenya. The investigation showed that the soils' microstructures, chemical, and mineral composition for tropical residual soils, particularly those formed from volcanic rocks, have a distinct mineralogical composition that governs their behaviour and makes them unpredictable. Therefore, working with this soil type might prove more challenging for civil engineering applications. Based on the laboratory findings, the following conclusions are drawn:
- According to XRD analysis, the most abundant minerals in Ruaka clay were Quartz, kaolinite, Halloysite, and Mica. The chemical testing revealed high concentrations of AL2O3 and SiO2; the analysis also revealed the presence of a cementing agent represented by free iron oxide, which has a significant amount (16.40%) in the chemical composition.
- The structure and physical properties of tropical red clays may be altered by the mineralogical composition of these soils and partial air-drying at ambient laboratory temperatures. Some of these changes are not reversed when the soil is re-mixed with water. These structural changes can be seen in the index properties such as Atterberg limits, particle size, and particle density (Gs) tests.
- The preliminary tests for the samples in their natural state (in situ) showed a high convergence in their properties (the unit weight, the specific gravity, and the bulk density). However, Ruaka soils showed a high Liquid Limit between 63-68% which increased with increasing depth, and high moisture content varied between 37- 46% convergence with their plastic limit with a slight increase as depth increased. Other soil properties, such as clay content, increased, ranging from 59 to 79%.
- Ruaka clay was found to have a high void ratio of 1.145 to 1.63, with saturation values ranging from 69 to 99%. This increased permeability and lowered MDD by an average of 1247 kg/m3 with 35.5% OMC.
- The presence of kaolinite, Quartz, and oven drying of hydrated Halloysite significantly reduces the specific gravity (Gs) values.
- A good positive relation was observed from the oedometer test between the void ratio, e, and the compression index, Cc, with increased pressure and depth. However, the high amount of clay content made this soil mechanically unstable.
- Compared to the other nearby regions with the same tropical soil features in Kenya, Ruaka clay showed a higher fraction of clay-sized grains, which appear to have higher plasticity; however, Atterberg limits revealed a good agreement with the trend of other regions. This type of correlation is highly recommended because understanding the behaviour of a specific group of soils aids in predicting the behaviour of a new type of soil within that zone.
CONSENT FOR PUBLICATION
Not applicable.
AVAILABILITY OF DATA AND MATERIALS
The authors confirm that the data supporting the findings of this study are available within the manuscript.
FUNDING
None.
CONFLICT OF INTEREST
The authors declare no conflict of interest, financial or otherwise.
ACKNOWLEDGEMENTS
Declared none.

