All published articles of this journal are available on ScienceDirect.

Seismic Performance Assessment of the Historical Reggio Calabria Cathedral
Authors Info & Affiliations
Abstract
Background:
Italy's church buildings' cultural and architectural significance cannot be overstated.
Objective:
This paper addresses the seismic vulnerability of the cathedral located in Reggio Calabria, Italy. The analysis of this building is interesting as it was retrofitted after the destructive 1908 Messina-Reggio Calabria earthquake.
Methods:
The original design illustrating the static schemes and the considered actions of the church are described. Structural drawings of that time are also reported, which proved to be fundamental for the numerical modelling of the building. The issues and assumptions made during the modelling phase of the structure with the seismic actions are also illustrated. All the transverse and longitudinal frames were analysed using nonlinear analysis to evaluate the seismic capacity and vulnerability indicators in terms of accelerations and periods.
Results:
The results provided by the modal analysis are presented and discussed to highlight the global dynamic behaviour of the church.
Conclusion:
The seismic vulnerability indicators have been calculated by considering the seismic actions recommended by the current technical standards and concerning the 1975 Messina earthquake, which represents the most severe earthquake experienced by the church.
1. INTRODUCTION
A thorough investigation of various factors contributing to the destruction of structures, particularly during the most devastating events, such as earthquakes, is required to preserve religious testimonies. The Basilica of Maria Santissima Assunta in Cielo (the full name of the cathedral of Reggio Calabria) is a significant case due to the use of reinforced concrete (R.C.), a very vital material at the beginning of the past century as well as for the seismic design concept as it was rebuilt between 1917 and 1928, after the devasting 1908 earthquake [1].
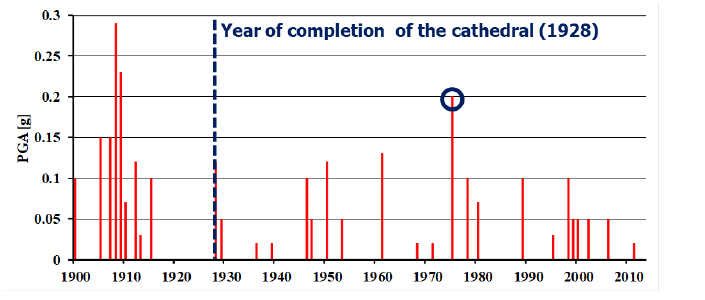
The Reggio Calabria region experienced multiple earthquakes, as demonstrated in the histogram of (Fig. 1), which plots the maximum peak ground acceleration recorded from 1900 to 2015. The histogram shows that a major earthquake happened at daybreak on December 28, 1908. The shock lasted 30-40 seconds, according to the people. According to witnesses, there were many aftershocks, the most intense of which was excessively powerful. According to data from instrumental recordings and microseismic estimates, it had a magnitude of 7.1 on the Richter scale. In Reggio Calabria, over 80% of the structures were destroyed. The calamity was caused not only by the earthquake's extraordinary ferocity but also by structural integrity concerns in urban buildings. Furthermore, the city's coastal section was built on erratic alluvial soils. Furthermore, the buildings' static characteristics were often poor due to low-quality materials and insufficient maintenance.
According to the statistical data, the Ministry of Public Works [2] collected, in the three provinces of Messina, Reggio Calabria, and Catanzaro, more than 40,000 houses were destroyed, severely damaged, and totally or partially refurbished. It is also reported that about 33,000 people were uninhabitable, and around 68,000 were injured.
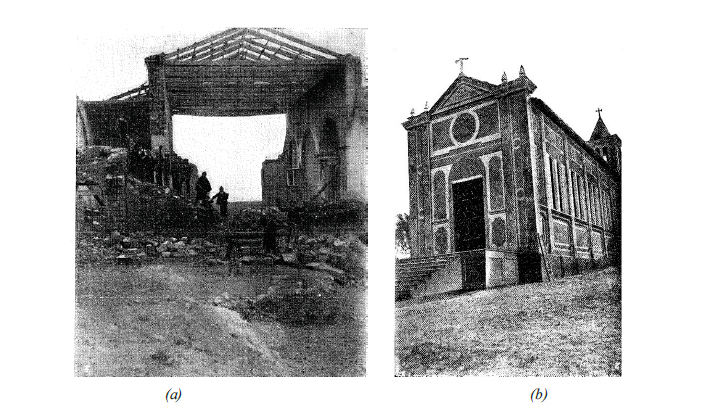
As reported in [3], on 15 January 1909, 18 days after the seismic event, a ministerial committee was commissioned to inspect Calabria and Sicily regions to examine the effect of the earthquake on ancient and modern constructions. The damage assessment activity helped trace design indications in Italy's first seismic code in March 1909, i.e., less than three months from the 1908 earthquake. In this contest, the Ministerial Committee observed total or partial collapses of masonry buildings with no apparent seismic design, like iron or wooden ties connecting floors with walls, orthogonal walls, and masonry walls reinforced by steel wooden bracings (Case Baraccate). The Committee also observed that local detailing improved masonry buildings, as shown in Fig. (2a), where the roof prevented the collapse of the longitudinal walls of the masonry cathedral of Reggio Calabria.
On the contrary, the buildings with R.C. frames and floors showed good behaviour during the seismic event, with only minor damage to the finishing elements. As shown in Fig. (2b), the R.C. church in Favelloni (Vibo Valentia) did not experience any seismic damage.
Scientific studies conducted by [4] in the last decades on the seismic behaviour of masonry churches showed that the high vulnerability of these structures to an earthquake is due to many vibration modes, all characterized by small participation factors, generally less than 10%. In other words, as stated by [5], the dynamic behaviour of masonry churches is considerably different from the traditional buildings with box-type behaviour. Therefore, the local analysis of the constitutive macro-elements is generally performed instead of the global seismic analysis.
The current paper examines the historical cathedral of Reggio Calabria to assess the seismic behaviour of reinforced concrete churches. The framed structure of the R.C. church is then examined through a global analysis considering it a typical R.C. structure. A similar investigation has not been done or reported in the past, and because of its value as a cultural heritage, the outcome of this study can be very beneficial to local governments for possible retrofit schemes in the near future.
2. MATERIALS AND METHODS
2.1. The Case Study
In southern Italy, the cathedral of Reggio Calabria is the largest ecclesiastical building in the region of Calabria. It is located in the city's historic center and is raised by a wide staircase 10 meters above the Piazza del Duomo (Fig. 3a). It has a basilica plan, with three naves divided by columns and intersected by crosses that end with many apses, with a length of 93 meters and a width of 24 meters (Fig. 3). The weight of the roof is transferred to the R.C. columns through R.C. truss beams.
Fig. (4) shows the evolution of the cathedral in the centuries, testifying that it was repaired or completely rebuilt over the centuries. Its history is linked to different events of religious activities within the city. The cathedral's origins can be traced back to the beginning of the 2nd millennium. In 1061 actually, the Normans ordered the construction of a new cathedral under the order of the Pope of Rome. They built a Latin cathedral with a basilica plan, ending with a semi-circular apse (Fig. 4a). The construction had a peculiarity of southern Latin basilicas having a considerable length of the presbytery compared to the total length of the building. Documented information on the cathedral dates back to 1453 and 1477, when Archbishop Antonio De Ricci added a bell tower to the church. During the XVI century, like many buildings in the city, the church was sacked and burned by the raids of the Turks twice. After the fire of 1574, it was rebuilt and rededicated, and after the new fire of 1594, it experienced several restoration interventions. In 1741, the structure was rebuilt in the late Baroque style. A few decades later, the cathedral was damaged by the earthquake of 1783. Therefore, initially, it was necessary to demolish its facade. In 1790 the damaged structure was unsafe and was demolished. The reconstruction work started by Eng. Giovanni Battista Mori, and on 10 September 1796, the renovated cathedral was inaugurated (Fig. 4b). Following the earthquake of 1908, the façade and the upper part were damaged by the seismic shocks. The central and side aisles roof collapsed, while other parts suffered minor damage.


In 1913, Archbishop Rinaldo Rousset decided to rebuild the cathedral with the layout of (Fig. 4c), entrusting the task to the Carmelite father, Carmelo Umberto Angiolini. This was due to the decision to entirely rebuild the religious building by adapting to the new city reconstruction plan by Eng. De Nava. This was foreseeing the use of new materials and seismic design in 1917. Eng. Mariano Francescone made some changes to the project, and the Chini company completed the construction in 1928.
3. THE SEISMIC DESIGN OF THE CATHEDRAL
3.1. The Building Codes for the Zones Hit by the 1908 Earthquake
On 15 January 1909, just 18 days after the catastrophe, a Ministerial Committee was appointed to study and propose mandatory rules for repairs, reconstructions, and new constructions to be carried out in the earthquake regions. After visiting the devastated places, the Committee reported that the buildings formed with reinforced concrete walls and floors were the most suitable to withstand the forces that originate from earthquakes and, therefore, the most convenient against the effects of the earthquake. The Committee further proposed that structures should be constructed of wood and the frames from timber, iron, or reinforced concrete, linked together to resist all the seismic forces. In these cases, the mainframe had to be rigid, such as non-deformable systems. On the other hand, the walls had to be of bricks or stones laid in horizontal and regular layers with solid mortar.
The Ministerial Committee [6] also stated that the most important characteristic element of seismic excitation is acceleration because of the force of inertia with which every mass rigidly connected to the ground reacts proportionally. These forces constitute the dynamic stress caused by the shock, superimposed with the static stress caused by weight—taking into account that the amplitude of the oscillations caused by earthquakes in buildings increases from the lower to the upper floors. Therefore, to calculate horizontal forces relating to the upper floors, the characteristic ratio (seismic acceleration/gravity acceleration) was proposed to increase by 50%. In practice, horizontal forces representing the seismic effects were assumed, for the first time in an Italian technical code equal to:
- − 1/12 of the respective weights for the ground floor.
- − 1/8 for those on the upper floor and the entire height of buildings in general.
It was necessary to assume them to be equal to half their respective weights to increase the static actions by 50%, considering the vertical component of the seismic action. Therefore, the practical study of resistant systems in buildings under seismic actions was reduced to flat beams (each flat frame was considered a beam resistant to the forces defined above).
3.2. Design of the Cathedral: Assumptions and Structural Schemes Adopted by the Designers
The technical text “Il cemento Armato - Volume Secondo: applicazioni alle costruzioni civili e industriali” (The reinforced concrete - Second Volume: applications to civil and industrial constructions) by Prof. Luigi Santarella [7] reproduced the structural calculation and the technical drawings performed by the office of the Chini Company. The hypotheses for the analysis were:
- − Their axes replace the individual parts of the system;
- − The reinforcement is not considered in the calculation of the moments of inertia;
- − Deformations due to axial stresses and shear are neglected, which have a minimal influence compared to those due to bending moments;
- − Only the elastic deformation produced by the axial stress in the tie rod of the median span is considered;
- − In the seismic loading combination, the vertical loads are amplified by the seismic coefficient μ1 = 1.50;
- − The seismic coefficient for the wave of aftershocks, i.e., the horizontal-to-vertical load ratio, is assumed to equal μ 2 = 0.125.
The structure of the cathedral has two types of transverse portals, which differ in their shape and loads: the portal of the naves (appointed as type A portal in Fig. (5) and the transept portal (mentioned as type B portal in Fig. (6).
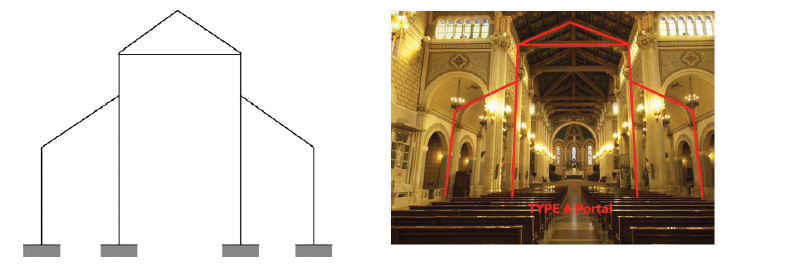
3.3. The Portal of the Naves (Type A)
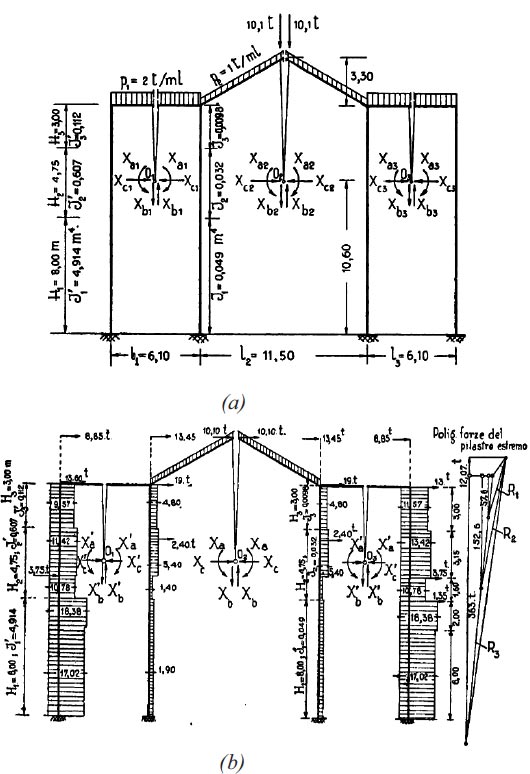
The portal type A of Fig. (5) has four columns fixed at the base: it consists of a continuous foundation 1.3 meters thick and about 7 meters deep, connected to the ground floor with a 1.0-meter thick reinforced concrete base. The three internal forces of the sections were chosen as hyperstatic quantities: bending moment Xai, vertical Xbi, and horizontal forces Xci (i=1, 2, 3). This way, three hyperstatic unknowns were obtained for each span, and the axial force Xh in the tie rod of the middle span was added for a total of ten hyperstatic unknowns. However, it was possible to reduce unknowns under the symmetry of shape and load. The structural analyses were performed through the force method. The equivalent statically determinate structure is shown in Fig. (7), where the designers consider the loading conditions for the structural calculation of the multi-spans cathedral frame - type A.
In detail, in Fig. (7a), the applied vertical loads are displayed.
In Fig. (7b), the horizontal design loads (in tons) due to the earthquakes are depicted; as already stated, the weights obtained from the masses were multiplied by the coefficient μ2 = 1/8 = 0.125, acting as horizontal loads and distributed in the same way as their masses.
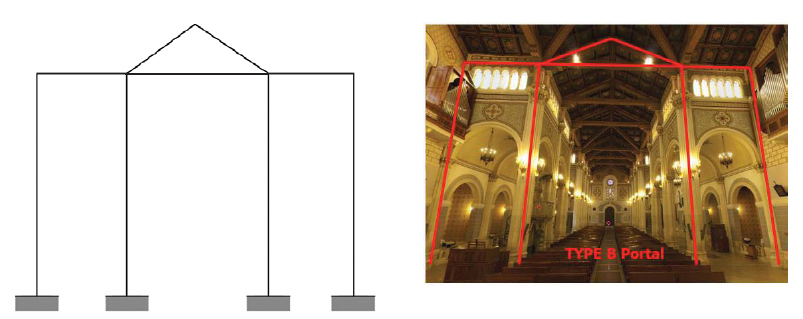
3.4. The Portal of the Transept (Type B)
The portal type B of (Fig. 6) is the intersection portal between the longitudinal and transverse naves, and it was calculated in the same way as the type A portal. The longitudinal wall that connects the upper part of the external column with the interior would produce a noticeable increase in resistance if adequately coupled to the columns. This effect was not analysed in the design process of the cathedral. The vertical and horizontal loading distribution adopted for the calculations of portal type B is shown in Fig. (8a) (gravity loads in tons) and 8b (horizontal static loads due to an earthquake in tons), respectively.
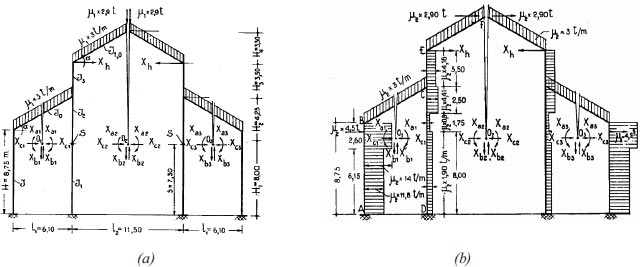
3.5. Reinforced Concrete Frames Details
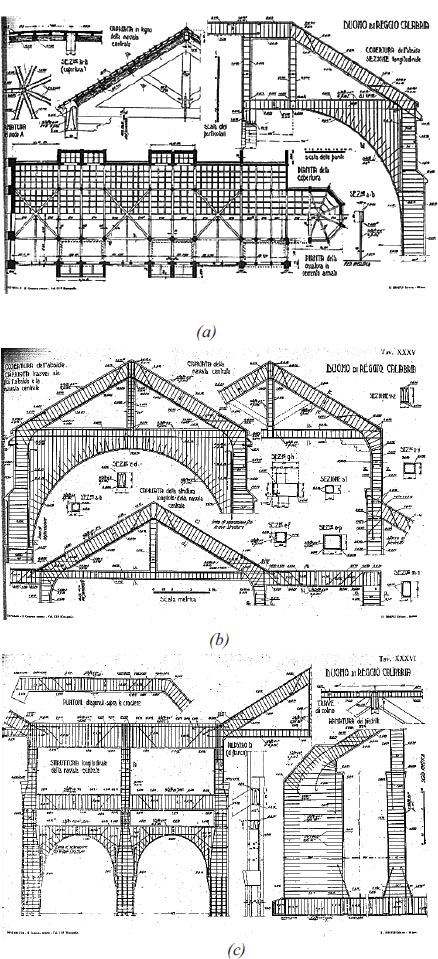
The following drawings proposed by Santarella in [7] are shown in Figs. (9a-c), where the reinforced concrete framework's plan and the roof details, the central nave's longitudinal structure, and the various sections used by the designers are reported. This information proved crucial for developing this work's numerical model (as seen later).
In detail, Fig. (9a) shows the carpentry, the details of the wooden roof trusses (in the upper left corner), and the longitudinal structural section of the apse covering (in the upper right corner).
In the upper left corner of (Fig. 9b), the transversal structural section of the apse covering is shown. In the upper right corner of (Fig. 9b), the structural drawing of portal type A is depicted. Finally, the structural details of portal type B are reported in the lower part of (Fig. 9b).
In Fig. (9c), the structural drawings of the longitudinal frames are shown. It can be observed the steel bars have been shaped in the arcade (on the left), as well as it is interesting to note the armor detail of the r.c. Buttresses (on the right).
4. NONLINEAR MODELLING AND ANALYSIS OF THE CATHEDRAL
4.1. Linear Analysis
The first step in modelling was to define the materials and the beam and column sections used during the construction phase. The existing code of that time [6] required concrete with a compressive strength of not less than 150 kg/cm2. For the reinforcements, on the other hand, plain steel was provided with a tensile strength of 3600 to 4500 kg/mm2. The self-weight of the reinforced concrete was assumed to be 2500kg/m3, while its modulus of elasticity was equal to 200t/cm2. Therefore, C12/15 concrete and plain steel bars were used with a yield stress of 2300kg/cm2 and tensile stress of 4200kg/cm2. Once the characteristics of concrete and steel were defined, sections were defined in the SAP2000 nonlinear platform [8]. After the grid was defined, frame elements representing beams and columns were drawn. The geometric dimensions of the sections and their reinforcements were defined based on the structural drawings in Fig. (9). For homogeneity, some approximations were made:
- − A constant section of 200 Х 200 cm was assumed for the four columns of the façade;
- − We assume the section of the columns equal to 380 × 76 cm;
- − The sections of the generic column of the central nave are assumed to be 76 × 76 cm;
- − In the absence of specific information, the sections and reinforcements are homogenized to have a structure consistent with the structural design conceived.
In addition to the vertical loads, deriving from the self-weight and the permanent loads, conventional horizontal forces equivalent to the seismic actions were applied to the frame elements, as shown in Figs. (7 and 8). Accidental torsional effects were ignored. The constraints at the base of all the columns are modelled as fixed.
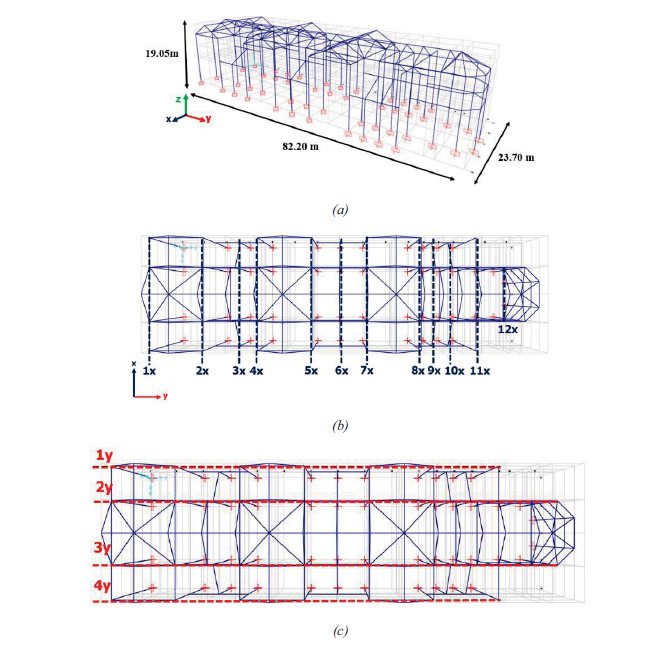
A view of the overall three-dimensional model of the cathedral of Reggio Calabria is shown in Fig. (10). In detail, a 3-D view of the F.E. model is shown in Fig. (10a), while the frames in the transverse direction (x-direction) and the longitudinal direction (y-direction) are shown in Figs. (10b and c), respectively. The presence of 12 transverse frames (1x, 2x, …, 12x) and 4 longitudinal frames (appointed as 1y, 2y, …, 4y) can be observed. Regarding the transverse direction, four type A portals, seven type B portals, and a simple cathedral frame with a tie rod in the apse area (frame 12x)
4.2. Modal Analysis
Modal analysis was a fundamental tool for assessing a structure's dynamic behaviour. This provides beneficial information regarding the structure's response to dynamic forces in the elastic range. In general, this analysis makes it possible to analyse the following representative quantities:
- − The periods of vibration Ti;
- − The value of the participating masses corresponding to the various modes;
- − The participation coefficients of the individual modes.
To correctly perform modal analysis, the lateral stiffness of the structure (through the modelling of the structural elements and the related internal and external constraints) and its mass (through the insertion of loads or masses adequately represent the actual mass distribution within the building) must have been fully defined. It is of fundamental importance to note that it is impossible to consider the presence of a rigid diaphragm since no diaphragm was physically present in the case under consideration.

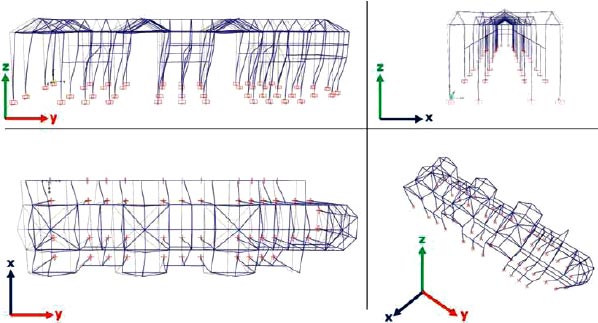
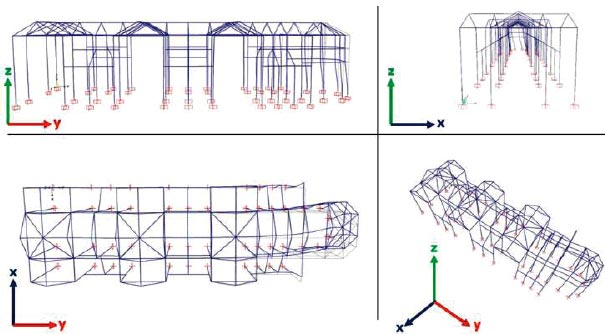
Figs. (11-13) represent the vibration modes in the three planes to present effective information. The modal deformations, the participating masses in the two directions, and the rotational mass are also indicated. In more detail, each figure is divided into four squares. The upper left square refers to the y-z plane, i.e., to the modal deformations in the longitudinal direction. The upper right square shows the modal deformations in the transversal direction (x-z plane). The lower left square refers to the horizontal x-y plane, i.e., to the modal deformations viewed from the top. The lower right square shows a 3-D view of the vibration mode shape.
From the analysis of the modal deformations, it is possible to note that the first mode, as shown in Fig. (11), has a period of 0.47 seconds and a participating mass in the y-direction of 84%. On the other hand, the second and third modes (Figs. 12 and 13) have a strong coupling of translation and rotation. Specifically, the participant mass Rz of the second mode is equal to 49% coupled to a translational mass along the x-axis equals 20%. The second mode is also local, with a rotation of the apse area. Instead, the participating mass Rz drops to 35% in the third mode while the translational mass along the x-axis drops to 14%. The torsional deformations of the entire model show a low torsional stiffness of the building, resulting from the lack of adequate connection between longitudinal and transverse elements. From the periods, it is possible to underline that they are very low, which indicates that the structure is generally very rigid, especially in the transverse direction.
It should be noted that the accuracy of the above results modal analysis is affected by the actual values of the concrete Young modulus, by the effective inertia moment of the r.c. beams and columns, and by the contribution of the infilling walls to the lateral stiffener of the church. Therefore, the availability of dynamic characterization of the Duomo di Reggio Calabria could be useful for a more accurate calibration for the FEM numerical model, but no data are now available to the authors. Furthermore, the modal (linear) analysis cannot capture nonlinear phenomena that involve the stiffness variation of structural elements (such as the stiffness due to the cracking of concrete). Studying the structure's dynamic behaviour is necessary to use the reduced modulus of elasticity (as required by various technical codes) or conduct a more detailed modelling and nonlinear analysis when considering these phenomena. Therefore, modal analysis cannot capture nonlinear phenomena that involve the stiffness variation of structural elements (such as the stiffness variation due to the cracking of the concrete in the reinforced concrete sections).
4.3. Nonlinear Analysis
The importance and need to consider the plastic field response require numerical software tools to perform the non-linearity of the materials involved in the structure. Currently available numerical tools can do this using two different approaches: modelling using plastic hinges with “concentrated” plasticity or modelling fibres with “diffuse” plasticity. In this work, only concentrated plasticity modelling was used. This was the first modelling technique implemented in structural analysis programs to describe the inelastic behaviour under the earthquake's action. It provides that all the elements making up the structure always remain in the elastic range. They are introduced at the ends with hinge elements having inelastic behaviour where the plastic hinge formation is foreseen. Therefore, the non-linearity of the structure remains concentrated in a few elements. The characteristic curve of a plastic hinge is not uniquely defined but depends on:
(i) ts position in the structure,
(ii) the behaviour of the single structural element, and
(iii) on the global one.
The codes often provide a comprehensive library of constitutive bonds depending on the considered case. The advantage of this modelling was that it works mainly with easily manageable elastic elements, leaving the concentration of the material's non-linearity to a few locations in the structure. This modelling limitation requires operator experience to determine where to distribute the nonlinear elements. The beam element's yielding was assumed to be strictly localized in the region where the plastic hinge is formed, which was formed when the bending moment in the considered point reaches the ultimate moment. Outside the zone in which the hinge is formed, the hypothesis was made on the purely elastic behaviour of the element. The hinges can be assigned to a frame element in any position along the free span of the member per FEMA 356 standards [9]. In this type of plastic hinge, the constitutive law is fixed by measuring, as deformation, the rotation of the member about the chord, for example, a beam of a frame. The chord was represented by the undeformed length of the beam itself and applied an increasing deformation to it. Under this hypothesis, the moment-rotation law can be linearised. The hinges were assigned to the ends of beams and columns in the case under consideration, using a hard-hardening plastic rigid bond starting from a hardening elastic-plastic constitutive bond.
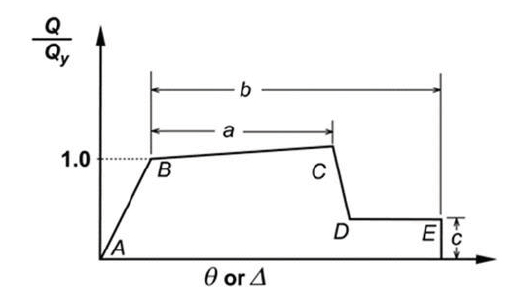
Fig. (14) shows the plastic hinge property suggested by FEMA 356 Standard [9], and the linear response is described between points A and B. The slope from B to C is typically a small percentage of the elastic slope (from 0 to 10%), necessary to represent the hardening phenomenon. Point C has an ordinate that expresses the resistance and an abscissa value equal to the deformation at which a significant resistance degradation begins. After this point, there is a local rupture. The section still carries some load, but it is defined as loss of resistance, ranging from C to D. The resistance has remained at low values, defined as residual resistance (value c of the graph). Continuing to rotate the hinge again, the value marked with the letter E, actual collapse, is reached. In SAP2000 [8], through the command “Drops to zero,” a loss of resistance is attributed to the hinge beyond point E. The sudden loss of resistance is often unrealistic and could be very difficult to analyze. The program automatically limits the negative slope of a hinge to be no more rigid than 10% of the elastic stiffness of the element containing the hinge itself to reach convergence. The data a, b and c in Fig. (14) are the model parameters of the plastic hinge. They represent the actual input data of the hinge itself: in fact, they set its behavioural law. There are several methods of obtaining similar behavioural data of such a hinge. For a beam, these data depend on three discriminants: reinforcement ratios, the spacing of the stirrups, and over-resistance of the shear. For a column, the ratio is similar, but the first discriminating factor is the presence and extent of axial stress, and also, the state of compression reduces the ductility of a reinforced concrete section.
The behavioural law of a hinge of this type can be traced automatically by SAP2000 [8] per the FEMA 356 and ASCE 41 [8, 10]. Therefore, M flexural hinges were automatically assigned to all beams and P-M2-M3 hinges to all columns.
As an example, consider a generic reinforced concrete beam. The ductility of the same depends on the three discriminants:
- − The program checks the upper and lower reinforcement present in the frame. This can be passed directly (as has been done in this model by inserting the actual reinforcements taken from the tables of Santarella [7]) or deduced from an automatic design. From the reinforcement, the ratio of tension reinforcement ρ and that of compression reinforcement ρ' is determined;
- − The program then requires if the spacing of the stirrups complies with the recommendations (lower than d/3, with d the effective height of the section) or non-compliance (higher than d/3) and from which analysis to take the cut V with which to calculate the third discriminant;
- − The first three discriminants have been computed from FEMA-356 tables, interpolating them and obtaining the definition of a, b and c as design parameters of the hinge (Fig. 14). These, together with the automatically calculated positive and negative moment of resistance, represent the definition of behavioural law.
Naturally, an utterly similar procedure is followed for the columns. Once the plastic hinges have been defined and assigned to the beams and columns of the frames, then the definition of the nonlinear static analysis is required.
4.4. Nonlinear Analysis in the Longitudinal Direction
Nonlinear static analysis is a procedure used to determine the behaviour of a structure against an applied action. The analysis consists of applying the gravitational and horizontal forces, which are scaled, keeping the relative ratios unchanged. The horizontal displacement of a control point increases monotonously until the conditions are reached. Finally (the structure is “pushed” until it collapses, or a particular deformation control parameter reaches a fixed limit value). The typical product of a pushover analysis is a force-displacement scalar link called a capacity curve, which summarizes the response of the entire structure with two parameters: one of force and one of displacement.
This curve is defined without reference to the seismic action, thus representing the structure's performance regardless of the actual seismic demand. In the specific case of architectural heritage, the variety of geometries and constraints makes it impossible to define the characteristics of a distribution of static forces equivalent to the earthquake initially [11].
According to the Italian technical code [12], the analysis can be performed considering two distributions of forces:
- − Distribution of forces proportional to the masses;
- − Distribution of forces proportional to the principal mode of vibration in the direction of analysis.
Once the force distributions have been defined, the control point must be chosen. The choice of a single control point in the structure under consideration and, in general, in ecclesiastical buildings would not make sense without the diaphragm. Therefore, it is decided to first consider a control point for each of the four frames parallel to the y-direction.
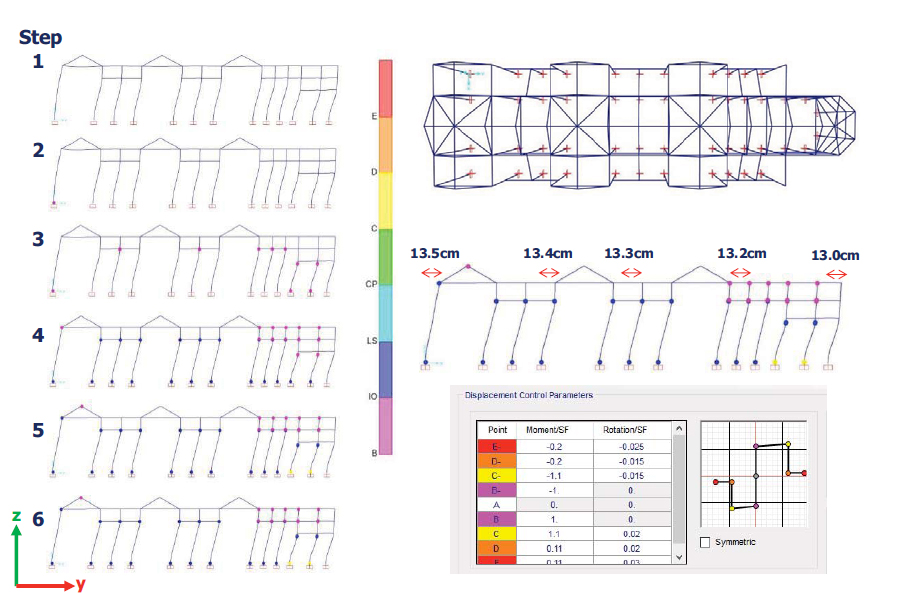
Different steps of the pushover of longitudinal frames with their maximum displacements are shown in Fig. (15). In particular,
The deformed shape of the longitudinal frames, with the plastic hinges, activated at steps 1-6 are shown in Fig. (15) (on the left), while the collapse mechanism with maximum displacements is shown in Fig. (15) (on the right) together with the displacement control parameters od plastic hinges as given by SAP2000.
- − F is the shear at the overall base of the structure expressed in kN;
- − W is the weight of the building expressed in kN;
- − δ is the horizontal displacement of the control point in question expressed in cm;
- − H is the height of the control point above the ground.
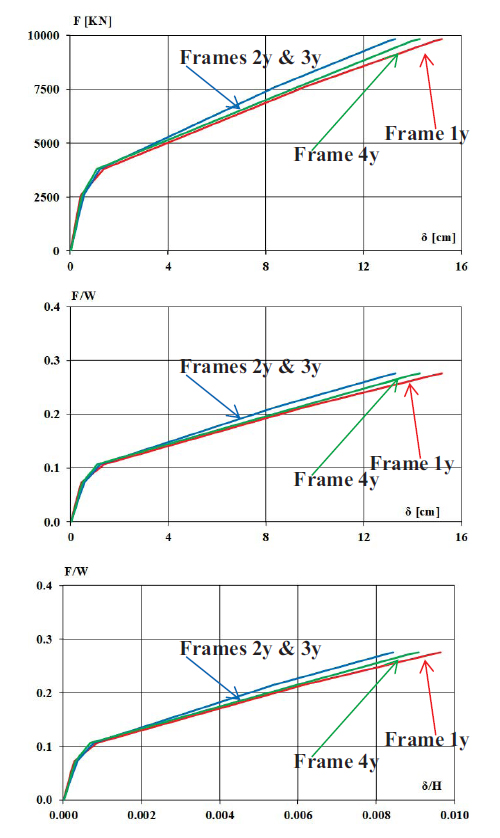
Fig. (16) shows the capacity curves obtained in the F- plans δ, F / W-δ, and F / W- δ / H for the four longitudinal frames where:
By evaluating the results obtained and analysing the collapse mechanisms in the longitudinal direction, it is possible to consider the displacement of any node of the generic frame as representative of the displacement of the frame itself. Moreover, since the capacity curves are very similar regardless of the chosen frame, it is possible to consider the behaviour of the single frame as representative of that of the entire structure.
Therefore, in the y-direction, a global behaviour is considered even without the rigid diaphragm. It can be assumed that the plane behaviour coincides with the three-dimensional one. This assumption is possible due to numerous connecting beams, which give a monolithic behaviour in the longitudinal direction.
4.5. Nonlinear Analysis in the Transverse Direction
As for the analysis in the transverse direction is concerned, the case is certainly different. If in the y-direction, it was possible to approximate the plane behaviour to the three-dimensional one, thus carrying out a global study of the structure, in this case, each of the individual transverse frames must be considered separately from the others. From the analysis, it is clear that while the frames of the apsidal area are more deformable, this cannot be said for the others, considerably stiffened by the columns and larger dimensions of the members. As shown in Fig. (17), the capacity curves obtained in this case differ for each frame. While in the previous case, the base shear was the same for each frame. The base shear changes for the 12th frame are entirely different in the transverse direction, and independent pushover curves represent the transverse frames' behaviour. In the following diagrams, the capacity curves obtained in the F-δ (Fig. 17a), F / W- δ (Fig. 17b), and F / W- δ / H planes (Fig. 17c) are compared; where:
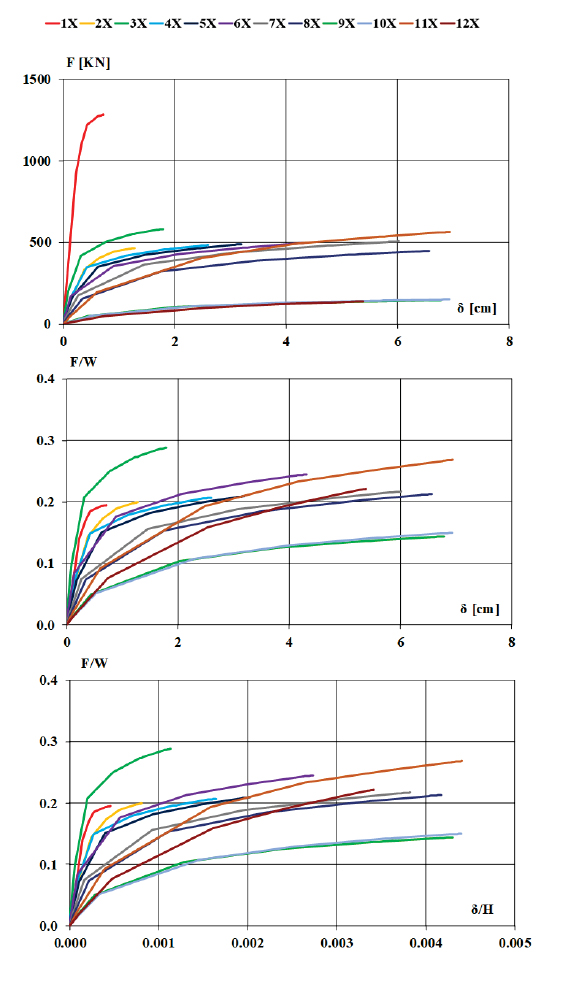
- − F is the base shear of the ith frame considered expressed in kN;
- − W is the weight of the ith frame deemed to be expressed in kN;
- − δ is the horizontal displacement of the control point of the ith frame considered, expressed in cm;
- − H is the height from the ground of the control point of the ith frame.
By evaluating the results and analysing the collapse mechanisms in the transverse direction, it is possible to assume the displacement of any node of the generic frame as it can represent the displacement of the frame itself.
In other words, the examined church has not had a box-type behaviour along the transverse direction. Ultimately, global behaviour is apparent only along the longitudinal direction from the two directions' pushover analysis on the cathedral. In fact, in this direction, even in the absence of a rigid diaphragm, it is possible to approximate the behaviour of the single plane frame to that of the entire three-dimensional structure using a single capacity curve, regardless of the control point chosen. Along the transverse direction, however, this assumption is not allowed. Therefore, according to [13, 14], it is necessary to consider a different capacity curve for each frame.
5. RESULTS AND DISCUSSION
5.1. Evaluation of the Seismic Vulnerability of the Cathedral
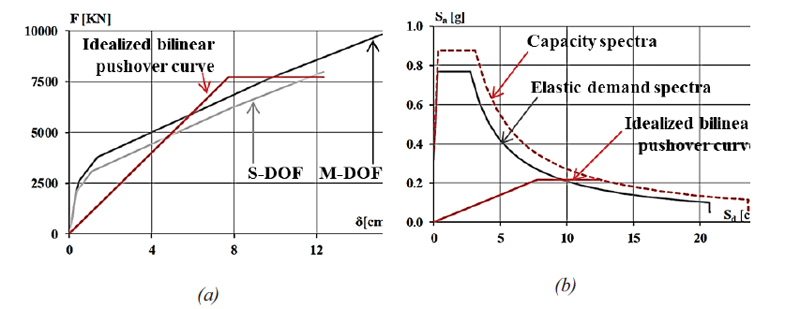
The N2 method proposed by Fajfar for the first time in 1988 [15, 16] is used to determine the seismic demand in terms of displacement. The name of the method summarizes its two distinct aspects. The abbreviation N2 indicates that the method is nonlinear (N) and uses “2” models for calculating the structure (the MDOF and SDOF models). Based on the Reggio Calabria seismic hazard parameters, it is possible to construct the ADRS spectrum with displacement values as abscissa and acceleration values as ordinate (Fig. 18).
The concept of a risk indicator is used to evaluate the seismic safety of a building. This indicator can be expressed in terms of accelerations (ζE). On the other hand, if it assumes the value ζE = 0, it means that the structure cannot withstand any seismic action. If indicator ζE assumes a value greater than 1, the building fully satisfies the resistance to seismic action.
5.2. Seismic Vulnerability in the Transverse Direction
In this case, it is impossible to consider a global behaviour or rigorously apply the N2 method. Therefore, each frame is studied separately, considering a distribution of horizontal forces proportional to the masses. Since the frames are all comparable to the frames type A and type B analysed in sections 4.4 and 4.5, the type A-frame is modelled as two degrees of freedom system and the type B frame as a single degree of freedom system:
In a very simplified way, remember that the modal participation coefficient Γ is defined as:
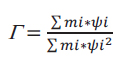 |
(1) |
where ψi represents the normalized modal displacement given by the ratio between the displacement at the generic height and the displacement at the top. If the identical masses are assumed, it is possible to consider with good approximation Γ equal to 1 in the case of portal type B and a Γ between 1.05 and 1.12 in the case of portal type A. The obtained capacity curves are plotted directly in the acceleration-displacement plane to have a rough idea of the structural safety in the transverse direction. In this case, the ordinates have been scaled by the weight of the relative frame to be compatible with the spectral ordinates. The structure is certainly more vulnerable in the transverse direction than in the longitudinal direction, regardless of the accuracy of the calculations performed. It can be noted that some frames have higher strength reserves than others: in particular, frames from 1y to 4y are more vulnerable than others.
5.3. Seismic Vulnerability in the Longitudinal Direction
As highlighted in section 4.5, pushover analysis results in this direction are almost identical regardless of the type of frame and the distribution of horizontal forces chosen. Therefore, the global behaviour of the structure is considered, and the N2 method is strictly applied.
Note that the ordinates have been scaled for the weight of the building to be compatible with the spectral ordinates. Therefore, in the longitudinal direction, it is possible to state that the structure collapses for a PGA of 0.33g (the capacity spectra in Fig. 18b), associated with a return period of 762 years.
5.4. Seismic Capacity VS Seismic Demand of the 16 January 1975
Since the construction of the Duomo (1928), the structure has faced various earthquakes. Based on Code provisions, the results obtained up to this point have been compared with reality. After having identified the earthquakes that have occurred in the city of Reggio Calabria from the construction of the cathedral to the present day, the same analysis developed in the previous paragraphs was carried out considering the strongest earthquake that hit the structure, or the 1975 earthquake (see the circle in Fig. 1).
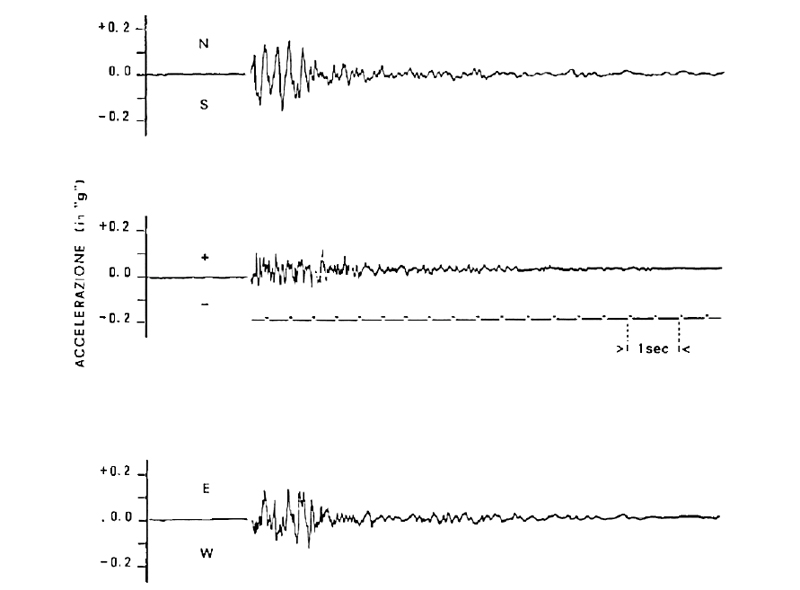
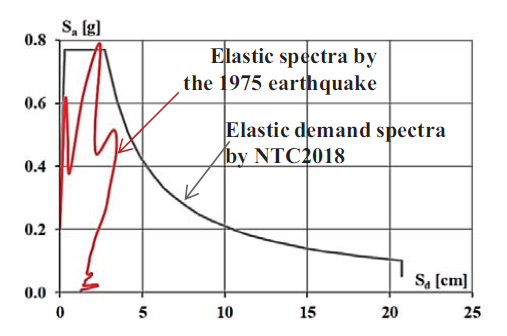
As reported in [17], this earthquake was the strongest earthquake suffered by Reggio Calabria after the catastrophe of 28 December 1908 due to the importance of microseismical phenomena (Is = 7-8). The damage produced by the earthquake can be summarized in severe conditions of panic among the population, with the loss of six human lives and widespread damage to the building heritage of the city and smaller towns. The accelerograms of the 1975 earthquake, given by [17] and shown in Fig. (19), were used to obtain the elastic spectra in terms of accelerations, then plotted on the A.D. plane to obtain the ADRS.
Once the Acceleration Displacement Response Spectrum of the actual earthquake is known, a comparison is made that can be seen in the previous sections (Fig. 18). It is possible to immediately see that the abscissa values of the actual ADRS are much lower than those of the standard ADRS. In contrast, the ordinate values are undoubtedly comparable (Fig. 20). Comparing the results obtained in a transverse direction with the original one makes it possible to observe a substantial improvement in the capacity/demand ratios.
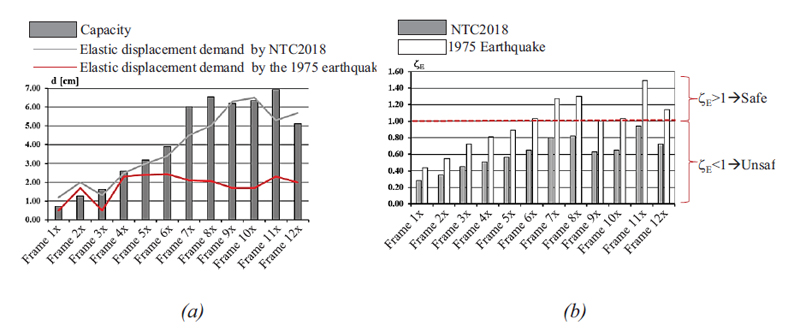
Based on the ADRS of the 1975 earthquake, it can be seen that the required displacement is drastically lowered, allowing a consequent increase in the capacity/demand ratio and the risk index values of up to 60%. Observing the acceleration ratios ζΕ (Fig. 21), the 6-12x frames show excellent behaviour, with ratios greater than the unit. The 1-5x frames, on the other hand, are still vulnerable, even with much higher values than those obtained using the Italian code elastic spectra.
CONCLUSION
Earthquakes are one of the most serious threats to historical-architectural legacy, particularly church buildings, distinguished by large halls, slender walls, and thrusting features with long spans (arches, vaults, domes), owing to the lack of solid diaphragms.
The analysis of the seismic damages suffered by masonry churches during previous Italian earthquakes demonstrated how their seismic behavior could be analyzed by decomposing them into architectural-structural portions (the so-called macro-elements), which have structural behavior substantially independent of the entire church building. As a result, masonry churches can be seismically assessed by separately analyzing the nonlinear range up to the collapse of each macro-element with two-dimensional models.
A 3D model appears acceptable for undertaking linear or nonlinear studies of R.C. structures of ordinary buildings in the case of R.C. churches, which are characterized by material homogeneity and rigid connections between the constituting structural elements.
The seismic vulnerability of the cathedral of Reggio Calabria, an ecclesiastical building constructed in reinforced concrete at the turn of the century, was studied in this work. There appear to be no vulnerability issues along the longitudinal direction because the seismic capacity in terms of displacements is greater than the seismic demand for each of the two horizontal force distributions evaluated in the analyses. Furthermore, the seismic risk indices are assumed to have values greater than one.
The overall behavior of the building cannot be examined in the transverse direction. As a result, the structure's susceptibility is linked to the single transverse frame. In this direction, the risk indices assume values less than unity for each frame considered: the seismic capacity of the 1x, 2x, 3x, and 4x frames is half of what the Italian technical code requires. However, when these results are compared to those produced by considering the church's most severe earthquake on January 16, 1975, the capacity/demand ratios and risk indices show a significant improvement.
It observed how the fundamental notions of seismic analysis had existed since the turn of the century (linear elastic behaviour for weak earthquakes, nonlinear behaviour for stronger earthquakes, use of static forces to simulate the effects of real dynamic behaviour). Despite its vulnerability in the transverse direction, the cathedral provided an entirely satisfactory response to an actual earthquake with a peak ground acceleration of 0.2g, indicating that the structural analyst should not blindly trust the code provisions but, on a case-by-case basis, critically analyze the obtained results, using engineering judgment for the final issue about the seismic vulnerability of the examined existing structure.
LIST OF ABBREVIATIONS
| H | = Height |
| W | = Weight |
| F | = shear |
| N | = Nonlinear |
| ADRS | = Acceleration Displacement Response Spectrum |
CONSENT FOR PUBLICATION
Not applicable.
AVAILABILITY OF DATA AND MATERIALS
The data supporting this study's findings are available within the article.
FUNDING
The support provided by consortium ReLUIS is acknowledged. The activities are related to the topics of WP2 “INVENTARIO DELLE TIPOLOGIE STRUTTURALI ED EDILIZIE ESISTENTI - CARTIS” included in the project DPC-ReLUIS 2022-2024.
CONFLICT OF INTEREST
The authors declare that they have no known competing financial interests or personal relationships that could have appeared to influence the work reported in this paper.
ACKNOWLEDGEMENTS
The authors gratefully acknowledge Eng. Anton Giulio Conte for his precious contribution to the structural analyses discussed in this study.

