All published articles of this journal are available on ScienceDirect.

Environmental Flow Assessment Using Low-flow Index Method in Upper Citarum River Basin, West Java, Indonesia
Authors Info & Affiliations
Abstract
Aims:
This research aimed to determine the amount of environmental flow (EF) required to sustain the river’s function in supporting ecological balance.
Backgrounds:
In Indonesia, the Citarum area usually experiences significant environmental challenges, including the overflow of the Citarum River and its watersheds, which causes flooding, and lack of water during the dry season. However, the major challenge is the availability of water in Citarum, attributed to the discharge affecting the ecological balance of the watersheds
Methods:
A review of EF was conducted by comparing 7Q10 and Q95 from both the Nanjung discharge observation data and the rainfall-runoff modeling.
Results:
The results found that the Weibull minima method, the 7Q10 result for Sacramento modeling, was 2.18 m3/s while the Nanjung AWLR was 1.24 m3/s. Additionally, the value of Q95 for Nanjung AWLR was 7.17 m3/s, while the result of modeling rainfall-runoff was 7.06 m3/s.
Conclusions:
It is necessary to ensure that the amount of discharge available can support the ecological conditions in the Upper Citarum River Basin area. This was relevant since the difference was certainly affecting the ecological balance and the management of the Citarum River.
1. INTRODUCTION
Every year, the Upper Citarum experiences significant environmental challenges, including the overflow of the Citarum River and its watersheds which cause flooding, lack of water during the dry season, and increased temperature due to global warming [1]. The complexity of these problems drew attention from many stakeholders, including the Indonesian government, thus, prompting the issuance of the Presidential Decree no. 15 of 2018 regarding the Acceleration of Pollution Control and Damage of Citarum River Basin [2] motivated by the Upper Citarum River drought, which affects the surrounding watersheds. Although research on low flow have been widely conducted across the globe, only a few pieces of research have been conducted in Indonesia and the Citarum Basin, to be precise. Today, only one publication has discussed the decreasing low flow trend of the Upper Citarum River Basin (UCRB) based on simulation results due to climate change [3], this issue certainly needs to be investigated further, especially in terms of low discharge hydrological changes. Thus, there is a need for river flow changes to be balanced with the preservation of water-dependent ecological services [4]. In Indonesia, there is no classification for Q95 for rivers upstream, middle, downstream, and rivers with reservoirs and no reservoirs.
Ecological conditions in the Citarum River show a decrease in the number of endemic fish species, and the degradation and loss of fish habitat are mainly influenced by anthropogenic factors. One of them is the flow alteration of the Citarum River Dam, including the construction of reservoirs will have an impact on changing the habitat of flowing water into stagnant waters [5]. Where so far in river management in Indonesia refers to Q95 for river maintenance discharge which aims to maintain environmental sustainability [6]. This study will test whether the practice of determining the discharge of river maintenance that is commonly carried out in Indonesia is sufficient to ensure the sustainability of the ecosystem and the environment.
Environmental Flow Assessment methods that are widely developed include methods using a hydrological approach, this implementation is used in Mexico to determine water allocation [7], as used in Malaysia by reviewing Flow Duration Curve and EMC for tropical rivers [8], in Iran [9] also carried out a comparison of the method with the hydrology approach to analyze EF, and also in Nepal as a guideline to allocate EF in Kaligandaki River [10]. The hydrological approach is still developing today because it is simpler and the results can be used as a valid reference for managing water allocation, as shown in the several publications mentioned earlier. Because the scope of research is limited to a hydrological approach, data and discussions related to quality are not discussed in this article. In the rainfall runoff modeling section of this study, the contribution of groundwater in determining the amount of surface water is assumed to be very small, referring to the publication [11] where the contribution of groundwater to the Citarum river, especially in the Upper Citarum watershed, is 0 to a maximum of 9,872 m3 per day in the wet season.
The low-flow index is interpreted with the help of a 7-day simulation data with a 10-year return period (7Q10), applying everyday discharge information of the investigated river. The 7Q10 flow is the second most broadly applied hydrological method for the Environmental Flow (EF) evaluation, as evidenced by other research [12]. Research related to low environmental discharge using the 7Q10 method is being carried out in several countries, including India [13], Malaysia [14], the US [15], and China [16]. Another familiar hydrology-based method used in its usual form was the Flow Duration Curve Analysis (FDCA) method. Smakhtin [17] showed that a low-flow range design of an FDC ranged between 70 and 99% (symbolized as Q70 and Q99%, respectively). The Q90 and Q95% were usually applied as low flow signs to set minimum EFs [18-20]. The research objective was to carry out an EFs desktop assessment using the Low-Flow Index Method in the Upper Citarum River Basin, West Java, Indonesia. The potential EFs from the observation data and rainfall-runoff model in the river were evaluated using a low-flow index determined as a 7-day low flow with a 10-year return period (7Q10). FDCA modeling and calculations were limited to watersheds without reservoirs.
This method was chosen because it is relatively simple and allows it to be carried out in a short time and produces a value that can be used as a valid reference for determining the amount of environmental flow in the framework of water resource management. This is important to support the Acceleration of Pollution Control and Damage of Citarum River Basin, especially to ensure the availability of EF and test the amount of environmental discharge that has been commonly used in Indonesia.
2. MATERIALS AND METHODS
2.1. Research Area
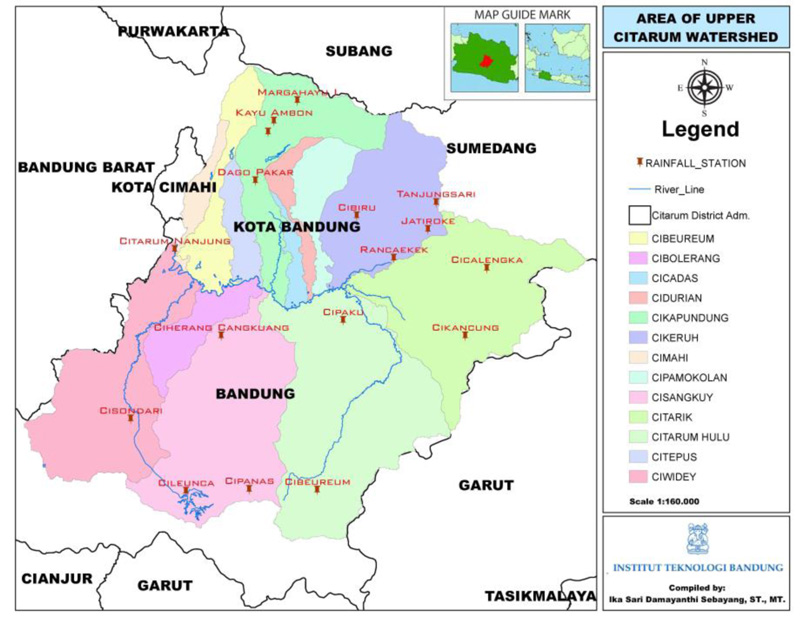
The Upper Citarum River Basin geographical location is 107° 15' 46.27”-107° 57' 1.99” East Longitude and 6° 43' 8.65”-7° 14' 32.09” South Latitude. The UCRB has a total watershed area of 1,810 km2 consisting of six main sub-basins, including the Cikapundung, Cikeruh, Citarik, Cirasea, Cisangkuy, and Ciwidey sub-basin [21] (Fig. 1). The rainfall-runoff modeling was conducted using data from 16 rainfall recording stations within the watershed, and the Thiessen method was used to calculate the rainfall area as in Fig. (1). The recording discharge data was taken from the Citarum-Nanjung Station because it covers the entire UCRB.
| S. No | Station | Coefficient | S. No | Station | Coefficient |
|---|---|---|---|---|---|
| 1 | Kayu Ambon | 0.018 | 9 | Dago Pakar | 0.066 |
| 2 | Ciherang Cangkuang | 0.143 | 10 | Rancaekek | 0.035 |
| 3 | Jatiroke | 0.019 | 11 | Margahayu I | 0.038 |
| 4 | Cibeureum | 0.094 | 12 | Cipaku | 0.108 |
| 5 | Cipanas | 0.046 | 13 | Tanjungsari | 0.036 |
| 6 | Cisondari | 0.122 | 14 | Cibiru | 0.067 |
| 7 | Cileunca | 0.044 | 15 | Cikancung | 0.084 |
| 8 | Lembang Meteorologi | 0.022 | 16 | Cicalengka | 0.058 |
2.2. Data Collection
A conceptual rainfall-runoff model was carried out apart from making a hydrological analysis for environmental flow from the discharge recording data. Modeling was performed using Sacramento methods, and the results were compared to those from observation data analysis to identify the significance of differences in low flow on the model and the observed data. The observational discharge data, rainfall data, and climatology for modeling had the same evaluation period from 2008-2019. Regional rainfall was calculated using the Thiessen method to compare areas, as presented in Table 1.
2.3. Sacramento Method
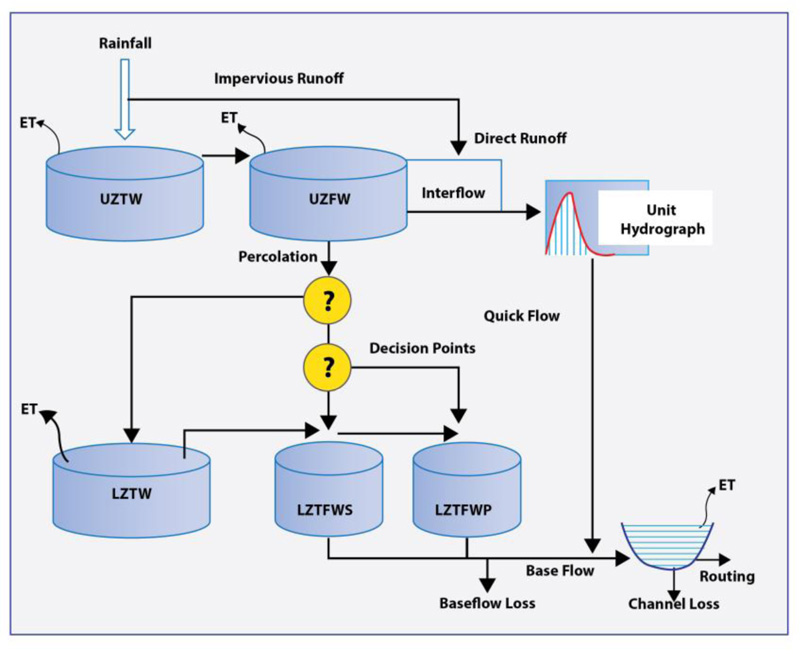
Results obtained from Nanjung gauge stations (the simulated discharge) were validated using observation data. Nanjung gauge station was chosen because it was considered to represent UCRB, and it is located downstream from Cikapundung, Cikeruh, Citarik, Cirasea, Cisangkuy, and Ciwidey sub-basin. The parameters used in the Sacramento modeling are described in Fig. (2).
2.4. Nash Sutcliffe Efficiency
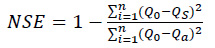
Model calibration was conducted by comparing the modeling results with the observed data. According to Nash-Sutcliffe [23], the method for determining the model calibration criteria on the field observations results was as follows:
 |
(1) |
Where EI = efficiency index; Q0 = Discharge measurement (observation); Qs = Simulation discharge; and Qa = Average measurement discharge. The EI value, according to the Nash method, is divided into 3 categories, namely:
(a) Very satisfactory/good category, if EI > 0.75
(b) The category is quite satisfactory/good enough, if 0.36 < EI < 0.75
(c) Unsatisfactory category, if EI < 0.36
2.5. Gumbel Distribution for Minima
The Gumbelmin distribution was applied, even though not constantly, as an extremal distribution for modeling annual minima of drought-related variables, including the Q7, the lowest mean discharge of 7 consecutive days in a provided year [21]. The cumulative distribution function for the Gumbelmin was:
 |
(2) |
where α symbolizes the scale parameter and β the location parameter. Analogously to the Gumbelmax, β is, actually, the Z mode. The possibility density function of the Gumbelmin distribution was performed by:
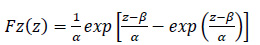 |
(3) |
The mean, variance, and skewness coefficient of a Gumbelmin variate were respectively performed as:
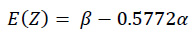 |
(4) |
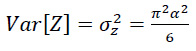 |
(5) |
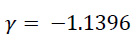 |
(6) |
The Gumbelmin distribution was skewed to the left with a set coefficient of
The Gumbelmin quantile function was expressed as:
 |
(7) |
T denoted the return period in years, and F represented the annual non-exceedance possibility [24]. For annual minimal, the return period was the reciprocal of
2.6. Weibull Distribution for Minima
The Extreme-Value type III (EV3) distribution for minima was also related to Weibullmin. Since low flows were surely defined by zero in almost severe cases, its distribution was a normal candidate to model hydrologic minima [24-26]. If low-flows were lower-bounded by zero, the EV3 distribution tended to the two-parameter Weibullmin. Meanwhile, if low-flows were lower-bounded by some value ξ, the EV3 distribution tended to the three-parameter Weibullmin [24].
The cumulative distribution function for the two-parameter Weibullmin was presented by:
 |
(8) |
where β and α were scale and shape parameters, respectively. If α ¼ 1, the Weibullmin became the one-parameter exponential distribution with scale parameter β. The possibility density function of the two-parameter Weibullmin distribution was represented as Continuous Random Variables: Probability Distribution [24].
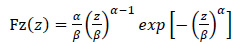 |
(9) |
The mean and variance of a two-parameter Weibullmin variate were, respectively, given by:
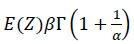 |
(10) |
and
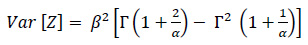 |
(11) |
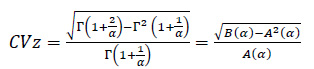
The variation and skewness coefficients of a two-parameter Weibullmin variate were, respectively:
 |
(12) |
and
 |
(13) |
Estimation of parameters and possibilities for the two-parameter Weibullmin distribution was accomplished by first solving Eq. (14) for α, either through a numerical iterations' procedure comparable to the one applied to measure the GEV shape parameter or by tabulating (or regressing) potential values of α and the auxiliary function
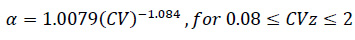 |
(14) |
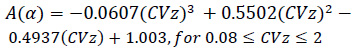 |
(15) |
which provide good approximations to the numerical solution of Eq. (15). Once α and A(α) have been identified, parameter β can be estimated from Eq. (16), or:
 |
(16) |
With both parameters identified, the two-parameter Weibullmin quantiles are determined at:
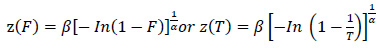 |
(17) |
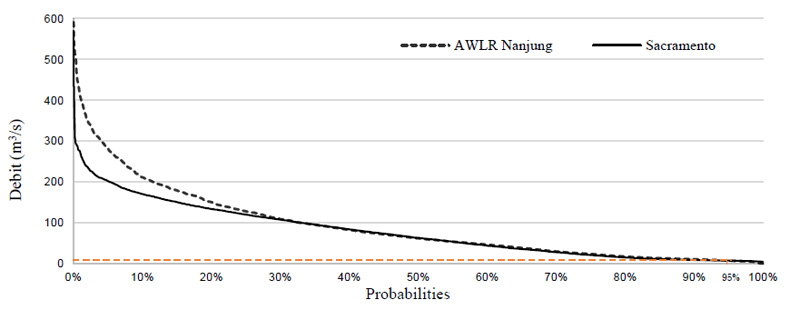
2.7. Flow Duration Curve Analysis (FDCA)
Another familiar hydrology-based methodology used universally in its usual form is the FDCA method [17]. In this research, the FDCA was used to investigate the probability distribution of recorded data where it (data) was ranked and its corresponding probability calculated by using the following equation:
Smakhtin (2001) characterized that the design low-flow range of an FDC was between 70 and 99% (Symbolized as Q70 and Q99%, respectively). The Q90 and Q95% were usually applied as indicators of low-flow, which has broadly applied to get the smallest EFs [18-20].
3. RESULTS AND DISCUSSION
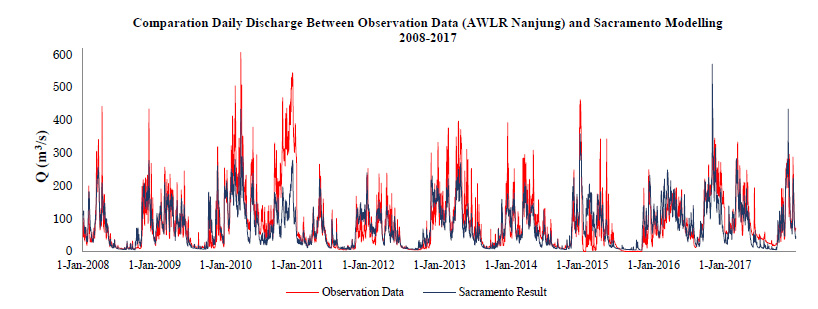
3.1. Comparison of the Daily Discharge
Sacramento method proved to provide the best results compared to data acquired from observation, as demonstrated in Fig. (3).
3.2. Sacramento Modelling Nash-Sutcliffe Efficiency in UCRB
This refers to model testing results with observational discharge data using the Nash-Sutcliffe Efficiency (NSE) method, where the NSE value is close to the Sacramento modeling (Table 2).
The final parameter optimization results can be a reference model for the engineers and modelers at UCRB, as shown in Table 3.
| Period | 2008-2017 | 2008-2009 |
|---|---|---|
| NSE | 0.63 | 0.78 |
| Model Parameter | Default Value | Default Min | Default Max | Descriptions |
|---|---|---|---|---|
| ADIMP | 0.8 | 0 | 1 | Fraction of the additional impervious area |
| LZFPM | 50 | 0 | 1000 | Lower zone primary free-water maximum capacity |
| LZFSM | 50 | 0 | 1000 | Lower zone supplementary free-water maximum capacity |
| LZPK | 0.01 | 0 | 1 | Lower zone primary free-water depletion rate |
| LZSK | 0 | 0 | 1 | Lower zone supplementary free-water depletion rate |
| LZTWM | 200 | 0 | 400 | Lower zone tension water maximum capacity |
| PCTIM | 0.18 | 0 | 1 | Fraction of the impervious area |
| PFREE | 0.8 | 0 | 1 | Direct percolation fraction from upper to lower zone free-water stor. |
| REXP | 1.5 | 0 | 3 | Exponent of the percolation equation |
| RSERV | 1 | 0 | 1 | Fraction of the lower zone free-water that is unavailable for |
| - | - | - | - | Transpiration purposes |
| SARVA | 0.6 | 0 | 1 | Fraction of the riparian vegetation area |
| SIDE | 1 | 0 | 1 | Fraction of base flow that is draining to areas other than the observed channel |
| SSOUT | 0.8 | 0 | 1 | Fixed rate of flow lost from channel |
| UZFWM | 80 | 0 | 80 | Upper zone free-water maximum capacity |
| UZK | 0.14 | 0 | 1 | Upper zone free-water lateral depletion rate |
| UZTWM | 2 | 0 | 100 | Upper zone tension water maximum capacity |
| ZPERC | 12 | 0 | 80 | Maximum percolation rate coefficient |
| - | 7Q10 (m3/s) | Q95 | Q99 | |
|---|---|---|---|---|
| Gumbel min | Weibull min | (m3/s) | (m3/s) | |
| Sacramento Model | 0.38 | 2.18 | 7.06 | 5.35 |
| Nanjung AWLR | -5.05 | 1.24 | 7.17 | 2.48 |
3.3. Gumbel minima and Weibulll minima methods
The 7Q10 and Sacramento debit calculation results were carried out using the Gumbel minima and Weibulll minima methods, both from the Nanjung daily recording data and the results of the Sacramento calculation, as presented in Table 4. The results of the Gumbel minima method were negative; thus, it could not be associated with the low discharge in the river. This is in accordance with the hypothesis the estimation of Gumbelmin quantiles could produce negative numbers, which stated that the Gumbel minima method had limitations in the 7Q10 calculation [24].
The value of Q95 for Nanjung AWLR was 7.17 m3/s, while the result for modeling rainfall-runoff was 7.06 m3/s. While Q99 for AWLR Nanjung was 2.48 m3/s and Sacramento modeling for UCRB was 5.35 m3/s (Table 4). The value of 7Q10 showed that the results are significantly smaller than Q95 and also smaller than Q99 (Table 4), thus, the research established that Q95 was widely used in Indonesia to determine EF.
CONCLUSION
Results from UCRB showed that the low-flow rate was obtained from Q95 at around 7 m3/s and for 7Q10 at 2.18 m3/s and 1.24 m3/s. The results concluded that the two methods used to determine the amount of EF had significant differences, though further testing and analysis is needed considering ecological conditions and habits. The results show that the value of Q95 or even Q99 is greater than the value of 7Q10. This causes the value of 7Q10 cannot be used as a reference for the determination of the amount of environmental discharge, although other countries use this method in the determination of its environmental flow. Although the amount of Q95 has so far been a reference for river maintenance discharge in Indonesia, this needs to be studied more deeply, considering that until now, there is still a decrease in the number of fish species in Citarum, especially in the UCRB area. So, further studies are needed to conduct an ecological response to flow alternation. Therefore, it is necessary to ensure that the amount of discharge available can support the ecological conditions in the UCRB area. Factoring the activities of Accelerating Pollution Control and Damage to the Citarum River Basin, it was necessary to ensure the availability of the discharge amount. Furthermore, the significant difference certainly affected the ecological conditions and the management of the Citarum River, particularly in the UCRB.
LIST OF ABBREVIATIONS
| EF | = Environmental Flow |
| FDCA | = Flow Duration Curve Analysis |
| NSE | = Nash-Sutcliffe Efficiency |
CONSENT FOR PUBLICATION
Not applicable.
AVAILABILITY OF DATA AND MATERIALS
The data associated with this paper is available at the Balai Besar Wilayah Sungai (BBWS) Citarum office and can be obtained by submitting a letter of application to obtain the data. To get an overview of the available data can be seen on http://hkabbwscitarum.higertech.com/.
FUNDING
None.
CONFLICT OF INTEREST
The authors declare no conflict of interest, financial or otherwise.
ACKNOWLEDGEMENTS
The author wishes to acknowledge the Civil Engineering Doctoral Program ITB for partially supporting the research and Mercu Buana University for their grant. Recognition also goes to Balai Besar Wilayah Sungai (BBWS) Citarum for providing secondary data used in this research. Finally, the author’s gratitude goes to the Editor and two anonymous referees who tirelessly gave constructive comments and suggestions that substantially improved the paper.

