All published articles of this journal are available on ScienceDirect.

Research on Shrinkage and Shrinkage Models of Reinforced Concrete Specimens
Authors Info & Affiliations
Abstract
Introduction:
It is very important to accurately predict the shrinkage of reinforced concrete specimens to ensure structural safety.
Methods:
In this study, a total of 36 reinforced concrete specimens were used with a size of 150mm×150mm×450mm to examine concrete strength grades and longitudinal reinforcement ratios on the shrinkage of reinforced concrete specimens using shrinkage tests.
Results:
The results showed that the concrete strength increased from 35MPa to 58.2MPa, and the shrinkage rate of concrete decreased by about 30%. The ratio of reinforcement increased from 0 to 2.01%, and the shrinkage rate of concrete decreased by about 40%.
Conclusion:
The experimental results were compared with existing shrinkage models of reinforced concrete, and a modified shrinkage calculation model of reinforced concrete was proposed.
1. INTRODUCTION
Shrinkage is one of the important factors affecting the long-term durability of reinforced concrete structures [1, 2]. The shrinkage of reinforced concrete will lead to a change in its own volume, which will have a serious negative impact on the deflection and durability of reinforced concrete structures [3]. The serious shrinkage of reinforced concrete leads to cracks in the structure [4, 5], leading to the corrosion of the internal reinforcement and reducing the durability and bearing capacity of the whole structure [6]. In prestressed structures, shrinkage will also increase the loss of prestress, resulting in the decline of bearing capacity [7]. Therefore, it is very important to predict the shrinkage behavior of concrete.
At present, there are several recognized mathematical models for predicting the shrinkage of ordinary concrete, such as the CEB-FIP model [8], GL2000 model [9], ACI209 model [10], and B4 model [11]. CEB-FIP model is a European concrete standard model, which considers the influence of concrete strength, relative environmental humidity, curing time and cement type. The GL2000 model is proposed by Gardner and Lockman of the American Concrete Institute (ACI) based on the improvement of the previous GZ1993 model, which has simple calculation and high precision. The influence of relative environmental humidity, cement dosage, cement type and curing time is mainly considered in the calculation of shrinkage deformation of the ACI209 model. The B4 model is a semi-empirical and semi-theoretical model based on consolidation theory.
Based on the shrinkage model of ordinary concrete that has been proposed, many scholars have studied the shrinkage behavior of different kinds of concrete. In terms of predicting the shrinkage of alkali slag concrete, Zhihua Ou [12] developed a new drying shrinkage prediction model of sodium silicate-activated slag concrete with higher reliability based on the ACI-209 model. In terms of predicting the shrinkage of recycled concrete, Hanghua Zhang [13] obtained a long-term shrinkage model suitable for recycled concrete by adding the correction coefficient of aggregate combination and recycled powder content to the existing ACI-209 model. In terms of predicting the shrinkage of ultra-high performance concrete, Zuanfeng Pan [14], based on the ACI-209 model, introduced the strength influence factor, appropriately modified the ultimate value of shrinkage and the development speed of shrinkage (i.e., the index of time curve), and obtained a more accurate prediction model. In terms of predicting the shrinkage of reinforced concrete, Yuan Gao [15], based on the CEB-FIP model, introduced the influence coefficient of reinforcement into the model and proposed the shrinkage model of reinforced concrete.
The shrinkage test of reinforced concrete specimens is studied in this paper. Firstly, the influence of concrete strength on the shrinkage of reinforced concrete is analyzed. Secondly, the influence of the longitudinal reinforcement ratio on the shrinkage of reinforced concrete is examined. Thirdly, the existing reinforced concrete shrinkage model is compared with the test results. Finally, an improved reinforced concrete shrinkage model is proposed, which considers the coupling effect of longitudinal reinforcement ratio and concrete strength on shrinkage.
2. MATERIALS AND METHODS
The raw materials required to prepare concrete in this study included cement, cobblestone, medium sand, superplasticizer, and water.
2.1. Cement
The cement selected was P.O42.5 Portland cement produced by Yatai (Group) limited company. The initial setting time of P.O42.5 cement was 2h 45 min, and the final setting time was 3h and 45 min. Table 1 demonstrates the test results of cement samples.
2.2. Cobblestone
The particle size of the coarse aggregate included was 5~20mm. The bulk density of coarse aggregate was 2620kg/m3, and the content of mudstone was less than 0.5%.
2.3. Steel
Longitudinal steel bars of HRB500 and HRB600 were used. Table 2 shows the mechanical properties of the selected longitudinal bars. The stress-strain curves of HRB500 and HRB600 steel bars are shown in Fig. (1). For example: in HRB600, HRB is a hot-rolled ribbed steel bar, and 600 means that the yield strength of this kind of reinforcement is 600MPa.
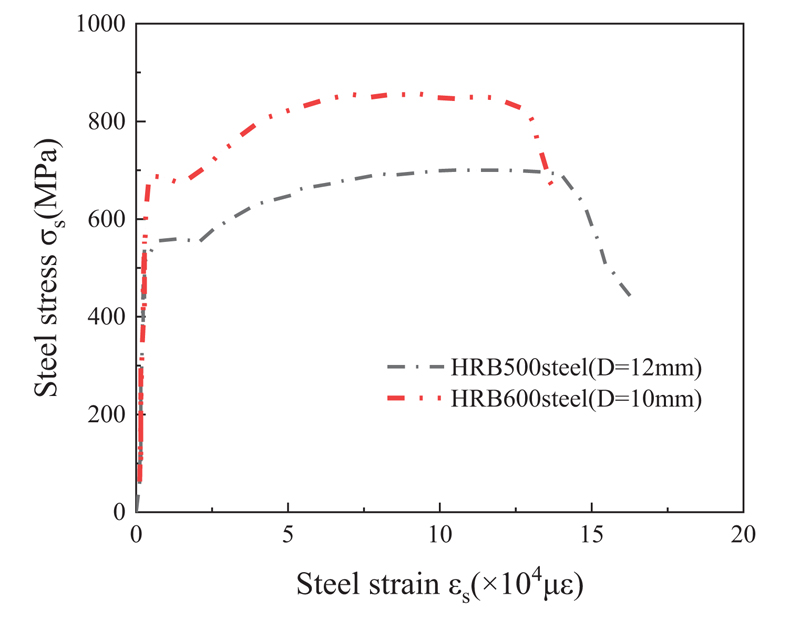
Table 1.
| Test Items | SiO2 | CaO | Fe2O3 | Al2O3 | MgO | K2O | Na2O | S3O | Ignition Loss | Specific Gravity(kg/m3) | Specific Surface Area(m2/g) |
|---|---|---|---|---|---|---|---|---|---|---|---|
| Mass percentage % | 22.1 | 63.4 | 3.1 | 5.7 | 2.0 | 0.4 | 0.2 | 2.1 | 0.7 | 3088 | 347 |
| Steel Bar Grade | Diameter (mm) | Yield Strength (MPa) | Tensile Strength (MPa) | Yield Strain (με) | Yield Platform Terminal Strain (με) | Maximum Elongation Under Force |
|---|---|---|---|---|---|---|
| HRB500 | 12 | 555 | 700 | 2775 | 19210 | 13.2% |
| HRB600 | 10 | 680 | 850 | 3400 | 15200 | 11.3% |
2.4. Superplasticizer
In order to make the slump of concrete with higher strength grade and reach the specified index, superplasticizer polycarboxylate (SP) was added when making concrete specimens. SP is a new generation of environmental protection and high-performance superplasticizer based on new synthetic technology. Its main component is polycarboxylate, and its apparent physical characteristic is dark yellow transparent liquid, solid content is 20%, the water reduction rate is 25%, and the quality of the content is 0.2%~5%.
3. TEST SPECIMEN DESIGN AND PRODUCTION
3.1. Specimen Design
The test specimen design was divided into two groups. The concrete in the test specimen was ordinary concrete, the concrete strength grade was C30, C40, C50 and C60, and the size was 150mm×150mm×450mm (b ×h×H). Table 3 shows the mixed proportion of concrete.
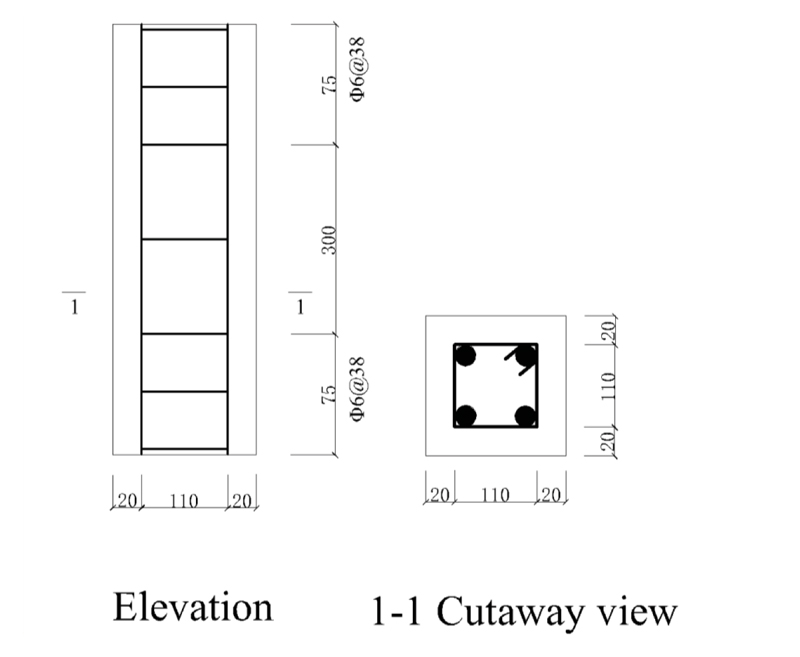
Section and reinforcement of 150mm×150mm×450mm test specimen are shown in Fig. (2) and Table 4. The numbers in Table 4 consist of four parts: concrete strength grade, total reinforcement ratio of longitudinal compression reinforcement, and steel grades. Considering C30-1.40%-HRB600 as an example, it is a test specimen with a concrete strength grade of C30. The total reinforcement ratio of longitudinal compression reinforcement is 1.40%, and the grade of the longitudinal compression steel bar is HRB600. Three shrinkage contrast test specimens were prepared for each strength grade. Shrinkage values were tested from day 62 to day 270.
| Strength Grade | Mix Proportion (kg/m3) | Water-cement Ratio | ||||
|---|---|---|---|---|---|---|
| Cement | Sand | Cobblestone | SP | Water | ||
| C30 | 400 | 615 | 1195 | — | 192 | 0.48 |
| C40 | 430 | 610 | 1180 | — | 189 | 0.44 |
| C50 | 430 | 617 | 1198 | 2.3 | 155 | 0.36 |
| C60 | 654 | 551 | 1025 | 3.5 | 176 | 0.27 |
| Number | Concrete Design Strength Grade | Test Specimen Size (b×h×H) | Reinforcement Ratio of Longitudinal Compression Steel bar (%) | Reinforcement | Standard Cube Compressive Strength (MPa) | Axial Compressive Strength (MPa) | Stirrup |
|---|---|---|---|---|---|---|---|
| C30-1.40%-HRB600 | C30 | 150mm×150mm×450mm | 1.40 | 4Φ10 | 45.9 | 35.0 | Φ6@38 |
| C30-1.40%-HRB600 | C30 | 150mm×150mm×450mm | 1.40 | 4Φ10 | 45.9 | 35.0 | Φ6@38 |
| C30-1.40%-HRB600 | C30 | 150mm×150mm×450mm | 1.40 | 4Φ10 | 45.9 | 35.0 | Φ6@38 |
| C30-1.40%-HRB600 | C30 | 150mm×150mm×450mm | 1.40 | 4Φ10 | 45.9 | 35.0 | Φ6@38 |
| C30-2.01%-HRB500 | C30 | 150mm×150mm×450mm | 2.01 | 4Φ12 | 45.9 | 35.0 | Φ6@38 |
| C30-2.01%-HRB500 | C30 | 150mm×150mm×450mm | 2.01 | 4Φ12 | 45.9 | 35.0 | Φ6@38 |
| C30-2.01%-HRB500 | C30 | 150mm×150mm×450mm | 2.01 | 4Φ12 | 45.9 | 35.0 | Φ6@38 |
| C30-2.01%-HRB500 | C30 | 150mm×150mm×450mm | 2.01 | 4Φ12 | 45.9 | 35.0 | Φ6@38 |
| C40-1.40%-HRB600 | C40 | 150mm×150mm×450mm | 1.40 | 4Φ10 | 48.2 | 36.5 | Φ6@38 |
| C40-1.40%-HRB600 | C40 | 150mm×150mm×450mm | 1.40 | 4Φ10 | 48.2 | 36.5 | Φ6@38 |
| C40-1.40%-HRB600 | C40 | 150mm×150mm×450mm | 1.40 | 4Φ10 | 48.2 | 36.5 | Φ6@38 |
| C40-1.40%-HRB600 | C40 | 150mm×150mm×450mm | 1.40 | 4Φ10 | 48.2 | 36.5 | Φ6@38 |
| C40-2.01%-HRB500 | C40 | 150mm×150mm×450mm | 2.01 | 4Φ12 | 48.2 | 36.5 | Φ6@38 |
| C40-2.01%-HRB500 | C40 | 150mm×150mm×450mm | 2.01 | 4Φ12 | 48.2 | 36.5 | Φ6@38 |
| C40-2.01%-HRB500 | C40 | 150mm×150mm×450mm | 2.01 | 4Φ12 | 48.2 | 36.5 | Φ6@38 |
| C40-2.01%-HRB500 | C40 | 150mm×150mm×450mm | 2.01 | 4Φ12 | 48.2 | 36.5 | Φ6@38 |
| C50-1.40%-HRB600 | C50 | 150mm×150mm×450mm | 1.40 | 4Φ10 | 55.3 | 40.4 | Φ6@38 |
| C50-1.40%-HRB600 | C50 | 150mm×150mm×450mm | 1.40 | 4Φ10 | 55.3 | 40.4 | Φ6@38 |
| C50-1.40%-HRB600 | C50 | 150mm×150mm×450mm | 1.40 | 4Φ10 | 55.3 | 40.4 | Φ6@38 |
| C50-1.40%-HRB600 | C50 | 150mm×150mm×450mm | 1.40 | 4Φ10 | 55.3 | 40.4 | Φ6@38 |
| C50-2.01%-HRB500 | C50 | 150mm×150mm×450mm | 2.01 | 4Φ12 | 55.3 | 40.4 | Φ6@38 |
| C50-2.01%-HRB500 | C50 | 150mm×150mm×450mm | 2.01 | 4Φ12 | 55.3 | 40.4 | Φ6@38 |
| C50-2.01%-HRB500 | C50 | 150mm×150mm×450mm | 2.01 | 4Φ12 | 55.3 | 40.4 | Φ6@38 |
| C50-2.01%-HRB500 | C50 | 150mm×150mm×450mm | 2.01 | 4Φ12 | 55.3 | 40.4 | Φ6@38 |
| C60-1.40%-HRB600 | C60 | 150mm×150mm×450mm | 1.40 | 4Φ10 | 68.9 | 58.2 | Φ6@38 |
| C60-1.40%-HRB600 | C60 | 150mm×150mm×450mm | 1.40 | 4Φ10 | 68.9 | 58.2 | Φ6@38 |
| C60-1.40%-HRB600 | C60 | 150mm×150mm×450mm | 1.40 | 4Φ10 | 68.9 | 58.2 | Φ6@38 |
| C60-1.40%-HRB600 | C60 | 150mm×150mm×450mm | 1.40 | 4Φ10 | 68.9 | 58.2 | Φ6@38 |
| C60-2.01%-HRB500 | C60 | 150mm×150mm×450mm | 2.01 | 4Φ12 | 68.9 | 58.2 | Φ6@38 |
| C60-2.01%-HRB500 | C60 | 150mm×150mm×450mm | 2.01 | 4Φ12 | 68.9 | 58.2 | Φ6@38 |
| C60-2.01%-HRB500 | C60 | 150mm×150mm×450mm | 2.01 | 4Φ12 | 68.9 | 58.2 | Φ6@38 |
| C60-2.01%-HRB500 | C60 | 150mm×150mm×450mm | 2.01 | 4Φ12 | 68.9 | 58.2 | Φ6@38 |
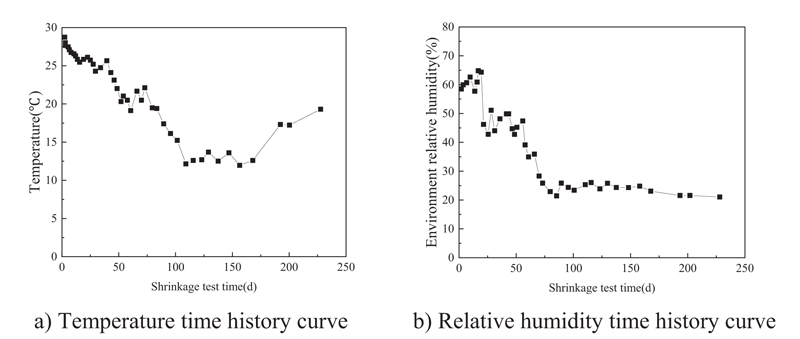
3.2. Test Specimen Temperature And Relative Humidity
The temperature and relative humidity changes in all test specimens during the test are shown in Fig. (3). During the test specimen test, the temperature and humidity controller was introduced into the laboratory. The temperature and humidity were relatively stable; the temperature was 15±1 °C, and the average relative humidity of the environment was 42%.
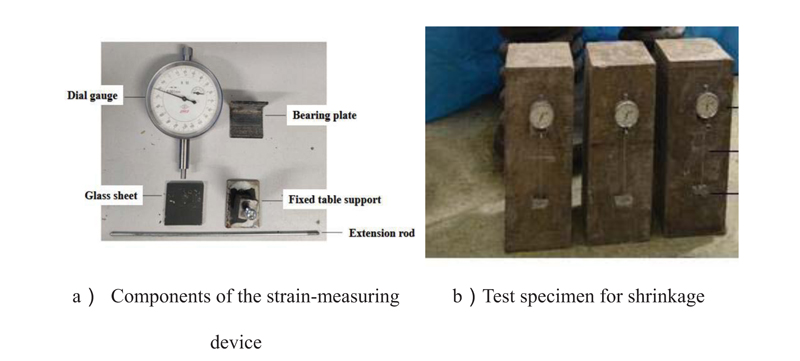
3.3. Experiment Method
The shrinkage test was carried out according to GB/T 50082-2009 “Standard of test method for long-term performance and durability of ordinary concrete” [16]. Two sets of strain collection devices were placed on the opposite sides of concrete prisms, the distance between the two measuring points in the strain collection device was 200mm, three concrete prisms in each strength grade were tested for shrinkage, and the mean shrinkage of the three concrete prisms was recorded as the shrinkage value of the group of concrete specimens (Fig. (4).
4. RESULTS AND DISCUSSION
4.1. Reinforced Concrete Specimens Shrink
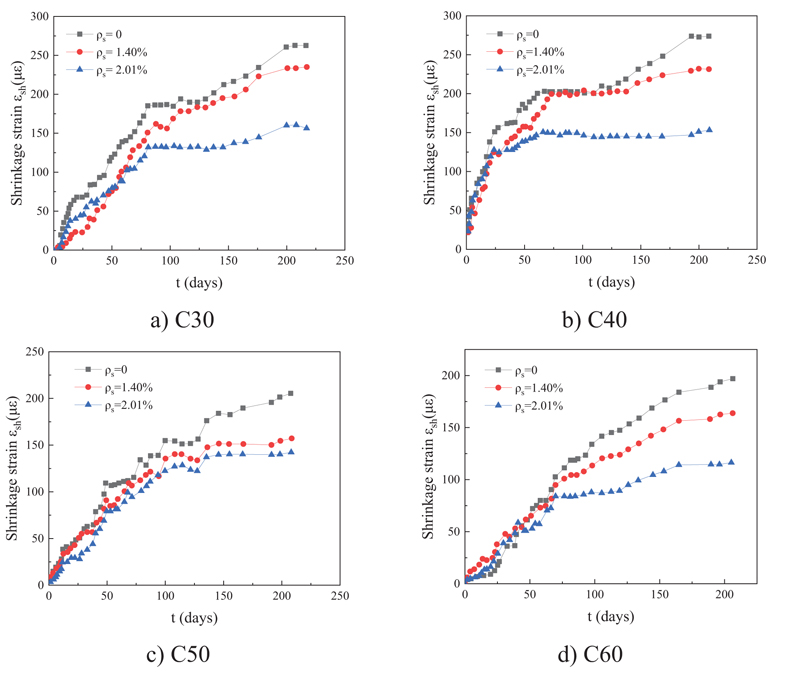
Fig. (5) shows the shrinkage time history curve of the reinforced concrete specimen from the beginning of the experiment. ρs in Fig. (5) is the total reinforcement ratio of longitudinal reinforcement. The shrinkage strain of reinforced concrete specimens decreased with an increase in the longitudinal reinforcement ratio. At the end of the shrinkage test, the contraction strain of the 1.40% specimen with longitudinal reinforcement ratio was reported to be 76%~89% of that of plain concrete, and the contraction strain of the 2.01% specimen with longitudinal reinforcement ratio was 52%~76% of that of plain concrete. It can be concluded that longitudinal reinforcement inhibited the development of free shrinkage, and the higher the reinforcement ratio, the more pronounced the inhibition effect.
On the other hand, according to Fig. (5), with the improvement in concrete grade, the shrinkage of the reinforced concrete specimen gradually decreased, due to which the structure of the reinforced concrete specimen became dense. The dense structure made the water in the reinforced concrete short specimen difficult to evaporate, thus reducing the shrinkage of the reinforced concrete specimen.
5. DATA SIMULATION ANALYSIS
5.1. The Existing Reinforced Concrete Specimen Contraction Model
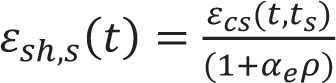
Currently, there are few research works on reinforced concrete specimen shrinkage. Based on the CEB-FIP model, Yuan Gao [15] introduced the influence coefficient of reinforced concrete and proposed a reinforced concrete shrinkage model. The calculation formula of its shrinkage model is as follows:
 |
(1) |
 |
(2) |
 |
(3) |
In the formula, the value of βsc is determined by the type of cement; βRH is determined by the relative humidity of the environment; β(t-ts) is the coefficient of shrinkage strain change. t is the age of concrete; ts is the age when the concrete begins to shrink. ƒs is the compressive strength of concrete; αe = Es/Ec; ρ is the ratio of reinforcement.
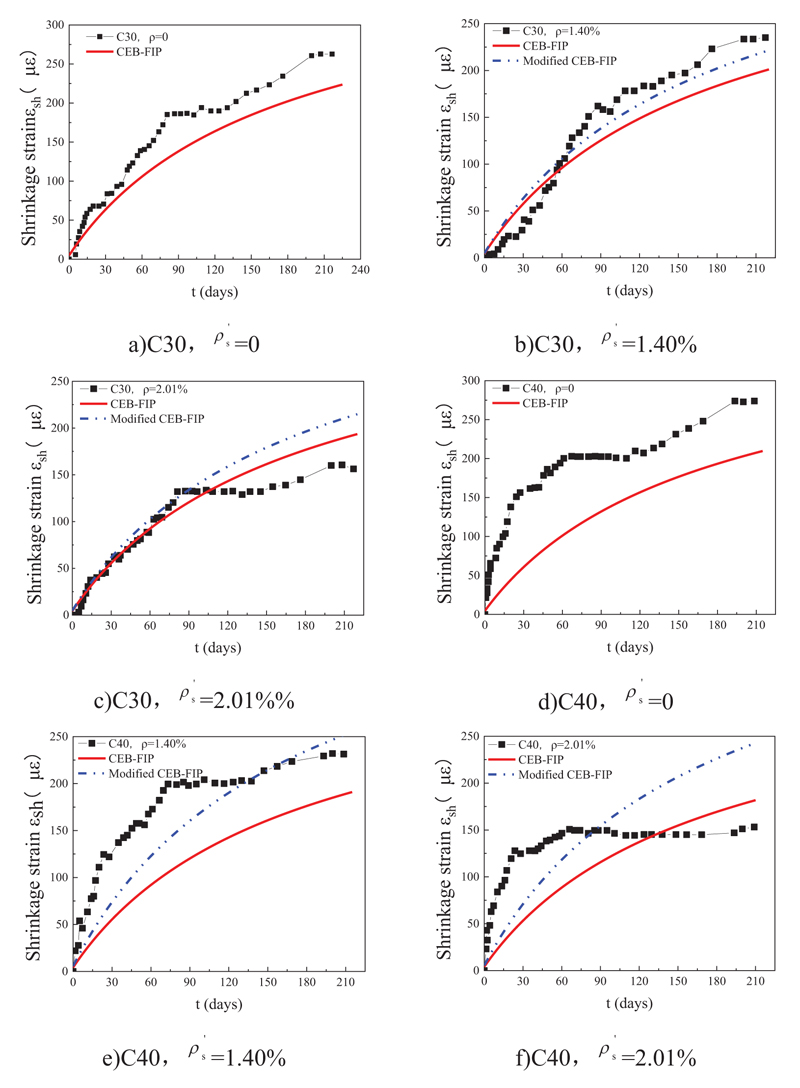
The comparison between the existing reinforced concrete specimen shrinkage model and the test values is shown in Fig. (6). It can be seen that the prediction accuracy of the existing reinforced concrete specimen shrinkage model is high when the strength is higher, but the prediction effect is worse when the strength is lower. Taking the longitudinal reinforcement ratio of 1.40% as an example, when the shrinkage test time is 210d, the ratio fractions of calculated values and test values of C30, C40, C50 and C60 reinforced concrete specimens are 83.8%, 81.7%, 116.4% and 95.80%, respectively.
5.2. Modified Reinforced Concrete Specimen Shrinkage Model
Based on the test results and CEB-FIP shrinkage model, the regression-modified calculation model of reinforced concrete specimen shrinkage is fitted considering the effects of longitudinal reinforcement ratio and concrete strength, as shown in Formula 4. The values of the modified reinforced concrete specimen contraction model were compared with the existing model using the contraction test, as shown in Fig. (6). It can be seen that the modified reinforced concrete specimen contraction model was in good agreement with the test value, and the prediction accuracy was higher than the existing reinforced concrete specimen contraction model (ƒc is the design value of the axial compressive strength of concrete).
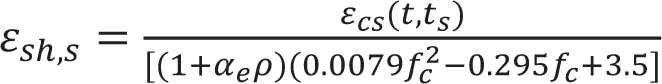 |
(4) |
5.3. Accuracy Evaluation of the Existing Model and Modified Model
In order to evaluate the precision of the shrinkage prediction model for reinforced concrete specimens, four indexes, R (correlation coefficient), MSE (mean square error), MAPE (mean absolute percentage error) and IAE (integral absolute error), were used to evaluate the prediction results. R reflects the correlation between independent variables and dependent variables, MSE reflects the average error, MAPE reflects the degree of data dispersion, and IAE reflects the accuracy of prediction results. The calculation formulas of each index are shown in Eqs 5-8 [17, 18].
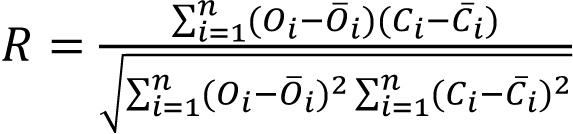 |
(5) |
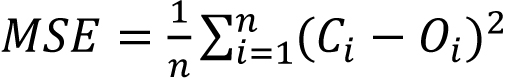 |
(6) |
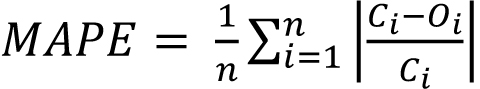 |
(7) |
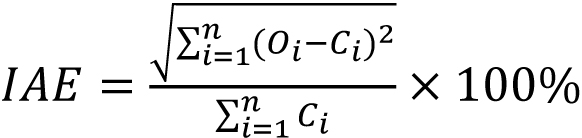 |
(8) |
Where Oi is the actual value of the contraction strain of the reinforced concrete specimen, Oi is the predicted value of the contraction strain of the reinforced concrete specimen, Ōs is the average value of the actual value of the contraction strain of the reinforced concrete specimen, C̄i is the average value of the predicted value of the contraction strain of the reinforced concrete specimen, and n is the number of data points.
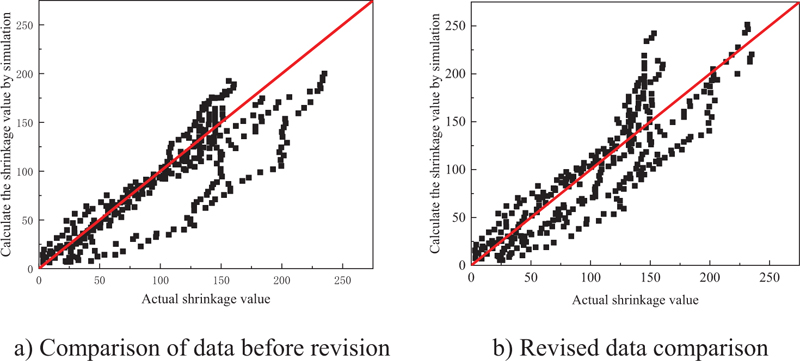
Table 5 shows the specific comparison of prediction accuracy between existing and modified reinforced concrete specimen shrinkage models. It can be seen that the R-value predicted by the revised RC specimen shrinkage model is higher than the existing reinforced concrete specimen shrinkage model, while the MSE, MAPE and IAE are smaller than the existing reinforced concrete specimen shrinkage model. Fig. (7) compares the predicted value of the existing reinforced concrete specimen shrinkage model and the modified reinforced concrete specimen model with the experimental value. It can be seen that for the existing reinforced concrete specimen shrinkage model, most of the experimental data points fall at the lower side of the Y=X line, indicating that the existing reinforced concrete specimen shrinkage model underestimates the reinforced concrete specimen shrinkage on the whole. For the modified reinforced concrete specimen shrinkage model, the data points are evenly distributed on both sides of Y=X, indicating that the modified model can accurately predict the reinforced concrete specimen shrinkage.
| Evaluation Index | R | MSE | MAPE | IAE/% |
|---|---|---|---|---|
| Existing reinforced concrete specimen shrinkage models | 0.85 | 1021.60 | 0.39 | 1.95 |
| Modified reinforced concrete specimen shrinkage model | 0.90 | 860.67 | 0.37 | 1.64 |
CONCLUSION
In this study, the shrinkage properties of reinforced concrete were evaluated through experiments and models, and the effects of different concrete strengths and different reinforcement ratios on the shrinkage properties of reinforced concrete were studied. The following conclusions were drawn:
1. The shrinkage of the reinforced concrete specimen decreased with an increase in concrete strength. The concrete strength increased from 35MPa to 58.2MPa, and the shrinkage rate of concrete decreased by about 30%.
2. The shrinkage of the reinforced concrete specimen decreased with an increase in the longitudinal reinforcement ratio. The ratio of reinforcement increased from 0 to 2.01%, and the shrinkage rate of concrete decreased by about 40%.
3. Existing models generally underestimated the shrinkage of reinforced concrete specimens, with good prediction accuracy at high strength but poor prediction accuracy at low strength.
4. Based on CEB-FIP model and considering the influence of concrete strength and longitudinal reinforcement ratio, a modified reinforced concrete specimen shrinkage model was proposed.
AUTHORS’ CONTRIBUTION
Pang Chen and Xiaoyu Si designed and performed the study; Guilin Zhang, Jingde Wang, and Yang Han made comments and amendments to the paper. All the authors analysed the data and contributed to writing the paper.
LIST OF ABBREVIATIONS
| ACI | = American Concrete Institute |
| SP | = Superplasticizer Polycarboxylate |
| MSE | = Mean Square Error |
| MAPE | = Mean Absolute Percentage Error |
| IAE | = Integral Absolute Error |
CONSENT FOR PUBLICATION
Not applicable.
AVAILABILITY OF DATA AND MATERIALS
The data that support the findings of this study are available within the article.
CONFLICT OF INTEREST
The authors declare no conflict of interest, financial or otherwise.
FUNDING
This study is financially supported by the National Natural Science Foundation of China (Project No. 52108132), the Natural Science Foundation of Hebei Province (Project No. E2021202067), the Colleges and Universities in Hebei Province Science and Technology Research (Project No. QN2021037).
ACKNOWLEDGEMENTS
The authors would like to gratefully acknowledge the financial support of the National Natural Science Foundation of China (Project No. 52108132), the Natural Science Foundation of Hebei Province (Project No. E2021202067), the Colleges and Universities in Hebei Province Science and Technology Research (Project No. QN2021037).

