All published articles of this journal are available on ScienceDirect.

Dissipation of Water Energy by Using a Special Stilling Basin Via Three-dimensional Numerical Model
Authors Info & Affiliations
Abstract
Introduction:
The forced hydraulic jump characteristics were studied numerically using Flow-3D software. Rectangular and semi-cylindrical shape slices were used as obstacles with different arrangements in the stilling basin to dissipate the excess kinetic energy.
Methods:
Each shape type was tested under five values of discharges (60, 80, 100, 120, and 160 l s-1). The numerical results showed that the obstacles act as good energy dissipators, which decrease the hydraulic jump length and the length of the stilling basin as a result. The best case is installing three semi-cylindrical slices in the stilling basin, and energy dissipation ratios range from 48% to 63%, with an average difference of 14% from the values of classical hydraulic jumps, according to discharge values.
Results:
It should be noted that the semi-cylindrical slices have better performance on energy dissipation ratios than rectangular slices, which indicates concave surface models cause the flow to change its direction, and this leads to a stable hydraulic condition.
Conclusion:
Results of this work can be applied to a prototype by fixing three semi-cylindrical slices in the stilling basin at relative distances of 0.2, 0.5, and 0.8 from the end of the spillway, and this lead to maximize energy dissipation rates.
1. INTRODUCTION
Upstream dams, water creates a large storage area where excess water crosses the dam through its spillway into the river basin. The large potential energy generated by the difference in water levels between the upstream and downstream of the spillway turns into excess kinetic energy when it passes through the spillway to the channel bed. Dissipation of the kinetic energy generated at the base of the spillway is essential for bringing the flow into the downstream river to its normal condition in a short distance. This is necessary, not only to protect the riverbed and banks from erosion but also to ensure that the dam itself is not damaged by the high-velocity turbulent flow [1]. Hydraulic jump stilling basins are the most common type of energy dissipators for spillways and other heading-up structures. The stilling basin is the place that contains the hydraulic jump - a natural phenomenon that occurs in open channels due to flow moving from a supercritical condition to a sub-critical one - downstream of the heading-up structures, so its length should cover the length of the hydraulic jump.
According to channel characteristics, there are two types of hydraulic jumps. One is a classical hydraulic jump, which occurs in a smooth, horizontal, and prismatic rectangular channel, and it forms the largest length. For rectangular cross sections of channels with a smooth and horizontal bed, Belanger (1838) predicted the sequent depth ratio (y2/y1) by using the eq. of momentum with the assumption of neglected friction [2], which can be written as:
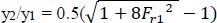 |
(1) |
Where: y1 = initial water depth for hydraulic jump (cm), y2 = sequent water depth for hydraulic jump (cm), and Fr1 = upstream Froud number at initial water depth for hydraulic jump.
 |
(2) |
V1 = upstream velocity at initial water depth for hydraulic jump (cm s-1), and g = acceleration due to gravity (cm s-2).
The second type of hydraulic jump is called a forced hydraulic jump, which occurs over a rough bed using energy dissipators, resulting in a shorter jump length and a shorter length of stilling basin.
To protect the waterway, many studies were done to get perfect control on the hydraulic jump to decrease its length and the length of the stilling basin, find the most efficient solution for energy dissipation and prevent scour downstream of the hydraulic structures. In this study, the authors focused on previous studies dealing with increasing energy dissipation.
Nikmehr and Tabebordbar [3] created an experimental study to investigate the characteristics of the hydraulic jump on an adverse slope in both cases of smooth and rough beds. Observations indicated that the jump on the adverse slope tended to move downstream, and the surface roller became unstable for jumps in which the gravity force component was in the opposite direction of flow. The results showed that the length of jump and the sequent depth ratio on a smooth bed were greater than on a rough bed for the same slope and Froude number, but the rough bed had more energy loss than the smooth bed.
Bestawy et al. [4] created an experimental study using fourteen different models of baffle piers as water energy dissipators downstream of heading-up structures. Measurements included the dimensions of the scour hole and water depth for each run for the comparison between the performance of the various models for energy dissipation. In general, results showed that the models with concave surfaces make the flow change its direction with low turbulence intensity and dissipate more energy than other forms. This leads to a stable hydraulic condition and shorter stilling basin. Also, the study showed that the vertical semi-circular cross-section had the greatest effect on the other models for dissipating water energy.
Jalil et al. [5] carried out an experimental study to determine the effect of a prismatic sill under a sluice gate by changing the sill height and comparing it to a case without a sill. The characteristics of a hydraulic jump, which were investigated, included the location of occurrence, relative sequence depth, total length, and relative energy loss. The results showed that the energy loss increases as the sill slope increases but the relative sequence depth of the jump decreases. The energy loss decreases, and the relative sequence depth increases with the increase in relative sill height to the jump location. The relative location of jump occurrence to the depth of flow after the jump decreases with the increase of the sill slope.
Fathi-Moghadam et al. [6] conducted an experimental study to evaluate the effects of a perforated sill with different heights, ratio of openings, and position of the sill in the stilling basin on the length of a favorable forced hydraulic jump. The characteristics of the hydraulic jump were measured and compared with a free hydraulic jump and continuous sill-controlled. The results showed a significant effect of the perforated sill on the hydraulic jump characteristics in terms of jump length and energy dissipation. The energy dissipation increased, and the jump length decreased in the case of perforated sill than in continuous sill-controlled and standard basins. In all cases, tail water was a governing parameter, and sill height was more sensitive to inflow Froude number than sill position.
Kang [7] created an experimental study to evaluate the effect of flow dissipation produced by using baffle blocks in different shapes to reduce scour downstream of the weir. Stepped shape, square, circular, triangular, and trapezoidal cross sections were five shapes of baffle blocks that were installed on a fixed bed. The experiments were conducted under two values of discharge (0.140 and 0.325 m3 s-1). The experimental analysis was performed by measuring the flow rate downstream of the weir in the case of the installation of baffles and without baffles based on the flow dissipation effect. The results showed that the square baffle blocks provided a large flow dissipation effect.
Parsamehr et al. [8] investigated the hydraulic jump characteristics on a rough bed with an adverse slope behind a sluice gate. The characteristics of hydraulic jump, including sequent depth, relative length of the jump, and energy loss on rough beds with irregular roughness elements of a particular shape which are distributed in a staggered way over an adverse slope, have been investigated. Two adverse slopes and two different heights of roughness elements were considered. The observations during experimental work were that the hydraulic jump is an unstable phenomenon on a smooth bed with an adverse slope, and the installation of roughness elements acts as stabilization for the jump. The results showed that the sequent depth ratio and relative length of the jump decreased by increasing the height of roughness elements and steeping the adverse slope, but the energy loss was more than those of the classical hydraulic jump on the horizontal bed.
Jalil et al. [9] conducted experiments to study the characteristics of hydraulic jump represented by relative jump length, sequent depth, and percentages of energy dissipation on rough channel beds constructed by lowering bed strips with different spaces. The results showed that, depending on the value of the incoming Froude number and spacing between strips on a smooth bed, the bed-lowered strips increase the energy dissipation and decrease relative jump length and relative sequent depths.
Abdelmonem et al. [10] introduced a new technique to increase energy dissipation and decrease the length of the hydraulic structure floor. The effect of installing a cylindrical pendulum sill downstream of the sluice gate of the hydraulic structure on the classical hydraulic jump characteristics was conducted. The flow discharge, location of the pendulum sill, and gate opening were changed. The results showed that the use of the pendulum sill increases the efficiency of the jump as an energy dissipater and decreases the jump length and sequent depth ratio.
Pourabdollah et al. [11] created an experimental study to investigate the characteristics of hydraulic jump in a stilling basin with different adverse bed slopes and positive step heights. The results are compared to the classical jump. The measurements included sequent depth ratio, jump length, roller length, and energy loss in place of four adverse bed angle slopes, and three positive step heights were tested. The experimental results illustrated that the effect of the adverse slope was greater than the positive step. Compared to the classical hydraulic jump characteristics, increasing the adverse slope and height of the positive step reduces the sequent depth ratio and roller jump length to a greater degree. The energy loss was larger in the presence of an adverse slope and a positive step than in the classical conditions.
Ibrahim et al. [12] conducted an experimental study to introduce a new technique for dissipating the energy of hydraulic jump using bed water jets installed in a classical smooth stilling basin. In addition to the reference case of non-jetted systems, three different arrangements of bed water jets were used, and five rows of bed water jets were realized. The results showed that the activating of the middle three rows of water jets can reduce the average jump length by 48% and increase the hydraulic jump efficiency in energy dissipation by up to 70.8% when compared to a non-jetted system.
Singh and Roy [13] conducted a series of laboratory experiments to determine if perforated screens work effectively as energy dissipators in mixed triple wall mode in the case of small hydraulic structures. Each layer of the screens had openings that were either circular, square, or triangular in shape, and the porosity of each layer was 45% per unit of screen depth. The experimental results showed that the usage of perforated screens can effectively dissipate the energy of supercritical flows. The difference in energy dissipation between upstream and downstream of the screen was greater than the difference in energy dissipation caused by classical hydraulic jumps.
All these previous studies aimed to reach the most economical and most efficient solution for energy dissipation and perfect control on the hydraulic jump to decrease its length and decrease the length of the stilling basin as a result. None of the previous studies dealt with the phenomenon of energy dissipation through stilling basin numerically. As the experimental work is time-consuming and more costly than using software, the authors tried to introduce a numerical work on the problem of energy dissipation through the stilling basin and compared the results with experimental work. The present numerical study aims to use numerical software for improving the efficiency of the stilling basin using new configurations of obstacles such as rectangular and semi-cylindrical slices in different arrangements to determine the best alternative for improving the flow characteristics and maximizing the energy dissipation.
2. MATERIALS AND METHODS
2.1. Dimensional Analysis
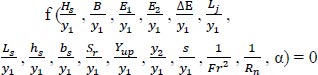
Dimensional analysis was used to correlate the different variables affected on energy dissipation through stilling basin downstream of the spillway using semi-cylindrical or rectangular slices as shown in Eqs. (3 and 4):
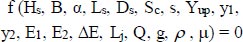 |
(3) |
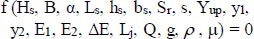 |
(4) |
Eqs. (3 and 4) were treated by Buckingham's theorem and the resultant dimensionless parameters were shown in Eqs. (5 and 6):
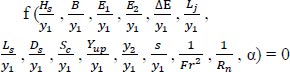 |
(5) |
 |
(6) |
Rn has a very small effect in the open channel flow, Hs, B, Ls, hs, bs, s, and α are constants then their effect can be neglected.
The relative hydraulic jump length:
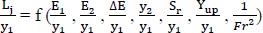 |
(7) |
The relative energy loss through the hydraulic jump:
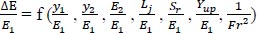 |
(8) |
Where: eqs. (3, 5, 7, and 8) for semi-cylindrical slices and eqs. (4, 6, 7, and 8) for rectangular slices.
Hs = spillway crest height (cm), B = width of channel (cm), α = angle of spillway back slope, Ls = length of stilling basin (cm), Ds = outer diameter of slice of semi-cylinder (cm), Sc = spacing between semi-cylindrical slices (cm), Sr = spacing between rectangular slices (cm), hs = height of rectangular cross section slice (cm), bs = width of rectangular cross section slice (cm), s = height of positive step (cm), Yup = upstream water depth (cm), E1 = specific energy of the supercritical flow at y1 (cm), E2 = specific energy of the subcritical flow at y2 (cm), ∆E = total energy loss (cm), Lj = length of hydraulic jump (cm), Q = discharge value (cm3 s-1), ρ = density of fluid (g cm-3), and μ = dynamic viscosity of water (g (cm.s) -1), Reynold's number (Rn) =  , V = velocity of flow (cm s-1), and ν = kinematic viscosity of water (cm2 s-1).
2.2. Overview of Flow-3D software
Flow-3D is Computational Fluid Dynamics (CFD) software that uses numerical analysis and data structures to analyze and solve problems that involve fluid flows. It provides a complete simulation platform for engineers investigating the dynamic behavior of fluids in a wide range of industrial applications and physical processes and focuses on free surface and multi-phase applications.
AutoCAD-3D is used to prepare a three-dimensional model of the spillway and obstacles of rectangular or semi-cylindrical slices which are installed in the stilling basin downstream. The Flow-3D software solves numerically the Naiver-Stokes eq. by the finite volume method. The characteristics of the fluid are defined and the CGS system of units is used (cm for lengths, grammes for masses, and seconds for times).
2.3. Governing eqs. of Flow-3D software
The Navier-Stokes eqs. provide solutions of fluid motion eqs. in cartesian coordinates (x, y, and z) which depend on the numerical model. These governing eqs. are three-dimensional momentum eqs. and continuity eqs..
For incompressible fluids (ρ is a constant), the continuity eq. in three-dimensional cartesian coordinates is given by:
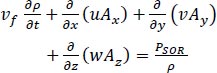 |
(9) |
Where: (u, v, w) represent the velocity components, and (Ax, Ay, and Az) are cross-sectional areas of flow in the x, y, and z directions respectively. ρ is the fluid density, vf is the volume fraction of the fluid, and PSOR is a mass source term.
Three-dimensional momentum eqs. are given by:
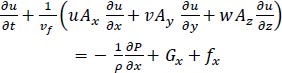 |
(10) |
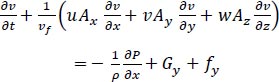 |
(11) |
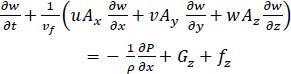 |
(12) |
Where: P is the pressure of the fluid, (Gx, Gy, and Gz) are body accelerations, and (fx, fy, and fz) are viscosity accelerations in the cartesian coordinate directions (x, y, and z), respectively.
The volume of fluid (VOF) method is used to simulate the water surface and includes three ingredients; the volume of fluid function, solving the VOF transport eq. and applying boundary conditions on a free surface. In order to model a free surface and the boundary between water and air, the volume of fluid function (F) should be defined to meet the following governing eq.. Volume fraction of the fluid (vf) is calculated with regard to the following eq.:
 |
(13) |
Where: (F) represents the volume occupied by air in each cell. When F (x, y, z, and t) = 1, the entire cell of the control volume is filled with fluid. The control volume is filled with air if F (x, y, z, and t) = 0. A part of the cell is occupied with fluid and another part is occupied with air for (F) ranges from zero to one [14].
2.4. Fluid Properties, Turbulence Models, and Physics
Many physical mechanisms can be applied in simulation. Gravity and non-inertial reference frame, viscosity, and turbulence options are selected in modelling in this study. All fluid properties being entered into modelling depend on the CGS system of units. Water at 20° C with dynamic viscosity of 0.01 g (cm.s) -1, and density of 1 g cm-3 are selected. Gravity is activated in the z-component, and it equals -981 cm s-2. The finish time is defined, and it equals 30 s on average to be sufficient to make a stable hydraulic jump. Flow-3D software uses different types of turbulence models to simulate the flow turbulence, such as the Renormalization Group (RNG) model and the two-eq. (k-e) model. Both turbulent models have almost similar outcomes, but the run time of the RNG model was shorter as shown in the research results for Moghadam et al. [15].
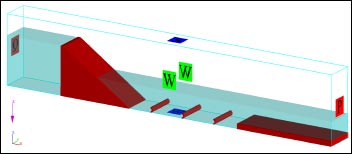
2.5. Boundary and Initial Conditions
Because the solution of flow motion eqs. requires boundary values, the boundary conditions in this study are defined as volume flow rate (vfr) at the upstream boundary (xmin.), which varied in each model to describe experimental discharge, outflow at the downstream (xmax.), walls in the bed (zmin.) and on both sides (ymin. and ymax.), and symmetry for the upper boundary (zmax.). If the simulation is run only depending on these conditions, the hydraulic jump will not be generated, the flow is considered sheet flow, and the run time will be longer to fill the water zone upstream of the structure. The solution for these problems is to generate initial conditions that include water zones at upstream and downstream of the model. The water zone upstream of the spillway is to minimize the run time, and the downstream water zone is to simulate the downstream gate action and generate the tailwater depth to start the jump. Another solution can be used to create the hydraulic jump by changing the boundary condition downstream of the model to “specified pressure”. This pressure equals the tailwater depth in the experimental results, and this boundary condition can form the jump without the need for a water zone downstream of the structure.
Fig. (1) shows the boundary and initial conditions for generated models using Flow-3D software.
3. NUMERICAL SIMULATION
3.1. Discerption of the Experimental Model
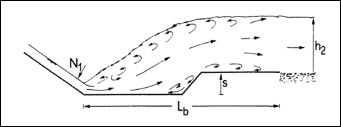
The research for Hager and Bretz [16] aimed to explain the hydraulic jump due to the presence of a positive step or negative step stilling basin in a prismatic, rectangular, and horizontal channel with a 10 m long, 0.5 m bed width, and its upstream end was bounded by a standard spillway of height 0.70 m. Positive or negative step of height z = 0.051 m and z = 0.076 m with sloping angle α1 = 45° and α1 = 90° was used. The discharge values ranged from 40 to 200 l s-1. The sequent depth ratios for the A-jump and the B-jump formations of a positive and negative step were considered, and the upstream and downstream positions of a hydraulic jump were still associated with the step. The length characteristics and particular phenomena such as wave formation were analyzed. The research was studying the effect of sudden rise and sudden drop at the canal bed on flowing water and hydraulic jump. Fig. (2) illustrates a stilling basin containing a positive step [17].
3.2. Validation of the Numerical Modelling Results
To validate the numerical modelling results, and make sure that the Flow-3D software can simulate the behavior of flowing water and the formation of hydraulic jump in the stilling basin downstream of the hydraulic structures, some results for practical experiments obtained from the research of Hager and Bretz [16] were simulated using the program to check the percentage of variation between the practical and numerical results.
Two sets of laboratory results were selected from the research of Hager and Bretz [16] (A-jump and positive step with different step heights) for examples, to validate the Flow-3D software:
First group (H5.1): s = 5.1 cm, α1 = 90°, Q = 40, 60, 80, 100, 120, 140, 160, 180, 200 l s-1.
Second group (H7.6): s = 7.6 cm, α1 = 90°, Q = 40, 60, 80, 100, 120, 140, 160, 180, 200 l s-1.
Thus, all these experiments were simulated using Flow-3D software, and the rates of variations between the numerical and practical experimental results were analyzed.
The relationship between (y1) for practical experiments, and (y1) for numerical results was drawn in one chart using 18 points.
Table 1 shows a comparison between the results of laboratory experiments and the results obtained from the Flow-3D software to simulate the phenomenon of energy dissipation:
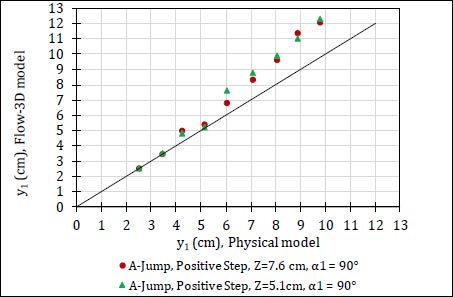
Fig. (3) shows the relationship between the values of the initial water depth of hydraulic jump (y1) resulting from numerical modeling using Flow-3D software and (y1) resulting from experiments for Hager and Bretz [16], for A-Jump and Positive step which are used to validate the program.
The results showed a good agreement between numerical and laboratory results.
The comparison between the experimental and Flow-3D results as shown in Fig. (3), showed that the difference between both results did not exceed 20%, from which one can consider the results from Flow-3D software to be acceptable.
3.3. Description of Generated Models
New scenarios with different obstacles, which are installed in the stilling basin in different configurations of rectangular or semi-cylindrical slices and followed by a positive step in the same height (s = 7.6 cm, α1 = 90°), are generated to study their effect on dissipating the excess kinetic energy of flow through the pool stilling basin using the Flow-3D program. The length of the stilling basin is 6.0 m including the obstacles and positive step, and its upstream end is bounded by a spillway of height 0.70 m and its angle of back slope is 30°.
The following are all cases of the studied models using Flow-3D software:
1. Stilling basin contains (seven, five, three, or two) rectangular slices and is followed by a positive step with the same height (R7, R5, R3, or R2).
2. Stilling basin contains three perorated rectangular slices with different perforation ratios of (25, 37.5, or 50%) with (4 circles, 6 circles, or 8 circles with equal diameters), respectively, and followed by a positive step with the same height (R4c, R6c, or R8c).
3. All groups of rectangular slices are compared to semi-cylindrical slices of the same numbers and arrangements placed in the stilling basin and followed by a positive step of the same height (Y7, Y5, Y3, or Y2) and (Y4c, Y6c, or Y8c).
Each configuration was tested under five values of the discharge (60, 80, 100, 120, and 160 l s-1).
It is worth noting that all these numerical models depend on the data taken from practical experiments in the research of Hager and Bretz [16], such as the dimensions of the channel and spillway, as well as the values of the discharges used and sequent water depth for the hydraulic jump.
All tested models in this study are illustrated in Table 2.
| A-Jump, Positive Step, s = 5.1 cm, and α1 = 90° | |||||||||
|---|---|---|---|---|---|---|---|---|---|
| Q (l s-1) | 40 | 60 | 80 | 100 | 120 | 140 | 160 | 180 | 200 |
| y1 (cm), physical model | 2.5 | 3.45 | 4.25 | 5.15 | 6.05 | 7.1 | 8.05 | 8.9 | 9.8 |
| y1 (cm), numerical model | 2.5 | 3.5 | 4.8 | 5.2 | 7.6 | 8.8 | 9.9 | 11 | 12.3 |
| y2 (cm), physical model | 15.5 | 21.5 | 26.5 | 30.6 | 34.2 | 36.7 | 39.2 | 42.9 | 46 |
| y2 (cm), numerical model | 15.5 | 21.5 | 26.5 | 30.6 | 34.2 | 36.7 | 39.2 | 42.9 | 46 |
| A-Jump, Positive Step, s = 7.6 cm, and α1 = 90° | |||||||||
| Q (l s-1) | 40 | 60 | 80 | 100 | 120 | 140 | 160 | 180 | 200 |
| y1 (cm), physical model | 2.5 | 3.45 | 4.25 | 5.15 | 6.05 | 7.1 | 8.05 | 8.9 | 9.8 |
| y1 (cm), numerical model | 2.5 | 3.45 | 4.4 | 5.4 | 6.8 | 8.3 | 9.6 | 11.4 | 12.1 |
| y2 (cm), physical model | 12.1 | 17.6 | 22.0 | 26.9 | 30.5 | 33.6 | 36.9 | 39.2 | 41.8 |
| y2 (cm), numerical model | 12.1 | 17.6 | 22.0 | 26.9 | 30.5 | 33.6 | 36.9 | 39.2 | 41.8 |
| Generated Models | |||
|---|---|---|---|
| Rectangular Slices | Semi-cylindrical Slices | ||
| R7 |  |
Y7 |  |
| R5 |  |
Y5 |  |
| R3 |  |
Y3 | 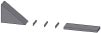 |
| R2 | 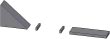 |
Y2 | 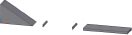 |
| R4c |  |
Y4c |  |
| R6c |  |
Y6c |  |
| R8c |  |
Y8c |  |
4. RESULTS AND DISCUSSION
Dimensionless parameters such as the relative energy loss (ΔE/E1) and the relative jump length (Lj/y1) are considered as two indicators for the good performance of hydraulic jump. The results include the water surface profiles along the centerline of the generated model, the relative energy loss, and the relative jump length due to the presence of rectangular or semi-cylindrical slices, as follows:
4.1. There are no Obstacles in the Stilling Basin (Classical Hydraulic Jump)
Fig. (4) presents the relative energy loss (∆E/E1) with the initial Froude number (Fr1) and is compared to the plot of the theoretical eq. (14) by Vischer and Hager [10].
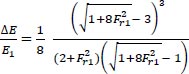 |
(14) |
Fig. (5) presents the relationship between the hydraulic jump length normalized by the supercritical depth of the jump (Lj/y1) and (Fr1), and the theoretical eq. (15) by Vischer and Hager [10] is also presented.
 |
(15) |
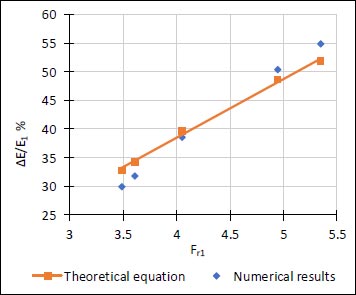
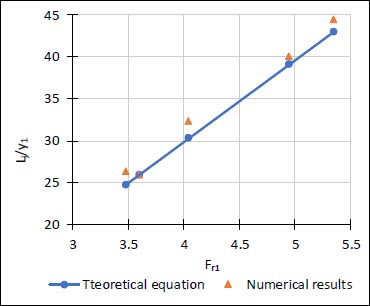
The figures showed a good agreement between the numerical data of this study and theoretical eqs., and the numerical data is fairly trusted and may be used for the analysis in this study.
4.2. Using Rectangular or Semi-cylindrical Slices followed by a Positive Step of the Same Height
In the case of using rectangular or semi-cylindrical slices and followed by a positive step with the same height, fourteen groups of runs were conducted to study the characteristics of the forced hydraulic jump. The discharge of flow and arrangement and number of slices were changed. The super-critical Froude number (Fr1) was chosen to represent the flow condition for each discharge.
4.2.1. Water Surface Profiles
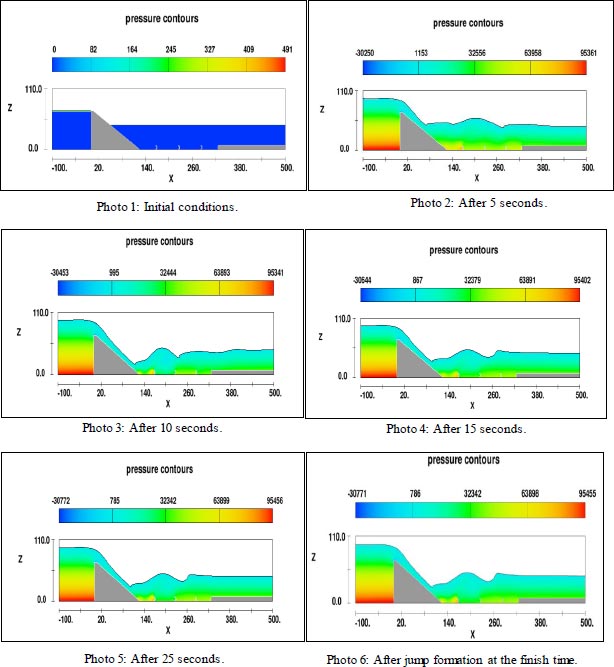
Photos (1, 2, 3, 4, 5, and 6) show examples of Flow-3D simulation at initial conditions, at different times of simulation, and after jump formation at the finish time:
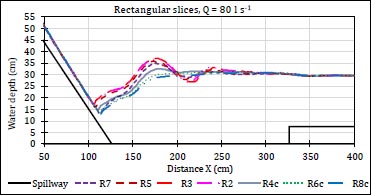
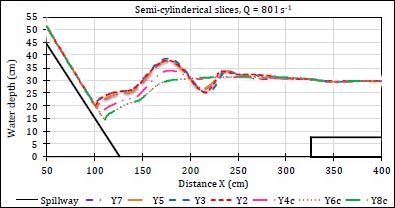
Fig. (6) shows the water surface profiles along the jump length for different cases of rectangular slices, and (Fig. 7) for different cases of semi-cylindrical slices at the same value of discharge.
It could be noted that there is a clear difference in water surface profiles between different cases of slices at the same value of discharge. The difference appears in the location of the beginning of the formed hydraulic jump, which affects the difference in its length for different cases. The flow becomes almost uniform at a distance of 350 cm from the origin of the spillway for the studied model. The water surface profiles show the fluctuation surface due to the reverse flow of water that occurs as a result of its collision with the slices, and the surface fluctuation decreases with the increase in the number of slices due to the decrease in the intensity of the reverse flow. The water surface is less turbulent in cases of perforated slices due to the reduction of the reverse flow as a result of water passage through the circular holes.
It was noted that the hydraulic jump stabilized at a time of 25 seconds from the beginning of solving the model and that the shape of the water surface at a time of 30 seconds corresponds to the shape of the water surface at a time of 25 seconds, so it was considered that the time of solving the model is 30 seconds.
4.2.2. Energy Dissipation
The energy dissipation through stilling basin (∆E/E1) is founded by estimating (E1) and (E2) which represent the energy at the upstream and downstream of the generated hydraulic jump, respectively.
 |
(16) |
 |
(17) |
 |
(18) |
Fig. (8) presents the relationship between the relative energy loss (∆E/E1) and the initial Froude number (Fr1) for comparison between the numerical results of classical hydraulic jump (CHJ) and the case of pool stilling basin without obstacles (H7.6), and Fig. (9) for four groups of the stilling basin contains rectangular slices (R2, R3, R5, and R7), and compared with the case of (H7.6).
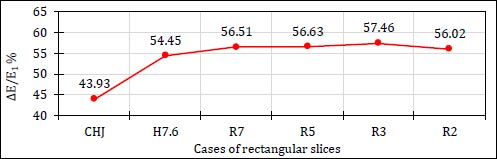
Fig. (10) illustrates the percentages of energy dissipation for different cases of solid rectangular slices and compares them with the cases of (CHJ, and H7.6) at the same value of Froude number.
The results showed that all generated models of rectangular slices have a better effect on the rates of energy dissipation than the cases of (CHJ and H7.6). The relative energy loss increases with the increase of the distance between slices until the presence of three rectangular slices, then the effect decreases. So, the case of (R3) gives maximum rates of energy dissipation in comparison with other studied cases of rectangular slices.
The presence of one positive step downstream of the spillway resulted in a specific force that reversed the direction of flow.
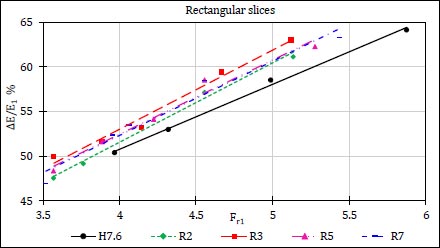
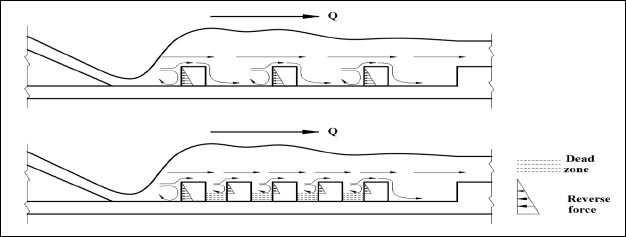
In cases of the presence of two or three continuous rectangular slices as obstacles in the stilling basin, this leads to an increase in the opposite specific force affecting the hydraulic jump and increasing the energy dissipation rates. When increasing the number of rectangular slices to five or seven, the distances between them decreased, resulting in a change in the flow direction and its inability to collide with the whole slices. This leads to forming dead zones between the slices, and the energy dissipation rates decreasing compared to the case of (R3). The distribution of flow directions can be shown in Fig. (11).
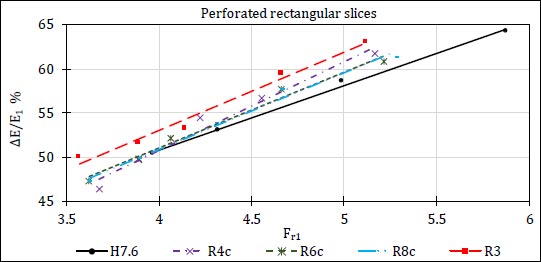
The effect of the presence of three perforated rectangular slices with different perforation ratios (25%, 37.5%, and 50%), which were named (R4c, R6c, and R8c) respectively, were studied and compared with the case of (R3) as the best case for the solid rectangular slices. Fig. (12) shows the relationship between (∆E/E1) and (Fr1) for cases of perforated rectangular slices and compared to the case of (R3).
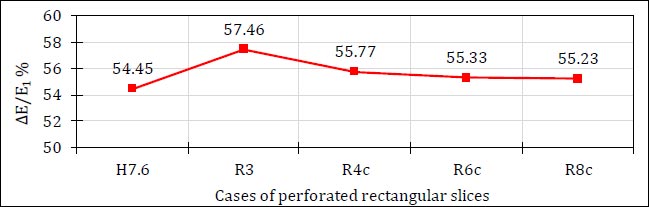
Fig. (13) illustrates the percentages of energy dissipation for different cases of perforated rectangular slices at the same value of the Froude number.
It was found that the percentages of energy dissipation decrease with the increase in perforation ratios, while the results proved that the case of three solid rectangular slices is the best.
In cases of perforated rectangular slices, the flow finds paths through the circular holes that reduce its collision with the slices, reduce the reverse flow, and reduce the resulting force as the perforation ratio increases. Fig. (14) shows the flow paths through perforated rectangular slices.
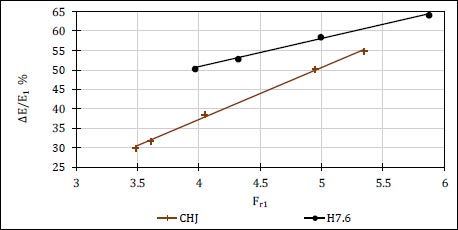
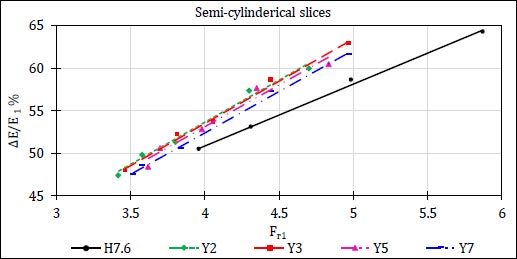
Fig. (15) presents the relationship between (∆E/E1) and (Fr1) for four groups of the stilling basin containing semi-cylindrical slices (Y2, Y3, Y5, and Y7), and compared with the case of (H7.6).
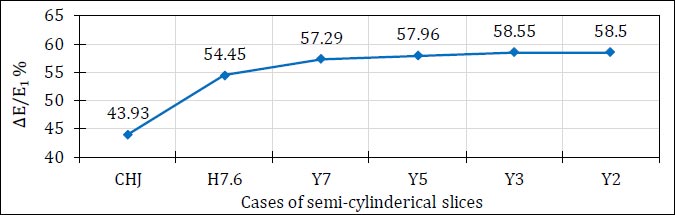
Fig. (16) illustrates the percentages of energy dissipation for different cases of semi-cylindrical slices at the same value of the Froude number.
It could be seen that they gave similar results to the cases of rectangular slices, and the case of (Y3) is the best case compared to the other cases of solid semi-cylindrical slices.
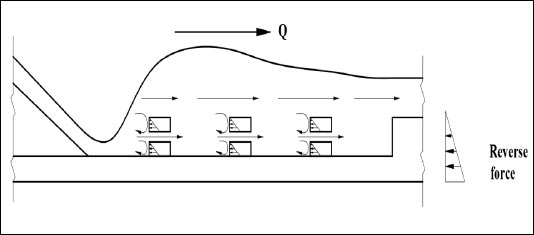
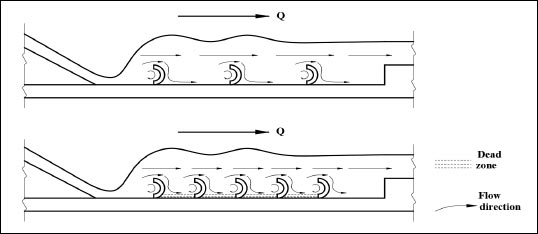
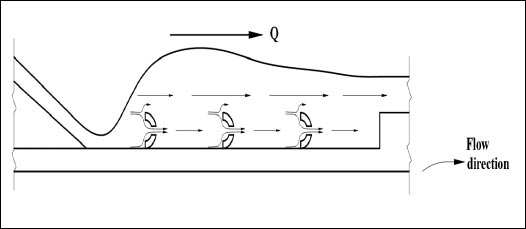
In cases of the presence of two or three semi-cylindrical slices as obstacles in the stilling basin, this leads to an increase in the opposite force affecting the hydraulic jump and increases the energy dissipation rates. For increasing the number of semi-cylindrical slices to five or seven, the distances between them decreased, resulting in a change in the path of the most amount of flow and its inability to collide with the slices completely as previously mentioned in cases of rectangular slices. The distribution of flow directions can be shown in Fig. (17).
As previously, the effect of the presence of three perforated semi-cylindrical slices with different perforation ratios (25%, 37.5%, and 50%) which were named (Y4c, Y6c, and Y8c) respectively, was studied and compared with the case of (Y3) as the best case for the solid semi-cylindrical slices. Fig. (18) shows the relationship between (∆E/E1) and (Fr1) for cases of perforated semi-cylindrical slices and compared to the case of (Y3).
Fig. (19) illustrates the percentages of energy dissipation for different cases of perforated semi-cylindrical slices at the same value of the Froude number.
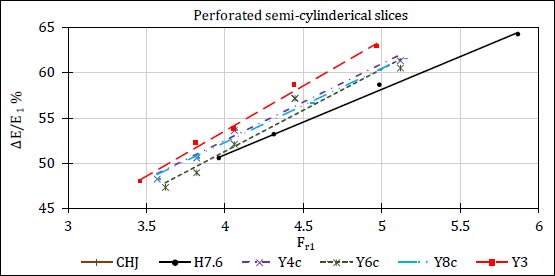
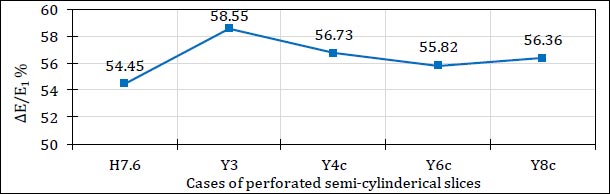
The results showed that the energy dissipation ratios decrease with the increase of perforation ratios, and the results proved that the case of three solid semi-cylindrical slices is the best.
In cases of perforated semi-cylindrical slices, the flow finds paths through the circular holes that reduce its collision with the slices, reduce the reverse flow, and reduce the resulting force as the perforation ratio increases. The flow through perforated semi-cylindrical slices is shown in Fig. (20).
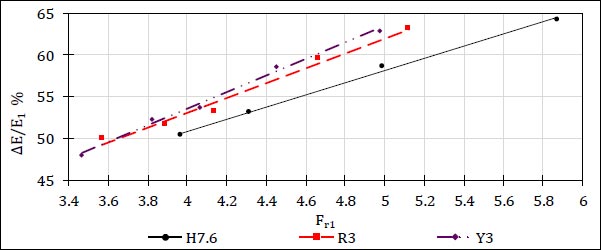
Fig. (21) shows a comparison between the results of the case of three solid rectangular slices with the case of three solid semi-cylindrical slices as the best of the previously studied cases.
It was found that the case of the three semi-cylindrical slices is the best. It indicates that models with concave surfaces make the flow change its direction and intercept the path of the hydraulic jump, and this leads to a shorter stilling basin with a stable hydraulic condition.
4.2.3. Hydraulic Jump Length
The length of the hydraulic jump in a horizontal channel is defined as the distance between the jump toe and surface maximum [16]. Hager 1992 stated that the length of a hydraulic jump cannot be easily defined in actual experiments, so it can be measured from the beginning of the jump to a point where the surface fluctuations became less violent and started to disappear [9].
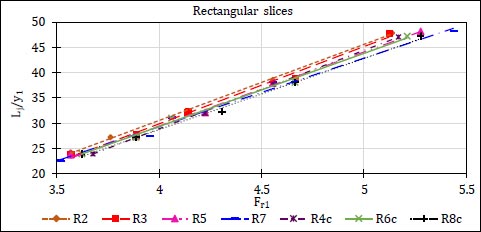
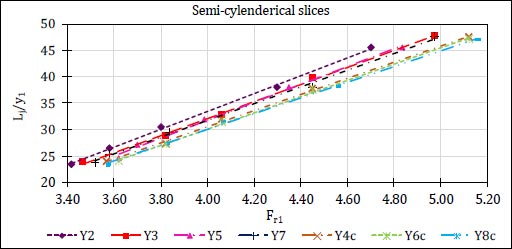
Figs. (22 and 23) present the relationship between the jump length normalized by the supercritical depth of the hydraulic jump (Lj/y1) and (Fr1) for cases of stilling basins containing different arrangements of rectangular and semi-cylindrical slices, respectively.
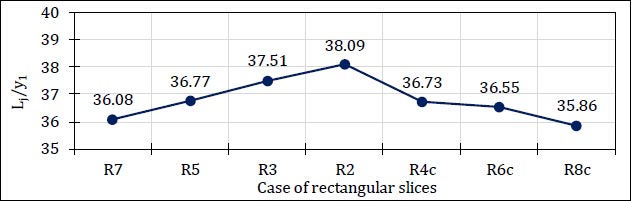
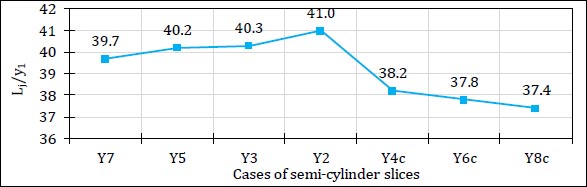
Figs. (24 and 25) illustrate the relative length of hydraulic jump for different cases of rectangular and semi-cylindrical slices, respectively at the same value of the Froude number.
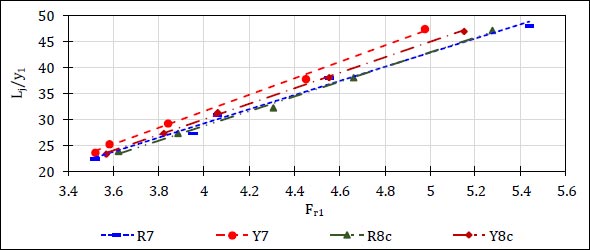
Fig. (26) presents the relationship between (Lj/y1) and (Fr1) for the cases of (R7, Y7, R8c, and Y8c) as the best cases affecting the decreasing of the hydraulic jump length from all generated models.
The results showed that the relative length of the hydraulic jump increased as the distance between solid slices increased. The case of (R7) showed the best effect on decreasing the hydraulic jump length compared to other cases of studied models.
In cases of perforated slices, the relative length of the hydraulic jump decreased as the perforation ratio increased and the case of (R8c) showed the best effect on decreasing the hydraulic jump length compared to other cases of perforated slices.
CONCLUSION
A numerical study was conducted to investigate the effect of the presence of rectangular or semi-cylindrical slices in a pooled stilling basin followed by a positive step with the same height on the hydraulic jump characteristics. Five and seventy numerical runs were carried out to study the case of (CHJ) and the cases of using slices as energy dissipators, respectively.
The study indicated the advantages of the Flow-3D software in terms of time and cost compared to laboratory experiments.
It was concluded that the numerical results for the case of classical hydraulic jump are well-matched to the theoretical eqs. of classical jump available in the literature.
The results indicated that the presence of rectangular or semi-cylindrical slices has a significant effect on improving the flow characteristics and increasing the percentages of energy dissipation while decreasing the jump length and the length of the stilling basin as a result. The energy dissipation rates decreased with the increase of the discharge value for the same case of obstacles, and this situation is in good agreement with the literature.
By comparing the effects of the different cases of the rectangular slices on the percentages of energy dissipation, it was found that the case of a stilling basin containing three rectangular slices at equal distances and followed by a positive step with the same height was better than other cases, while the case of three semi-cylindrical slices was the best case of all studied cases. The best cases of solid rectangular or semi-cylindrical slices compared with perforated slices with different ratios of perforation, while the results proved that the case of solid slices is better than the others.
The effect of the presence of different formations of obstacles on the length of hydraulic jump was also studied, and it was found that it was inversely proportional to the energy dissipation ratios.
RECOMMENDATIONS
To complete the benefit of this study, other future studies are recommended:
1. Studying the effect of the same study variables on the phenomenon of energy dissipation in the case of the presence of a gate instead of a spillway with the introduction of the immersion rate as one of the influencing factors.
2. Studying the effect of the presence of scattered baffle blocks instead of continuous slices in the stilling basin downstream of the heading-up structures on the phenomenon of energy dissipation.
3. Studying the effect of these obstacles on the phenomenon of scour downstream of the spillways and gates.
4. Using other software to determine the most accurate one to simulate the phenomenon of energy dissipation.
LIST OF ABBREVIATIONS
| Ax | = Cross-sectional area of flow in x direction (m2) |
| Ay | = Cross-sectional area of flow in y direction (m2) |
| Az | = Cross-sectional area of flow in z direction (m2) |
| B | = Width of channel (m) |
| bs | = Width of rectangular cross section slice (m) |
| Ds | = Outer diameter of semi-cylindrical slice (m) |
| E1 | = Specific energy of the supercritical flow (y1) (m) |
| E2 | = Specific energy of the subcritical flow at (y2) (m) |
| ∆E/ E1 | = Relative energy loss |
| F | = The volume occupied by air in each cell (m3) |
| Fr1 | = Upstream Froud number at initial water depth for hydraulic jump |
| fx | = viscosity acceleration in x direction (m/s2) |
| fy | = viscosity acceleration in y direction (m/s2) |
| fz | = viscosity acceleration in z direction (m/s2) |
| Gx | = Body acceleration in x direction (m/s2) |
| Gy | = Body acceleration in y direction (m/s2) |
| Gz | = Body acceleration in z direction (m/s2) |
| g | = Acceleration due to gravity (m/ s²) |
| Hs | = Spillway crest height (m) |
| hs | = Height of rectangular cross section slice (m) |
| Lj | = Length of hydraulic jump (m) |
| Lj/y1 | = Relative hydraulic jump length |
| Ls | = Length of stilling basin (m) |
| L S-1 | = liters per second |
| P | = pressure (Pa) |
| PSOR | = Mass source term |
| Q | = Discharge (m3/ s1) |
| Sc | = Spacing between semi-cylindrical slices (m) |
| Sr | = Spacing between rectangular slices (m) |
| s | = Height of positive step (m) |
| u | = The velocity component in x direction (m/ s) |
| v | = The velocity component in y direction (m/ s) |
| w | = The velocity component in z direction (m/ s) |
| vf | = The volume fraction of the fluid |
| V1 | = Upstream velocity at initial water depth for hydraulic jump (m/ s) |
| Yup | = Water depth at upstream spillway (m) |
| y1 | = Initial water depth for hydraulic jump (m) |
| y2 | = Sequent water depth for hydraulic jump (m) |
| ρ | = Density of fluid (Kg/ m3) |
| µ | = Dynamic viscosity of fluid (Pa s) |
| α | = Angle of spillway back slope |
| α1 | = Angle of positive step back slope |
| CFD | = Computational fluid dynamics |
| CHJ | = Classical hydraulic jump |
| CGS | = Centimeter gram second system of units |
| RNG | = Renormalized group |
| Vfr | = Volume flow rate |
| VOF | = Volume of fluid |
CONSENT FOR PUBLICATION
Not applicable.
AVAILABILITY OF DATA AND MATERIAL
The data supporting the findings of the article is available with in the article [16].
CONFLICT OF INTEREST
The authors declared no conflict of interest financial or otherwise.
FUNDING
None.
ACKNOWLEDGEMENTS
Declared none.

