All published articles of this journal are available on ScienceDirect.

Analysis of Aggregate Types with Micro-texture and Macro-texture Characteristics of Asphalt Mixture in Indonesia
Abstract
Background:
Micro-texture and macro-texture are two essential parameters that functionally evaluate friction on asphalt pavement surface. While micro-texture indicates the irregularity of aggregate using British Pendulum Tester (BPN), macro-texture shows the larger irregularity of asphalt mix surface using Mean Texture Depth (MTD). Both micro-texture and macro-texture contribute to increased skid resistance value, which is needed for road to meet the safety qualification.
Aim:
This study aims to investigate the effect of local aggregate types and aggregate proportion (%) on asphalt mix on pavement textures (micro and macro-texture).
Methods:
Laboratory experiments were conducted on four types of local aggregates (A, B, C, and D), which were carried from West Java, Indonesia, and aggregate has a different characteristic to each other. In addition, three asphalt mix types (SMA-fine, AC-WC, and HRS-WC), each containing varying proportion (%) of aggregates, were investigated to analyze change in texture on asphalt mix surface. Statistical analysis with two-way ANOVA was carried out to investigate the significance of aggregate type and asphalt mix type on pavement surface.
Results:
The results showed that each aggregate exhibited different characteristics chemically and mechanically. Four types of local aggregate possessed distinctive characteristics for the asphalt mix performance (i.e., OAC and density) and pavement textures. Statistically, it was clearly found that both aggregate type and asphalt mix type were strongly related to pavement texture.
Conclusion:
Therefore, the aggregate type and asphalt mix type with varying aggregate proportions (%), such as coarse aggregate (CA), aggregate-fine (FA), and filler (FF), affect the micro-texture and macro-texture.
1. INTRODUCTION
Road is one of the supporting infrastructures required for the movement of people and goods from the origin to the destination. At this point, roads must be well-designed for the comfort and safety of road users and to reduce the rate of traffic accidents. Many factors contribute to traffic accidents,i.e., road geometry, vehicle conditions, pavement conditions, and weather [1-6]. A high rate of traffic accidents occurs when the road surface is wet and slippery [7-10], leading to wheel slip easily; therefore, special attention is given to pavement surfaces to reduce traffic accident rate by increasing skid resistance, which is one of the safety conditions [11-13] [9]. Based on functionality, skid resistance has a strong relationship with pavement texture. It is defined as the endurance of pavement texture toward friction between wheels and pavement surface, either flexible or rigid surfaces when a vehicle brakes on a straight or curve road. Meanwhile, the pavement texture describes a surface condition that relates to traffic safety [5, 14, 15]. The pavement texture is defined as the irregularity of asphalt pavement surface [16], in which pavement texture based on wavelength can be classified into four categories, i.e., micro-texture (< 0.5 mm), macro-texture (0.5-50 mm), mega-texture (50 mm-500 mm), and unevenness [17, 18]. Pavement textures relating to friction on the surface are micro-texture and macro-texture [19, 20]. Micro-texture describes the mineralogy of aggregate and the roughness of aggregate texture itself, while macro-texture describes the texture of the asphalt mixture surface [21, 22]. Moreover, micro-texture influences the friction between wheels and the pavement surface at low speed; meanwhile, macro-texture takes place due to friction at higher speed [23, 24]. Pavement texture changes as time goes by due to temperature, moisture, traffic load [25], and the type of vehicles that frequently pass, which has the potential to change the functionality of pavement texture. Aggregates with different characteristics, quality, strength, and durability can affect the performance of the asphalt mix [26-28]; in this case, every region requires different aggregates [29]. Thus, it is important to evaluate aggregate morphology caused by degradation [30], for example, through the abrasion experiment, micro-deval ACV, and AIV. Macro-texture relies on the performance of asphalt mix [31], which consists of aggregate materials and asphalt. These contents contribute to the formation of asphalt mix texture. By considering types, maximum size, characteristic and composition of aggregates [32], surface pavement texture of asphalt with higher skid resistance is obtainable; therefore, no vehicle experiences slippery in wet surface condition. There are more than 90% aggregates in asphalt mix [33]; thus, the selection of good aggregate is necessary regarding its effects on asphalt mix [19]. In addition to asphalt pavement texture, gradation is considerable; for example, the mixture with coarser aggregate makes the pavement surface texture rougher than the one with less coarse aggregate.
This study used aggregate from four locations and three asphalt mixtures (SMA-Fine, AC-WC, and HRS-WC) with similar maximum aggregate size, i.e., 12.5 cm, but different aggregate compositions (gradation). The purpose was to investigate whether the aggregate with different characteristics affects the asphalt mixture, or the aggregate composition (gradation) has more impact on the texture, and or both.
2. MATERIALS AND METHODOLOGY
Aggregates used in this study were Andesite and Basalt, obtained from four locations, i.e., Karawang (Aggregate A), Cimahi (Aggregate B), Sumedang (Aggregate C), and Subang (Aggregate D). A 60/70 shell asphalt was used as a binder in the asphalt mixture. Three hot mix asphalts were used for micro-texture and macro-texture testing, including SMA-fine, AC-WC, and HRS-WC, to determine the texture differences on the surface of the asphalt mixture. This research method is experimental in the laboratory. The first step is to test the properties of aggregate and asphalt. The second step is to make a mixture of hot mix asphalt SMA-Fine, AC-WC, and HRS-WC with the four aggregates. The third step is to make a hot mix asphalt based on the OAC and density values for each aggregate and asphalt mixture used. The fourth step is to perform micro-texture and macro-texture tests on the surface of the asphalt mixture. Additionally, aggregate type and asphalt mix type were statistically analyzed using two-way ANOVA to investigate their relationship to pavement textures.
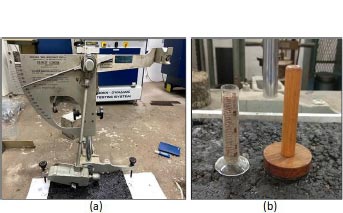
The equipment used for friction pavement testing (micro-texture and macro-texture) included the British Pendulum Tester (BPT) and Sand Patch (Fig. 1).
3. RESULTS AND DISCUSSION
3.1. Aggregate Property Tests
This test was carried out to determine the strength and durability of aggregates with different characteristics. In this study, used aggregates were locally taken from four different locations spread over West Java, Indonesia. They were aggregate A (98.93 km), aggregate B (18 km), aggregate C (69 km), and aggregate D (132.1 km). In initial testing, aggregates were chemically and mechanically tested to identify aggregate characteristics in detail since sampling was done at different locations.
Minerals were tested to determine the chemical elements present in aggregates through X-ray fluorescence spectrometry (XRF) testing at the hydrogeology and hydrogeochemistry laboratory of FTTM ITB. Nearly all aggregates have the same chemical elements but different percentages of chemical elements, and silica (SiO2) was the most dominant chemical element found in the aggregate.
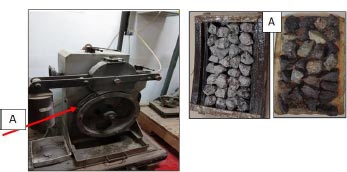
Aggregate durability testing was carried out through an aggregate shape conservation test, which showed the aggregate's resistance to deformation due to a solution of magnesium sulfate. This test was carried out for 5 (five) days. Aggregate mechanical testing, called aggregate abrasion testing, used a Los Angeles machine tool to determine the aggregate's resistance to the impact of steel balls for 500 rounds. Almost all aggregates have abrasion resistance stated in the 2018 General Specifications for Roads and Bridges of Highways 2018 revision 2. The polishing test was used to determine the resistance of aggregates to polishing using a polishing stone machine (Fig. 2) with a duration of 6 hours. This test referred to the British Standard [34]. The result of the aggregate testing is mentioned in Table 1.
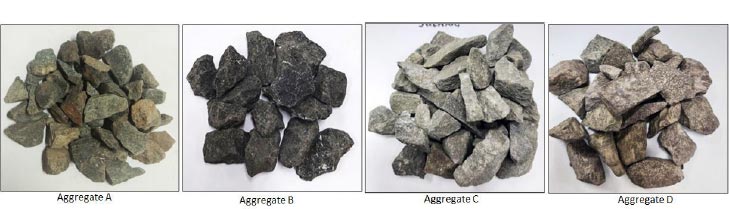
Table 1 presents the aggregates originating from the four locations with different aggregate characteristics. The easiest initial identification is through color (Fig. 3). There were differences in the chemical element content of each aggregate. Through the results of the XRF test, the chemical element contents in each aggregate were different with the order: SiO2 > Al2O3 > Fe2O3, while the other elements have different percentages of chemical element content. The high silica content (SiO2) indicated a hard aggregate. Aggregate D has high silica content with abrasion of 12,11%, showing that it is more resistant to wear and tear compared to other aggregates.
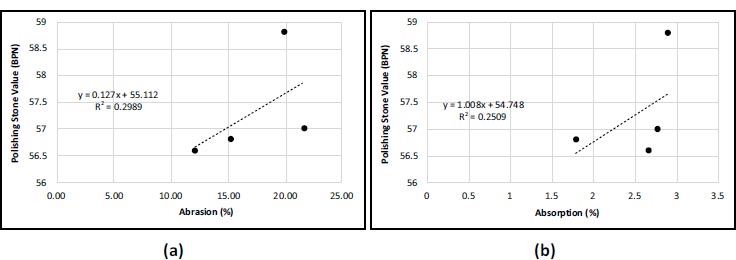
The relationship of aggregate wear (abrasion) to polishing is proportional. The higher the Los Angeles value, the higher the polishing value [29]. As hard aggregate tends to be denser, the voids in the aggregate texture are small, and the type of aggregate tends to be more slippery (small PSV). High aggregate absorption has a high polishing value as well [29] because these aggregates have large voids and greater absorption. The relationship between PSV (BPN) to abrasion (%) and absorption (%) can be seen in Fig. (4).
| S.No. | Information | Aggregate Types | |||
|---|---|---|---|---|---|
| A | B | C | D | ||
| 1 | Origin | Karawang | Cimahi | Sumedang | Subang |
| 2 | Color | Light grey | Dark grey | Dark grey | Dark brown ridded |
| 3 | Chemical elements (%) | ||||
| - SiO2 | 56,5 | 47,4 | 52,4 | 57,4 | |
| - Al2O3 | 20,5 | 17,5 | 21,4 | 18,5 | |
| - Fe2O3 | 10,2 | 10,7 | 8,34 | 8,76 | |
| - CaO | 6,93 | 9,93 | 10,2 | 5,73 | |
| - MgO | 2,44 | 10,5 | 2,95 | 0,911 | |
| - Others | < 2 | < 2 | < 2 | < 2 | |
| 4 | Property tests | ||||
| - Specific gravity | 2,635 | 2,559 | 2,666 | 2,593 | |
| - Absorption (%) | 1,791 | 2,904 | 2,77 | 2,661 | |
| - Abrasion (%) | 15,22 | 19,89 | 21,67 | 12,11 | |
| - Soundness (%) | 1,01 | 4,94 | 3,67 | 1,87 | |
| - PSV (BPN) | 56,8 | 58,8 | 57 | 56,6 | |
A higher abrasion value indicates that the resistance of aggregate against abrasion decreases. Aggregate B is less resistant to abrasion than other aggregates, but it is highly resistant to polishing. Due to its porous texture, this aggregate has great absorption and greatly impacts asphalt content. Since the testing of aggregate properties was done with random aggregate sampling, for accurate results, the testing was done multiple times.
3.2. Hot Mix Asphalt Test
The mineralogical content of aggregates impacts the durability and performance of the asphalt mixture [35, 36]. This study introduced three types of asphalt mixtures with different aggregate proportions (%). For hot mix asphalt types, SMA-fine asphalt mixture used coarse gradations, and AC-WC used continuous gradation, whereas HRS-WC was set with fine gradations. The percentage proportions of coarse aggregate (CA), fine aggregate (FA), and filler (FF) are presented in Table 2. Asphalt shell with the mixture temperature of 156oC and compaction temperature of 145oC was used as binder in hot mix asphalt.
| Aggregate Compositions | Asphalt mixture types | ||
|---|---|---|---|
| SMA-fine | AC-WC | HRS-WC | |
|
Coarse Aggregate (CA), % Aggregate-fine (FA), % Filler (FF), % |
72,5 18 9.5 |
39 55 6 |
20 72 8 |
Marshall method was chosen to evaluate the performances of asphalt mixture, such as optimum asphalt content (or OAC) and density for each aggregate, as mentioned in Table 3. The characteristics of aggregates showed the effects on the performance of the asphalt mixture; even a similar aggregate composition was used in an individual asphalt type. Greater aggregate absorption employed a large asphalt content. As mentioned in Table 1, aggregate B has the greatest absorption among other aggregates. Owing to this unique characteristic, the exploitation of aggregate B in the hot mix asphalt, therefore, resulted in higher optimum asphalt content. Despite the content, density plays a role in asphalt mixture performance, and its values vary depending on the aggregate types in the asphalt mixture. For instance, high asphalt content has a poor density due to the excessive bonding between aggregate and asphalt.
| Aggregate Types | Asphalt Mixture Types | ||
|---|---|---|---|
| SMA-Fine | AC-WC | HRS-WC | |
| Optimum Asphalt Content, OAC (%) | |||
| Aggregate A Aggregate B Aggregate C Aggregate D |
6,55 7,15 6,7 6,5 |
5,3 6,28 5,45 5,7 |
7,35 9,5 7,5 7,75 |
| - | Density (gr/mm3) | ||
| Aggregate A Aggregate B Aggregate C Aggregate D |
2,318 2,255 2,335 2,312 |
2,36 2,28 2,36 2,31 |
2,296 2,204 2,254 2,310 |
3.3. Micro-texture and Macro-texture Testing on Hot Mix Asphalt
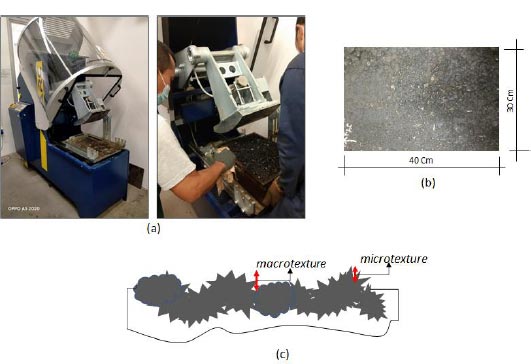
Skid resistance in the asphalt mixture is determined by two imperative parameters: micro-texture and macro-texture. On pavement, micro-texture and macro-texture depend primarily on the size and gradation of aggregates, aggregate mineralogy, voids on the surface, and pavement type [1]. While micro-texture describes the irregularity of the aggregate surface, macro-texture portrays an uneven asphalt mixture on a larger scale on the surface. Micro-texture and macro-texture evaluation were carried out by designing sample testing based on the OAC and density values of aggregate for each asphalt mixture. The compaction tool for test specimens was equipped with a 30 x 40 x 10 cm specimen-size roller compactor, as shown in Fig. (5a and 5b). The differences in micro-texture and macrotexture on the surface of the asphalt mixture are shown in Fig. (5c).
3.3.1. Micro-texture
Micro-texture represents the texture of the aggregate in the asphalt mixture. It was tested using a British Pendulum Tester (BPT) and was expressed by British Pendulum Number (BPN). BPN is known when the pendulum swing of the BPT tool reaches the pavement surface, and the measurement was done up to 5 times for accuracy. The differences in texture were less found in measurement. When varying aggregates were tested using the BPT tool, there were only insignificant differences in BPN values.
SMA-fine hot mix asphalt employed dominantly coarse aggregate up to 72,5%; hence, SMA-fine has a rougher pavement texture. The roughness of asphalt pavement surface resulted from the arrangement of aggregate and asphalt as the binder, where voids were formed on the surface. SMA-fine has higher BPN values than AC-WC and HRS-WC. Aggregate D in SMA-Fine mix asphalt has greater BPN values, followed by other aggregate types. The order was aggregate D > aggregate C > aggregate A > aggregate B.
Otherwise, HRS-WC hot mix asphalt differed from SMA-fine because it has a smoother pavement texture due to approximately 80% of fine aggregate. This type possessed tiny voids with lower BPN values compared to SMA-fine and AC-WC. The texture of HRS-WC was not appropriate for the asphalt mixture and contributed to decreasing skid resistance values. HRS-WC hot mix asphalt with different aggregates was ordered based on BPN values: aggregate A > aggregate C > aggregate D > aggregate B.
A suitable asphalt mixture in this experiment was AC-WC because it has a balance in aggregate composition with continuous gradation. BPN values were between SMA-Fine and HRS-WC. On the other hand, the forming micro-texture was satisfied. Aggregate C in AC-WC mix asphalt contributed to higher BPN values, followed by aggregate D, aggregate A, and aggregate B.
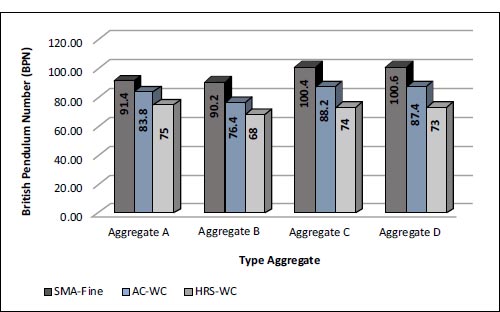
Each asphalt mix type, such as SMA-Fine, AC-WC, and HRS-WC, using aggregate B exhibited the lowest BPN values because this aggregate has poorer quality. Owing to high absorption, asphalt covering aggregate was greater, and the performance of asphalt mix and micro-texture was affected. Varying BPN values of aggregates A, B, C, and D indicating the shape and size of the aggregate were considerable. Thus, aggregate type in asphalt mixture clearly impacted micro-texture with even minor changes in BPN values. The micro-texture test is shown in Fig. (6).
3.3.2. Macro-texture
Macro-texture was evaluated to determine the non-uniformity of asphalt pavement texture, expressed by Mean Texture Depth (MTD). The main factors contributing to macrotexture were aggregate mineralogy, gradation, asphalt content, and pore volume in the asphalt mixture [24]. This study analysed the effect of aggregate type, asphalt mix type (gradation), and optimum asphalt content in each asphalt mixture. Macro-texture test used the sand circle method and a volume of 20 ml sand, which refers to British Standards (BS EN 13036-1:2010), with the Eq. (1):
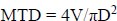 |
(1) |
Where:
V = Sand’s volume (mm3)
D = Diameter (mm)
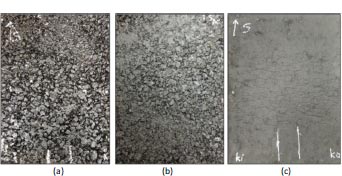
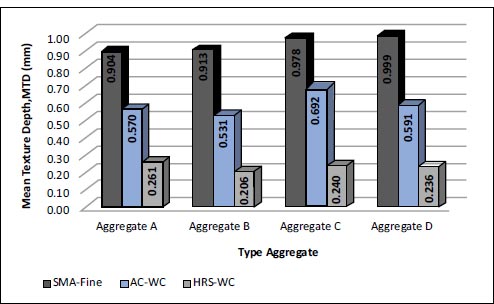
The proportion of aggregate for each aggregate mix gradation includes coarse aggregate (CA), fine aggregate (FA), and filler fraction (FF), as mentioned in Table 3. Three asphalt types (SMA-Fine, AC-WC, and HRS-WC) represent three gradations of different aggregate mixtures (coarse-textured gradation, continuous texture, and fine-texture gradation). Hence, three aggregate mix gradations have a large impact on changes in asphalt pavement texture, as shown in Fig. (7).
Aggregate proportions in SMA-Fine hot mix asphalt were 73% of coarse aggregate, 18% of fine aggregate, and 9.5% of filler. The amount of coarse aggregate led to the forming of large voids, rougher pavement surface, and higher MTD values compared to other asphalt mix types (AC-WC and HRS-WC). SMA-Fine using aggregate D was the greatest contributor to MTD values, followed by aggregate C, aggregate B, and aggregate A. The minor differences in MTD values between aggregates and SMA-fine indicated their effects.
AC-WC hot mix asphalt with a balanced proportion of course and fine aggregate has a uniform aggregate size. Thus, the texture in AC-WC was smoother than SMA-fine because the voids were reduced. Based on MTD values, aggregates in AC-WC were insignificantly different with the order: aggregate C > aggregate D > aggregate A > aggregate B. Similar to SMA-fine, there were differences in MTD values in AC-WC. Moreover, HRS-WC hot mix asphalt with a 20% coarse aggregate features a smooth pavement surface and less void. The MTD values in this type vary with order: aggregate A > aggregate C > aggregate D > aggregate B.
| Source | Type III Sum of Squares | df. | Mean Square | F | Sig. |
|---|---|---|---|---|---|
|
Corrected Model Intercept Type Aggregate Type Mixture Type Aggregate* Type Mixture Error Total Corrected Total |
6634.983a 421514.017 615.650 5664.933 354.400 270.000 428419.000 6904.983 |
11 1 3 2 6 48 60 59 |
603.180 421514.017 205.217 2832.467 59.067 5.625 |
107.232 74935.825 36.483 503.550 10.501 |
.000 .000 .000 .000 .000 |
| Source | Type III Sum of Squares | df | Mean Square | F | Sig. |
|---|---|---|---|---|---|
|
Corrected Model Intercept Type Aggregate Type Mixture Type Aggregate* Type Mixture Error Total Corrected Total |
5.402a 23.254 .092 5.252 0.58 0.29 28.685 5,431 |
11 1 3 2 6 48 60 59 |
0.491 23.254 0.031 2.626 .010 .001 |
811.560 38427.018 50.72 4339.199 16.098 |
.000 .000 .000 .000 .000 |
A macro-texture review exemplified that comparison of aggregate proportion (CA, FA, and FF) has more impact on MTD value than aggregate type. As shown in Fig. (8), there was a significant difference in MTD values between asphalt mix type SMA-fine, AC-WC, and HRS-WC. However, only small changes were found when different types of aggregate (A, B, C, and D) were used in the same asphalt mix type.
High asphalt content was affected by aggregate absorption and aggregate proportion (%) or gradation in each asphalt mix. Consequently, the texture of the asphalt pavement surface became smaller pores, as well as the values of MTD and BPN decreased. Therefore, asphalt was used appropriately in the asphalt mixture. Since asphalt is a proper binder, this material prevents aggregate bonding from being broken or separated. The surface texture of asphalt mix is a part of the pavement that directly deals with traffic load on it. At this point, tear takes place on the surface texture of the pavement at a certain time, and the adhesion between asphalt and aggregate becomes weaker. Consequently, aggregate particles work for a certain time until the resistance of an aggregate to polishing or PSV values decreases. Understanding the importance of aggregate characteristic, gradation, and asphalt mix design in an attempt to gain the surface texture of asphalt mixture, including micro-texture and macro-texture, lead to proper friction that increases safety for the driver.
3.4. Statistical Analysis with Two-Way ANOVA on Micro-texture and Macro-texture
Based on the various experimental results described above, aggregate type and asphalt mix type influence the texture, both macro and micro, of pavement structure. This study analyzed these two variables statistically using two-way ANOVA to determine their relationship with pavement textures and how much degree aggregate type correlates with asphalt mix. P-values were used as a criterion in decision-making on the observed variables, in which the significance value, which is typically expressed with α = 0,05, was used in the analysis.
Tables 4 and 5 present the results of statistical analysis conducted on aggregate type and asphalt mix type against BPN (Micro-texture) and MTD (Macro-texture) using two-way ANOVA. P-values from all sources in each table were less than 0.05 (Sig. < 0.05), indicating that either aggregate type or asphalt mix type was valid and significant on BPN and MTD measurement. Furthermore, a strong interaction was observed between aggregate type and asphalt mix type.
As expected, all these results were in alignment with previous experimental analyses, presented in 3.3.1 and 3.3.2, in which the higher the Mean Texture Depth (MTD), the higher the British Pendulum Number (BPN). Hence, the texture becomes coarser and has an increased skid resistance.
CONCLUSION
In this study, it has been observed that aggregate from different locations has different aggregate characteristics in regard to the composition of the chemical elements contained in the aggregate. Nearly all aggregates have SiO2, which is the most dominant element. Aggregates with high SiO2 tend to be hard and dense, resistant to abrasion tests, and less resistant to polishing. For example, in the abrasion test, aggregate D accounted for 12.11% lower resistance than aggregate B, which resulted in 19.89%. In contrast, aggregate D has a poor resistance against polishing with a BPN value of 56.6, which was lower than aggregate B with a BPN value of 58.8. Nonetheless, the difference in aggregate properties can be predicted based on colour, which is not typically used to investigate an aggregate characteristic.
Differences in aggregate characteristics largely affect the performance of hot mix asphalt, especially optimum asphalt content and density in each aggregate in different hot mix asphalt. High absorption aggregate typically has more OAC and less density in the same asphalt mix type. For example, aggregate B has the highest OAC (7.15%) and lowest density (2.255 gr/mm3) in the same asphalt mix type. A similar case occurred in asphalt-type AC-WC and HRS-WC.
The percentage proportion of the aggregate in an asphalt mixture has a greater effect on macrotexture or pavement texture because of variations in the aggregate proportion, including coarse aggregate (CA), fine aggregate (FA), and filler fraction (FF). When coarse aggregate was used, the asphalt mix tended to have a rough texture and the voids were largely formed. Hence, BPN values in micro-texture and MTD values in macrotexture were high. MTD values in order are SMA-fine > AC-WC > HRS-WC, and this trend was observed with increased BPN values.
Aggregate type has an impact on micro-texture and macro-texture, displayed by BPN and MTD values with minor differences in the same asphalt mix type.
Two-way ANOVA indicated the strong interaction between two variables (aggregate type and asphalt mix type) and pavement textures, with a p-value of no more than 0.05 (P < α). This result is relevant to laboratory experiments conducted.
LIST OF ABBREVIATIONS
| CA | = Coarse Aggregate |
| FA | = Fine Aggregate |
| FF | = Filler Fraction |
| MTD | = Mean Texture Depth |
| BPN | = British Pendulum Number |
AVAILABILITY OF DATA AND MATERIAL
The materials applied, including aggregates, originated from West Java, Indonesia. The experiment was carried out in the Tansportation and road engineering laboratory at Bandung Institute of Technology.
ACKNOWLEDGEMENTS
Declared none.

