All published articles of this journal are available on ScienceDirect.

Effect of Perforated Sills on Maximum Scour Depth Downstream From a Sluice Gate
Authors Info & Affiliations
Abstract
Aims:
Experiments were conducted to study the effect of using a perforated sill on maximum scour depth downstream from a sluice gate.
Background:
Previous studies have shown that screens may be utilized efficiently for dissipating the energy of water downstream of a hydraulic structure.
Objective:
For the present study, a series of experiments was conducted to investigate the effect of using a perforated screen sill on the maximum scour depth downstream of a hydraulic structure.
Methods:
In the present study, a single perforated sill with varying porosity (10.3%, 18.3%, 28.5%, and 41.1%) and an inclination angle of 90° were used. Perforated sill with different shapes of holes (circular, rectangular, and square holes) was used during the study. The major parameters for the present study are the porosity of the perforated sill, different shapes of holes, downstream water depth, and the Gate Froude number (FG) for a range covering from 2.15 to 4.7. The gate opening simulating a hydraulic structure is adjusted at heights of 4 cm, 5 cm, and 6 cm during the experiments work.
Result:
The results revealed that an increase in the sill porosity (Ao/As) increases the screen effect to reduce the max scour depth. In addition, the results showed that the sill with square holes is better than the sill with circular and rectangular holes in reducing the maximum scour depth.
Conclusion:
The perforated sill with a square porosity of 41.1% reduces the maximum scour depth downstream of a sluice gate by 60%.
1. INTRODUCTION
The problem of scour downstream heading up structures is one of the most important problems that has received great attention from researchers. Because of its direct impact on the stability of the structures, where the scour downstream, the stilling basins empty the soil under its base which leads to failure. That leads to great damage or possibly sudden collapse, causing significant financial losses. Thus, the scour and energy dissipation have captured scholars' interest for many years. It is a highly complicated topic to study the downstream local scour process because it depends on a number of variables connected to the heterogeneity of the bed soil and the flow conditions that cause the erosive action [1]. The initial, development, and equilibrium stages of scouring are the three observable stages of scouring in a normal scouring process. A quick rate of scouring is characteristic of the early stage, a relatively slower rate of scouring is characteristic of the development or erosion stage, and an equilibrium stage, where variations in the scour depth following a lengthy scouring duration are undetectable [2]. A typical engineering approach is to build a strong apron downstream of the structures to reduce the impact of erosion from the structures, protecting them from failure due to the scouring action. Different methods have been used to decrease the local scour downstream sluice gates. Rajaratnam [3] studied the erosion caused by submerged plane-wall jets of air and water on beds of sand and polystyrene. Melville [4] studied scour at various hydraulic Structures: sluice gates, submerged bridges, low weirs. Mahmoud et al. [5] investigated the effect of different shapes of holes on energy dissipation through perpendicular screen. Sadeghfam et al. [6] studied the performances of screens in watercourses are investigated for dissipating energy of supercritical flows, capable of inducing scour or stabilising hydraulic jumps. Abbaspour et al. [7] studied experimentally screens with square holes and a porosity of 50%. In comparison to screens with an adverse slope of 0.015, those with an adverse slope of 0.025 dissipated more energy. Compared to screens with a single arrangement, those with a double layout displayed higher performance and used more energy. The effectiveness of screens in a sudden, expanding stilling basin for energy dissipations under the influence of the submerged hydraulic jump was investigated by Elaswad et al. [8]. According to their results, the best screen location was at 0.25 of the abutment lengths with a 0.285 relative screen area, which led to the highest energy loss with the lowest tailwater depth and submerged hydraulic jump length. Zhang et al. [9] conducted a clear-water scour experiment at a submerged weir. The submerged weir alters the mean flow significantly, forming a high-velocity zone above the weir and a vortex system near the scoured bed. As the scour develops, the high turbulence intensity zone and the high near-bed Reynolds shear stress zone both get closer to the upstream slope, and further away from the downstream slope of the scour hole. At the equilibrium stage, sediment travels in a recirculating fashion, preventing the scoured hole from expanding further. Xie and Lim [10] investigated the effects of jet flipping on local scour downstream of a sluice gate. Nik and Narayanan [11] carried out experiments for the effect of sand sizes, sluice openings, efflux velocities, and lengths of aprons on the local scour downstream of an apron. Ibrahim [12] studied the impacts of block shapes on the flow pattern downstream of a radial gate. Valinia [13] investigated the effect of floor blocks and block spacing from the drainage duct under different flow conditions on scouring downstream of the resting basin. Moghadam et al. [14] evaluated the effects of a perforated sill and its position on the length of a favourable B-type hydraulic jump in a stilling basin. Pagliara and Palermo [15] examined the scour downstream of a block ramp for non-uniform bed material, and the effect of sills was investigated. The sediment distribution of non-uniform bed mixtures is investigated at the scour equilibrium configuration. It was observed that the sediment is more uniformly distributed in the upstream portion of the scour hole close to the ramp exit and that the coarsest particles are displaced in the central region of the scour hole. Pagliara et al. [16] studied the effect of the ramp slope and the geometry of the expanding stilling basin on the local scour and the hydraulic jump. Oliveto et al. [17] investigated the temporal evolution of local scour downstream of a spillway followed by a positive-step stilling basin. Recently, numerous researchers used numerical models to forecast the scour features downstream sluice gate. Mirzaei et al. [18] vestigated the effect of the cylindrical deflectors over the end sill on minimizing or eliminating scour downstream of a stilling basin. Guan et al. [19] used artificial neural networks with a backpropagation learning algorithm to estimate the temporal variation of scour profiles downstream of submerged weirs under clear water conditions. Mostaani and Azimi [20] evaluated a new analytical method for predicting the scour profile downstream of a submerged sluice gate with an apron. Aamir et al. [21] investigated the effect of a rough, rigid apron on scour downstream of sluice gates. Samma et al. [22] investigated the complex fluid-sediment interactions that influence the development of the scour hole and ridge systems downstream of a near-bottom jet using a three-dimensional (3D) flow simulation. They pointed out that the numerical model accurately reproduces the geometric characteristics of the scour hole. The model, however, overestimates the extent of the scour hole. The model, however, overestimates the extent of the scour hole. Sharafati et al. [23] proposed several novel hybrid adaptive neuro-fuzzy inference system (ANFIS) methods as predictive models to estimate scour depth downstream of a sluice gate. Yousif et al. [24] examined the applicability of a modern data-intelligence technique known as extreme learning machines (ELM) to simulate scour characteristics. They mentioned that applying ELM with non-dimensional data can provide good accuracy when modeling complex hydrological problems. Najafzadeh et al. [25] studied the effects of influencing parameters on the scouring process in order to derive an accurate predictive equation of local scour depth downstream of a sluice gate. Najafzadeh [26] used a method of data handling to predict the maximum scour depth downstream of grade-control structures. Ibrahim et al. [27] used nanomaterials (Silica fume) to minimize the local scour downstream of the sluice gate. According to the percentage of silica fume, they explained that the wet mix successfully decreased local scour volumes by 34.65% and 83.05% and decreased silting volumes by 33.35% and 89.42%. From the previous study review, it was found that one of the most effective ways to reduce scour is to focus on the method of dispersing using perforated sills. The study's main aim is to study the effect of using a perforated sill (with different porosities and different hole shapes) on the maximum scour depth and the energy dissipation in the presence of a mobile bed using experimental data and the development of theoretical equations.
2. EXPERIMENTAL SET-UP
2.1. Experimental Flume
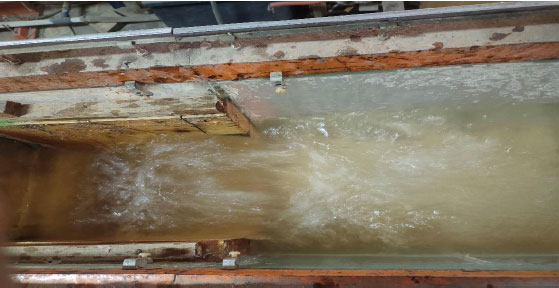
The tests were carried out in the water and hydraulics engineering laboratory at the Faculty of Engineering, Zagazig University, Egypt. A re-circulating flume 0.30 m wide, 0.468 m deep, and 15.6 m long, with a working section of 12.50 m as shown in Fig. (1). Water is lifted from a sump tank to the flume inlet by a centrifugal pump. The flume discharge is measured with a calibrated orifice meter. To adjust the tailwater depth, gradually tighten the tailgate until the desired depth is reached. The water levels were measured with ± 0.1 mm accuracy using a point gauge.
2.2. Perforated Sill Models
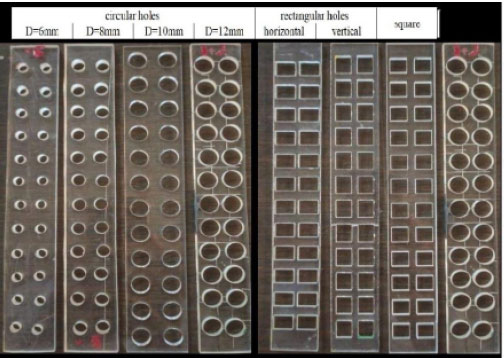
The material used for the perforated sills is clear Perspex, which is chosen for its easy handling properties, then placed at a distance of 10 cm from the gate in a sudden expanding stilling basin with a constant expansion ratio (e=1.35) downstream the vertical gate [28]. The perforated sill with a width of 22 cm and a height of 3 cm, varying porosity (10.3%, 18.3%, 28.5%, and 41.1%), and an inclination angle of 90° were used to investigate the impact of perforated sill porosity on the maximum scour depth, which is achieved by three types of holes: circular (0.60, 0.80, 1.0, and 1.2 cm) diameter holes; rectangular and square holes are equal areas of the 1.2 cm diameter circular holes arranged by a uniform mesh as shown in Fig. (2). The thickness of the perforated sills is 0.3 cm.
2.3. Bed Material
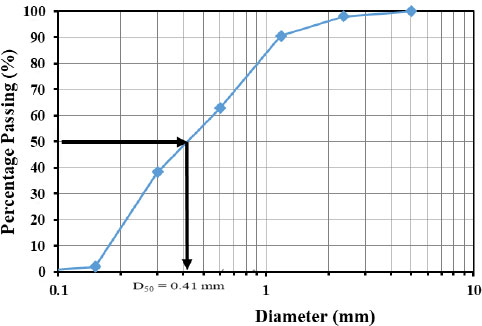
The bed material used in this study was analyzed by carrying out a mechanical sieve analysis test. The sieve analysis test is a method that is used to determine the grain size distribution of soils that are greater than 0.075 mm in diameter. The sieves used in this method are made of woven wires with square openings. The bed material was fine sand to simulate the movable bed, which had a grain median size of d50 = 0.41 mm, and a standard deviation of ϭg = 2.38, as shown in Fig. (3).
2.4. Experimental Procedure
For each experiment, the flow discharge, hydraulic jump length, and water depths were measured. The flow discharge ranged from 10 to 16 l/s and had a constant submergence ratio of (S= 2). About 90 runs were conducted, including 9 runs for a sluice gate with a submerged hydraulic jump without any modifications (i.e., case of no sill) for comparison. The case of no sill was considered a base case to check the effect of the sill with different relative porosity on the max scour depth downstream of a sluice gate. After building every experiment, the flume channel was filled with bed material (sand), accurately leveled and the leveling accuracy was measured by a point gauge. The following steps were done for each experiment:
1. Start back water feeding to the flume until it reaches the required tail water depth by closing the tail gate.
2. The control valve of the pump was opened gradually until the required discharge passed into the flume,
3. The discharge was measured by using an orifice meter fixed on the pipe of the flume,
4. The tail gate was screwed gradually until the required downstream water depth arrived using the point gauge,
5. After 2 hours (where there is no change in bed profile), the pump was turned off.
6. The flume and the scour hole were drained from the water slowly, the scour depths and lengths were measured using a point gauge.
3. DIMENSIONAL ANALYSIS
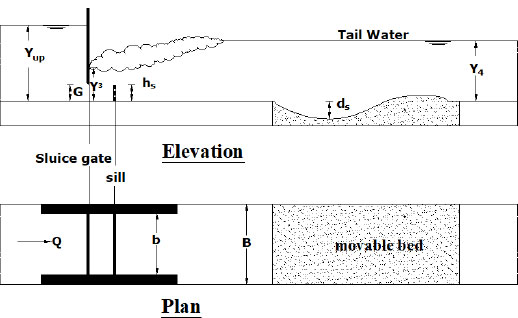
To be able to study the effect of the perforated sill on the maximum scour depth downstream of a sluice gate, several preliminary experiments were performed. Based on the theoretic realization of the flow field between the sluice gate and the perforated sill, the majority of the flow parameters were characterized to perform the dimensional analysis as shown in Fig. (4).
 |
(1) |
B is the channel width, b is the contracted width of the channel, G is the gate opening, yup is the upstream water depth, y1 is the initial water depth of jump, y3 is the water depth just downstream of the sluice gate, y4 is the depth of water at the end of submerged jump, Lj is the Jump length. g is the gravitational acceleration, E3 is the total energy just after the gate, E4 is the total energy at y4, and ΔE is the energy lost through jump.,ρ is the mass density of water, µ is the dynamic viscosity of water, Asill is the total area of the perforated sill, Ahole is the Area for holes on the perforated sill, Eup is the total energy upstream the gate, dsc is the max scour hole depth,V1 is the velocity at venna contract, Osh is the hole shape factor, and FG is the gate Froude number.
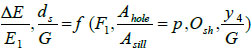
According to Buckingham's π-theorem and taking (G, g, and ρ) as repeated variables, the general form of relationship between these variables may be written as follows:
 |
(2) |
Where the relative energy loss through the hydraulic jump (E3- E4)/ E1=ΔE/E1 and the relative area of holes (sill porosity) Ar=Ahole/Asill. The screen height, screen width, Median sediment diameter, and expansion ratio were constants throughout this study.
4. RESULTS AND DISCUSSION
The effect of the relative sill porosity and the sill opening hole shape on the max scour depth downstream of the sluice gate was investigated.
4.1. Sill’s Porosity Effect on the Max Scour Depth
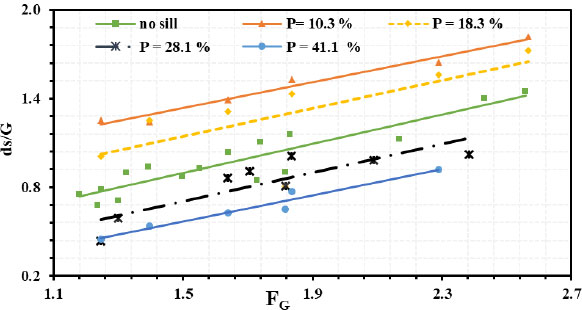
Fig. (5) shows the relation between the relative max scour depth (ds/G) and the Gate Froude number (FG) for different gate openings (G =4, 5 and 6 cm) at a constant submerged ratio equal (). From the figure, it is observed that the maximum scour depth increases with increasing the Froude number for all experiments. The sill with a porosity of 41.1% gave the minimum value of the maximum scour depth downstream of a sluice gate, and the sill with a porosity of 10.3% gave the maximum value of the maximum scour depth. The sill with a porosity of 41.1% reduces the maximum scour depth downstream of a sluice gate by 50%. This is due to the increase in water flow through the openings of the sill, which increases the turbulence after it. Because of the collision of this flow with the flow that passes over it which leads to a reduction in the speed of water near the bottom, which reduces the effect of scour behind the stilling basins.
4.2. Sill’s Porosity Effect on the Relative Energy Losses (∆E/E1).
Fig. (6) shows the relation between the Relative energy losses (∆E/E1) and the Gate Froude number (FG) for different gate opening (G =4, 5, and 6 cm) at a constant submerged ratio equal (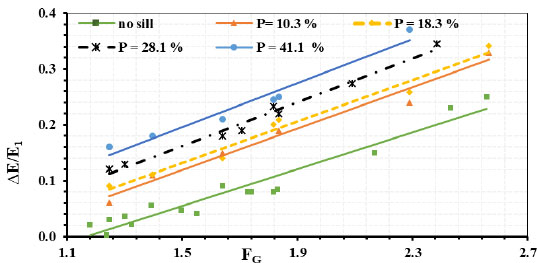 ). From the figure, it is observed that the Relative energy losses (∆E/E1) increase with increasing the Froude number for all experiments. The reason for this increase is the increase in turbulent flow downstream of the sills, which leads to an increase in the amount of energy loss as a result of their presence. In general, the dissipation of energy in the presence of sills shows a noticeable difference from the dissipation values in the absence of them. The sill with a porosity of 41.1% increases the dissipation of energy downstream of a sluice gate by 80%.
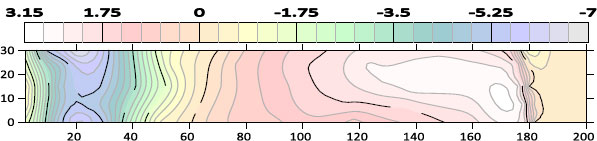
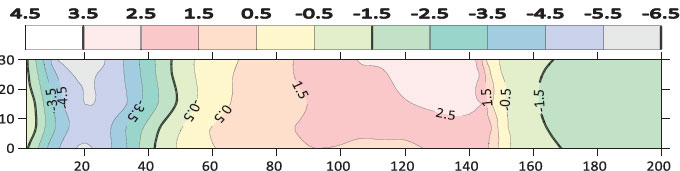
4.3. Sill’s Porosity Effect on the Bed Morphology
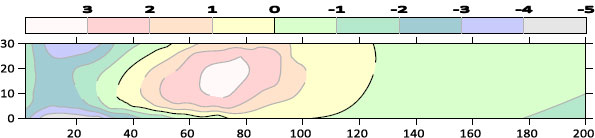
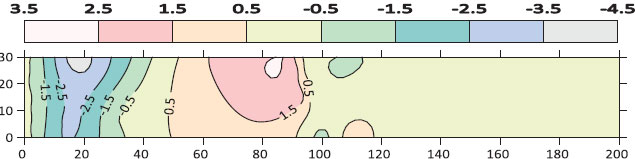
The contour maps of bed morphology were drawn by using the Surfer program. Figs. (7) to 11) show the contour map of the bed for different cases of sill’s porosity at the same flow conditions (Q=12.6 L/s, G=4 cm) respectively. From these figures, it can be observed that the scour region is minimal in the case of Sill’s porosity of 41.1%. However, the deposition height and deposition length downstream of the gate are also smaller for the case of porosity (41.1%).
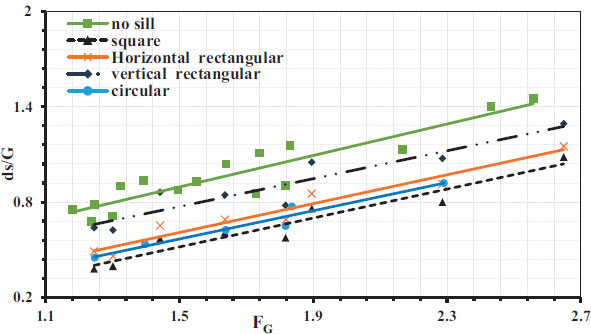
4.4. The Hole’s Shape Effect on the Maximum Scour Depth.
Fig. (12) shows the relation between the relative max scour depth (ds/G) and the Gate Froude number (FG) for different hole opening shapes (circular, vertical rectangular, horizontal rectangular, and square opening) with the same relative sill porosity of 41.1%. From the figure, it is observed that the case of square openings is better and gives the minimum values of relative maximum scour depth. The perforated sill with a square porosity of 41.1% reduces the maximum scour depth downstream of a sluice gate by 60%. This is due to the distribution of speeds near the bottom over the width of the whole square compared with the lowest point of the circle near the bottom. While the horizontal and vertical rectangles are due to the difference in the length and width of the opening, the amount of water passing through the openings is less due to the conversion that occurs in the length of the short side, which leads to decrease its effect on the flow that passes over the screen and increase the scour downstream the basin.
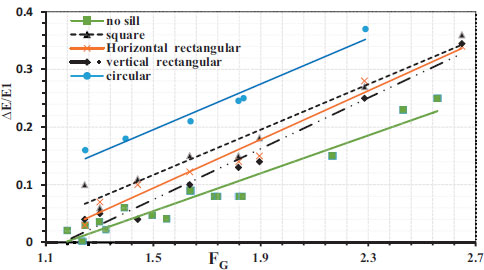
4.5. The Hole’s Shape Effect on the Relative Energy Losses (∆E/E1).
Fig. (13) shows the relation between the Relative energy losses (∆E/E1) and the Gate Froude number (FG) for different opening shapes. From the figure, it is observed that the circular opening is better in dissipation energy than other cases due to its regularity compared to the other shapes.
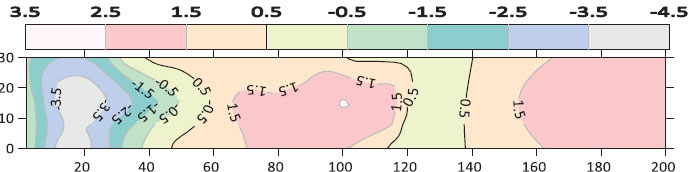
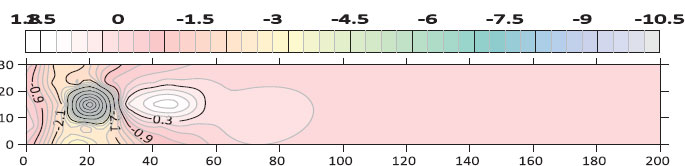
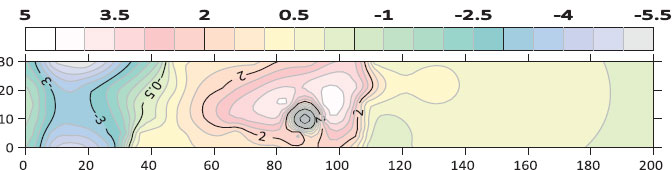
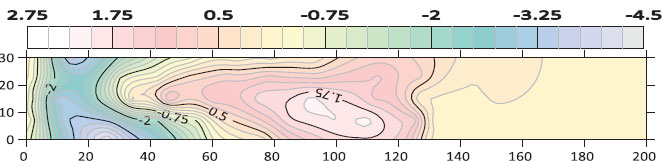
4.6. The Hole’s Shape Effect on the Bed Morphology
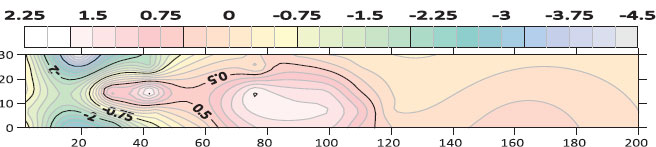
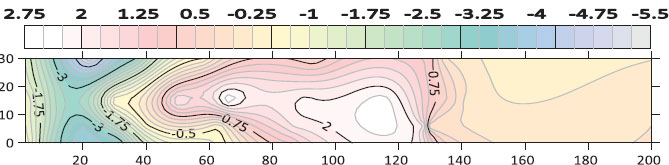
Figs. (14 to 18) shows the contour map of the bed for different cases of sill’s porosity at the same flow conditions (Q=14.6 L/s, G=4 cm) respectively. From these figures, it can be observed that the scour region is minimal in the case of a square hole shape. However, the deposition height and deposition length downstream of the gate are also smaller in the case of a square hole opening.
| Variables | Range | ||
|---|---|---|---|
| Gate opening | 4, 5, and 6 cm | ||
| Gate Froude number(FG) | 1.10 to 2.70 | ||
| perforated sill | Opening shape | Shape factor (Osh) |
Porosity |
| Square opening | 1 | 41.10% | |
| Horizontal rectangular | 1.09 | 41.10% | |
| vertical rectangular | 1.31 | 41.10% | |
| Circular open 6mm diameter. |
2.09 | 10.30% | |
| Circular open 8mm diameter. |
1.97 | 18.30% | |
| Circular open 10mm diameter. |
1.34 | 28.50% | |
| Circular open 12mm diameter. |
1.06 | 41.10% | |
| No sill | 1.66 | 100% | |
| Multiple R | 0.975634017 |
|---|---|
| R Square | 0.951861736 |
| Adjusted R Square | 0.947979617 |
| Standard Error | 0.076064132 |
| Observations | 90 |
4.7. STATISTICAL ANALYSIS
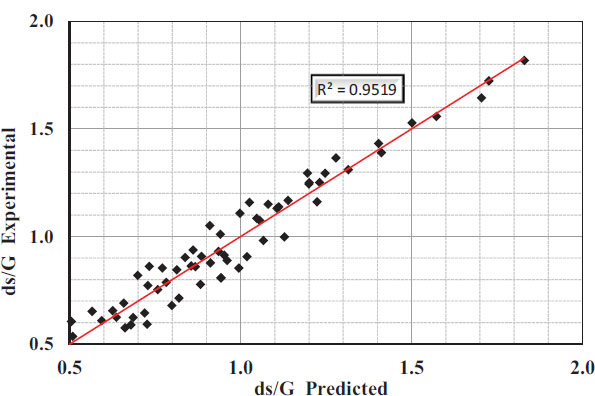
The regression analysis was applied for all simulated cases to have prediction models correlating the relative maximum scour depth with other independent parameters. Many trials were carried out to have a general equation representing the whole independent parameters. The determination coefficient for this equation was very small and cannot express the relative scour depth. Therefore, predicted equations for different simulated models were created as follow:
 |
(3) |
The proposed equation is valid for the following characteristics of different parameters as shown in Table 1. Therefore, this equation is not suggested to be used beyond the range of the parameters mentioned above. The associated errors for computing the maximum depths by Equation (3) were consistent and did not exceed ±7.60% as shown in Table 2. Fig. (19) shows the relation between Residuals and measured (ds/G). It was found that the predicted equations express well the measured data.
CONCLUSION
Experimental studies related to the sudden expansion of a stilling basin supported by a perforated sill were done to show the effect of the presence of the perforated sill on the maximum scour depth and the energy dissipation downstream of a sluice gate. The present study introduces the following results;
- The maximum scour depth increases with increasing the Froude number for all experiments.
- The sill with a porosity of 41.1% gave the minimum value of the maximum scour depth downstream of a sluice gate, and the sill with a porosity of 10.3% gave the maximum value of the maximum scour depth.
- The sill with a porosity of 41.1% reduces the maximum scour depth downstream of a sluice gate by 50%.
- The circular hole’s shape gave the maximum energy dissipation.
- The sill with a porosity of 41.1% increases the dissipation of energy downstream of a sluice gate by 80%.
- The perforated sill with a square porosity of 41.1% reduces the maximum scour depth downstream of a sluice gate by 60%.
- The scour region is minimal in the case of a square hole shape. However, the deposition height and deposition length downstream of the gate are also smaller in the case of a square hole opening.
LIST OF ABBREVIATION
| ELM | = Extreme learning machines |
| 3D | = Three-dimensional |
| FG | = Froude number |
CONSENT FOR PUBLICATION
Not applicable.
AVAILABILITY OF DATA AND MATERIAL
All the data and supporting information are provided within the article.
FUNDING
None.
CONFLICT OF INTEREST
The authors declared no conflict of interest financial or otherwise.
ACKNOWLEDGMENT
Declared none.

