All published articles of this journal are available on ScienceDirect.

Texture Depth Measurement using a Micro-volume Measurement Technique for Gyratory Compactor Specimens
Authors Info & Affiliations
Abstract
Introduction:
Road safety plays a pivotal role in transportation infrastructure, as the quality of road surfaces is a crucial factor in ensuring safe driving conditions. One of the main indicators of road quality is the Mean texture depth (MTD), which greatly affects a vehicle's traction and skid resistance. Multiple methods are available for analyzing fabric depth, with the volumetric method, known as the sand patch test and standardized under ASTM E 965 – 96, being the traditional approach.
Aim:
This research aims to adapt a Sand Patch test procedure to evaluate surface texture depth on laboratory specimens with a 100 mm diameter and determine the required amount of sand, both in terms of weight and volume, to conduct this test effectively.
Methods:
To achieve this, the relationship between the amount of sand required and the sample size was determined. Two different types of asphalt mixtures were studied Stone Mastic Asphalt (SMA) and Asphalt Concrete (AC), with five gradation limits for each.
Results:
In the case of the AC10 mixture, the MTD ranged from 0.60 to 1.139 mm, while in SMA 20, the MTD ranged from 1.91 to 2.574 mm. These results are consistent with previous studies, confirming the reliability of the testing methodology, even when working with limited sample areas.
Conclusion:
In conclusion, the study highlights the potential simplicity and cost-effectiveness of using the Sand Patch micro-volume measurement method. When employed at the initial design stage, this method can provide valuable insights into surface texture, enhancing the design process and potentially further improving road safety.
1. INTRODUCTION
The surface texture is one of the road safety factors that also affect performance [1]. One of the severe problems with highway pavements, especially when wet, is skid resistance. This problem becomes more prominent as traffic speeds and densities increase, leading to a rise in the likelihood and consequences of skidding accidents at an alarming rate. Several significant surface factors, including aggregate texture, type of binder, roughness, and micro-topography, influence road performance. Asphalt pavement surfaces are grouped based on texture wavelengths into micro-texture, macro-texture, mega-texture, and unevenness/roughness [2, 3]. Each category can be further classified based on wavelength and plays a role in the interaction between tires and the pavement [4].
Numerous field and laboratory investigations have examined the impact of aggregate gradation and particle shape parameters on the skid resistance of asphalt surface mixtures [5]. As the primary contact medium for vehicle tires, coarse aggregate, constituting more than 70% of the weight of the asphalt mixture, is widely acknowledged as one of the most significant variables in defining the frictional properties of asphalt pavement [5, 6]. The study by Lin et al. [7] relied on four different fine aggregates to study the impact of fine aggregate angularity (FAA) on skid resistance using stone matrix asphalt (SMA) and conventional asphalt concrete (AC) separately. The results demonstrated a significant macro-level influence of FAA on skid resistance [8]. Another investigation conducted by Youjie Zong et al. focused on the influence of coarse aggregate shape on the sliding resistance of compacted asphalt concrete mixtures, specifically ACW20 in three different combinations. The findings revealed that mixtures with angular aggregate shapes exhibited the highest skid resistance, followed by those with elongated aggregates and flaky aggregates [5].
The majority of commonly used techniques for determining pavement texture are designed for measuring macro-texture, and most of the conventional methods for measuring macro-texture rely on tactile measurements. In contrast, more techniques typically employ non-contact methods, including laser and photometric stereo techniques. Low-speed friction measurement devices, such as the British Portable Tester [9] Indirectly, approximate micro-texture values in terms of the pendulum test value (referred to as BPN in ASTM and CNR standards and PTV in EN standards). Unfortunately, estimating MTD and PTV is impossible since these measurements require large surface areas [10].
Additionally, there are electro-optic and laser-based methods available for assessing high-speed friction. A more modern example of a laser-based device is the portable Model 9300 laser texture scanner (LTS) created by Ames Engineering. In response to the substantial expenses associated with laser-based systems, a recent study has explored the use of stereo photogrammetry and microscopes for conducting 3D surface texture measurements [11]. The 3D measurements revealed the extent of physical alterations that cannot be detected using 2D line profiles [11, 12]. These methods, such as the Dynamic Friction Tester DFT ASTM E1911 are challenging and susceptible to lighting conditions such as incident illumination angles, illumination intensity, ambient light, and shadows cast by pavement surface materials [13, 14]. The outflow meter outflow time (OFT), which uses a different contact method, estimates pavement roughness indirectly by measuring how long it takes for a specific amount of water to leak out of a measuring cylinder with a rubber bottom ASTM E 2380-05 [13, 15]. Environmental safety and its sustainability are a major concern [16]. Nowadays, using waste materials with asphalt mixtures increases pavement performance, durability, and sustainability [17]. It effectively conveys the idea that recycled materials can be added to asphalt mixtures using the dry mixing method, specifically by incorporating coarse materials like glass and concrete waste, and that these additions can impact the surface texture properties of the asphalt [18]. Furthermore, using materials such as plastic, rubber, and others as partial replacements for fine aggregates can influence surface properties.
This study outlines a practical framework for conducting macrotexture measurements at the initial design stage using 100 mm gyratory samples in the laboratory. Standardized measurements were carried out using the sand patch method on different mixtures (SMA 20 and AC 10). These measurements were employed to simplify the results regarding the effects of different gradation limits on texture depths. This paper presents the results obtained in terms of the miniaturization of macrotexture measurements.
The objective of this research is to modify the Sand Patch test procedure for assessing surface texture depth on laboratory samples having a 100 mm diameter. Additionally, the research seeks to ascertain the necessary quantity of sand, whether in weight or volume, essential for the efficient execution of this test. The material commonly used is as specified by the Standard Specification for Malaysian Road Construction (JKR/SPJ/2008) using the sand patch method [19]. The aggregates used in this study were crushed granite aggregates from the Kajang Rocks quarry.
This study focused on two types of asphalt mixtures: Asphalt Concert (AC10) and Stone Mastic Asphalt (SMA20) (Table 1). Outlines the specific requirements for testing the aggregates used in these mixtures. While Tables 2 and 3 present aggregate gradations for AC10 and SMA 20, respectively. Specimens were prepared with the optimum asphalt contents derived from the Marshall Mix design procedure of ASTM D1559 [20]. The specimens were prepared using the traditional 60-70 penetration bitumen grade. This study used a gyratory compactor with a 100 mm diameter to simulate the field compaction procedure as specified in the ASTM D6925 [21]. Ninety samples were prepared to determine the average surface texture in the new procedure. These samples comprised fine aggregate sands retained on a 0.150 mm sieve. The sand's density was calibrated according to ASTM D-1556 to investigate the Maximum Theoretical Density (TMD).
| Type of Test | Result | Requirement | ASTM Number |
|---|---|---|---|
| Specific gravity & and absorption | 0.19% | <2% | ASTM D127 |
| Los Angeles abrasion | 24% | <30% | ASTM C131 |
| Aggregate impact value | 11.06% | <30% | BS 812: Part III |
| Flakiness and index test | 16.5 | <30% | BS 812: Part III |
| Soundness test | 1.65 | <18% | ASTM C88 |
| Angularity test | 8.7 | 6-9 | MS 7.5 |
| Sieve | Min. | Mid.G3 | Max. | Lower. G1 | Upper .G2 | Max Main. G4 | Min Max .G5 |
|---|---|---|---|---|---|---|---|
| 14.00 | 100.0 | 100.00 | 100.00 | 100.00 | 100.00 | 100.00 | 100.00 |
| 10.00 | 90.00 | 95.00 | 100.00 | 93.00 | 97.00 | 98.75 | 91.25 |
| 5.00 | 58.00 | 65.00 | 72.00 | 62.00 | 70.00 | 68.50 | 61.50 |
| 3.350 | 48.00 | 56.00 | 64.00 | 50.00 | 62.00 | 58.00 | 54.00 |
| 1.180 | 22.00 | 31.00 | 40.00 | 25.00 | 38.00 | 31.00 | 31.00 |
| 0.425 | 12.00 | 19.00 | 26.00 | 15.00 | 25.00 | 17.25 | 20.75 |
| 0.150 | 6.00 | 10.00 | 14.00 | 9.00 | 12.00 | 8.00 | 12.00 |
| 0.075 | 4.0 | 6.00 | 8.00 | 6.00 | 7.00 | 4.50 | 7.50 |
| Sieve | Min. | Mid.G3 | Max. | Upper.G2 | Lower. G1 | Mix-Min. G4 | Min-Max. G 5 |
|---|---|---|---|---|---|---|---|
| 19.00 | 100.00 | 100.00 | 100.00 | 100.00 | 100.00 | 100.00 | 100.00 |
| 12.50 | 85.00 | 90.00 | 95.00 | 94.00 | 86.00 | 93.75 | 86.25 |
| 9.50 | 65.00 | 70.00 | 75.00 | 73.00 | 66.00 | 72.50 | 67.50 |
| 4.75 | 20.00 | 24.00 | 28.00 | 26.50 | 21.50 | 25.00 | 23.00 |
| 2.36 | 16.00 | 20.00 | 24.00 | 23.50 | 17.50 | 20.00 | 20.00 |
| 0.600 | 12.00 | 14.00 | 16.00 | 15.00 | 13.00 | 13.50 | 14.50 |
| 0.300 | 12.00 | 13.50 | 15.00 | 14.00 | 12.50 | 12.75 | 14.25 |
| 0.075 | 8.00 | 9.00 | 10.00 | 9.50 | 8.50 | 8.25 | 9.75 |
| Empirical Test | Measured Value | Standard | Specification |
|---|---|---|---|
| Penetration | 65 | ASTM D 5 | 60–70 mm |
| Specific gravity | 1.047 | ASTM D 70 | - |
| Softening point | 49.8 | ASTM D 36 | >45 °C |
| Flash point | 276 | ASTM D 92 | 260 °C |
| SMA 20 | Mix Type | OAC % |
|---|---|---|
| SMA 20 LOWER Gradation | 5.475 | |
| SMA 20 Middle Gradation | 5.575 | |
| SMA 20 Upper Gradation | 5.400 | |
| SMA - G 4 MAX MAIN Gradation | 5.520 | |
| SMA - G 5 MAIN-MAX Gradation | 5.370 | |
| AC10 | AC 10 LOWER Gradation | 6.000 |
| AC 10 MIDDLE Gradation | 5.700 | |
| AC 10 UPPER Gradation | 5.480 | |
| AC 10 - G4 MAX-MAIN Gradation | 6.050 | |
| AC10 - G5 MAIN-MAX Gradation | 5.580 |
2. MATERIALS
Granite from Kajang Rocks Sdn. Bhd was selected for use in the test program (JKR/SPJ 2008) with different gradations. Table 1 displays the aggregate property tests summary with ASTM and JKR requirements, while Tables 2 and 3 illustrate the gradation limit for AC10 and SMA20 mixture, respectively.
The asphalt binder utilized in this study had a penetration grade of 60/70, which is commonly employed in flexible pavement construction in Malaysia. The empirical tests encompassed penetration at 25 °C, specific gravity, softening point, flash and fire point, and Brookfield viscosity. The Optimum Asphalt Content (OAC) was determined through the Marshall mix design procedure for two mixtures. The results of the bitumen tests are presented in Table 4, while Table 5 shows the O.A.C for different types of gradation and asphalt mixture.
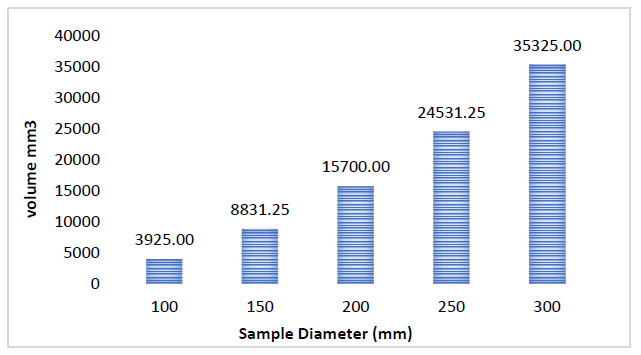
Table 4 shows the Optimum Asphalt Content (O.A.C) for two different asphaltic concrete mixtures with five gradation limits for each (Lower G1, Upper G2, Middle G3, Mix-Min G4, and min-mix G5).
3. METHODS
3.1. Measurement of the Macrotexture Depth Using Volumetric Technique for Laboratory Samples (MTD)
The traditional approach to measuring macro-texture served as the basis for developing the Sand Patch test (ASTM E965) and the Australian protocol BS 598:105 for the sand patch method. This technique involves the use of either natural silica sand from Ottawa or solid glass spheres. Sand is applied to the pavement in a circular motion using a spreading tool. The size of the nearly circular piece of sand is calculated as the average of four equally spaced diameters. The Maximum Theoretical Depth (MTD) is determined by dividing the known volume of sand by the circular area, as illustrated in Eq. (1).
 |
(1) |
where MTD is the mean texture depth of pavement macrotexture (mm), V is the volume of sand (mm3), and D is the diameter of the circle (mm) [20]. The test results showed the following MTD that can be classified by wavelength.
Micro Less than 0.5 mm.
Macro 0.5 mm to 50 mm.
Mega 50 mm to 500 mm.
Roughness or smoothness > 500 mm.
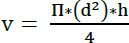
The sand patch test is usually carried out on-site or using a slab of 300 * 300 mm. In this study, the required volume of sand to cover the surface was collected at a lower wavelength of 0.05 mm on a smooth surface for the macrotexture depth using Eq. (2).
 |
(2) |
where
V= sand volume for sample
 |
(3) |
Wa = lower wavelength = 0. 5 mm, R = A radius of the sample.
Fig. (1) shows the result of the sand volume requirement for the lab sample. The sample cross-section was calculated for the laboratory sample with a diameter of 100 mm using the rotary compacter to simulate the method of field compaction.
3.2. Calibration Density of Sand
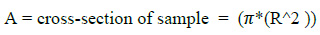
During this stage, the sand's density is fine-tuned, enabling the use of a fixed weight based on the correlation between the filling material's density and the sample's cross-sectional area. Fine granite aggregate is carefully selected, with at least 90% passing through a 0.425 mm sieve and being retained on a 0.15 mm sieve. This testing method is recommended for added quality control, ensuring that the material's quantity aligns in terms of both mass and volume with the sand material's density for each measurement of the total surface fabric depth. The sand's density is determined following ASTM D 1556 standards. The bulk density of the sand is calculated using Eq. (4). Table 6 presents the outcomes regarding the cross-sectional dimensions and the volume of materials needed in comparison to the weight of the filling material in each sample.
 |
(4) |
M = m 1- m 2.
 |
Where:
M = mass of the sand to fill the calibration container.
m 1 = mass of the calibration container; m 2 = mass of the sand + calibration container;
V = volume of the calibration container and D= container diameter.
M= 2.441 - 1.0622 = 1.379 g.
 =1.177.500 mm3=1.171 gr/cm3.
The weight of sand is determined using Eq. (4).
Mass of sand for Ø 100 mm = density * volume of the cross-section = 1.171* 3925 = 4.60 grams.
4. RESULTS AND DISCUSSION
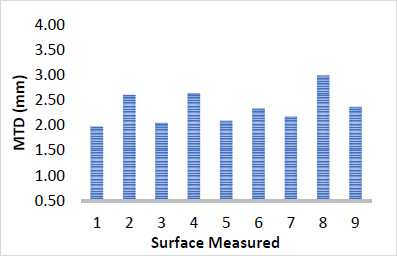
This study presented the modification of the test procedure for estimating the Maximum Theoretical Density (MTD) on two types of asphalt mixtures. (AC10) and (SMA 20) with five different gradations were used in this research. A total of ninety samples were employed to determine the average surface depth value and investigate the effect of gradation limits on surface depth. The findings of this study confirmed that the SMA mixture exhibited a higher MTD compared to the AC10 mixture, consistent with previous studies [7, 22, 23]. Furthermore, variations in results were observed within the same type of mixture, depending on the gradation limits. In the case of SMA20, the minimum mix G5 gradation exhibited a maximum MTD of 2.574 mm.
| Diameter | Cross-Section. mm2 | Volume. mm3 | Required of Sand Mass. Gram |
|---|---|---|---|
| 100 | 7850 | 3925.00 | 4.596 |
| 150 | 17663 | 8831.25 | 10.341 |
| 200 | 31400 | 15700.00 | 18.385 |
| 250 | 49063 | 24531.25 | 28.726 |
| 300 | 70650 | 35325.00 | 41.366 |
| Sample No | V mm3 | Diameter (D 1) | Diameter (D 2) | Diameter (D 3) | Average | MTD |
|---|---|---|---|---|---|---|
| 1 | 3925.00 | 52.84 | 46.63 | 51.43 | 50.30 | 1.98 |
| 2 | 3925.00 | 49.74 | 41.05 | 40.77 | 43.85 | 2.60 |
| 3 | 3925.00 | 51.97 | 47.57 | 48.89 | 49.48 | 2.04 |
| 4 | 3925.00 | 46.91 | 41.56 | 42.35 | 43.61 | 2.63 |
| 5 | 3925.00 | 54.34 | 46.12 | 46.51 | 48.99 | 2.08 |
| 6 | 3925.00 | 50.50 | 43.50 | 45.25 | 46.42 | 2.32 |
| 7 | 3925.00 | 50.95 | 47.23 | 45.94 | 48.04 | 2.17 |
| 8 | 3925.00 | 42.50 | 42.67 | 37.50 | 40.89 | 2.99 |
| 9 | 3925.00 | 42.76 | 48.62 | 46.68 | 46.02 | 2.36 |
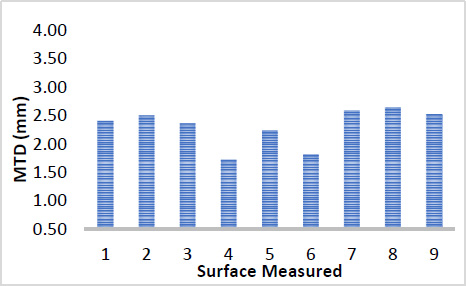
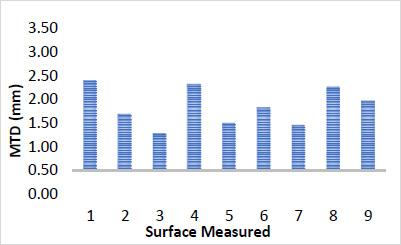
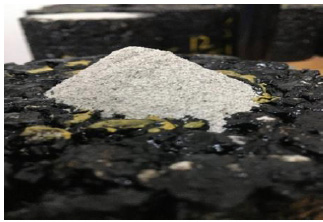
The coarse aggregate materials showed a rate of 69%, with 31% fine and filer aggregates. The G2 upper gradation limit -SMA 20 showed a minimal MTD of 1.91 mm; the coarse aggregate materials showed a rate of 73.5%, with 26.5% fine and filer aggregates. The result of G1 is shown in Table 7 and Figs. (2, and 3) shows the results of the G2 limit and G5 limit of the SMA 20 mixture, respectively. Fig. (4) displays the lower gradation, G1. Fig. (5) displays the volume of sand over the sample surface.
The test results for AC10 revealed a maximum MTD of 1.139 mm for the G1-AC10 lower gradation limit. This gradation limit consisted of 40% core aggregate and 60% fine and filler aggregates. Conversely, the minimum MTD was 0.605 mm for the G2-AC10 upper gradation limit, comprising 30% coarse aggregate and 70% fine and filler aggregate. Figs. (6 and 7) illustrate the results of the G1-AC10 lower gradation limit and G2-AC10 upper gradation limit, respectively. Table 8 shows the MTD calculation for G1-lower gradation AC10, while Fig. (8) shows the volume of sand after spreading over the sample surface.
| Sample No | (V) | (D 1) | (D 2) | (D 3) | Average | MTD |
|---|---|---|---|---|---|---|
| 1 | 3925 | 64.29 | 62.12 | 61.5 | 62.637 | 1.274 |
| 2 | 3925 | 77.03 | 66.13 | 69.2 | 70.787 | 0.998 |
| 3 | 3925 | 68.07 | 65.72 | 63.49 | 65.760 | 1.156 |
| 4 | 3925 | 61.11 | 75.87 | 67.85 | 68.277 | 1.073 |
| 5 | 3925 | 69.43 | 63.64 | 75.57 | 69.547 | 1.034 |
| 6 | 3925 | 64.57 | 58.81 | 64.07 | 62.483 | 1.281 |
| 7 | 3925 | 64.91 | 76.55 | 63.32 | 68.260 | 1.073 |
| 8 | 3925 | 63.49 | 62.97 | 65.36 | 63.940 | 1.223 |
| 9 | 3925 | 63.08 | 62.51 | 64.3 | 63.297 | 1.248 |
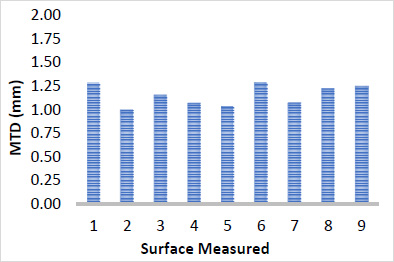
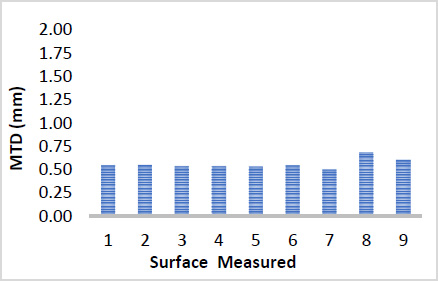
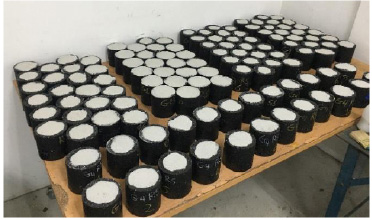
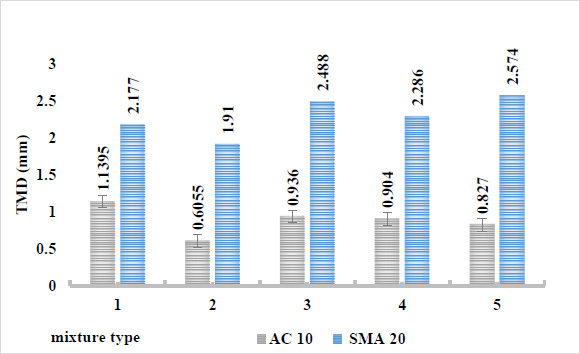
Fig. (9) shows the comparison of two types of asphalt mixtures and the gradation effect on the surface texture depths. It can be observed that the results showed more impact of the development of fine and filer materials on the smoothness or roughness property of the asphalt mixtures with different gradations. The findings align with various studies that examined surface texture depth using diverse methods [24, 25].
CONCLUSION
Estimation of the depths of surface texture in asphalt mixtures during the initial design stage can significantly enhance safety measures. This study primarily aims to establish the correlation between the quantity and volume of sand used in the sand patch test for analyzing small samples and to assess the impact of gradation limits on the surface texture of asphalt mixtures. In this investigation, the sand patch test method was conducted on 100 mm diameter samples. The results demonstrate the feasibility of making predictions at the design stage. The texture depth (MTD) for mastic stone asphalt (SMA 20) ranged from 1.91 to 2.574 mm, depending on the type of grain gradation, whereas hot mix asphalt (AC 10) exhibited depths ranging from 0.60 to 1.139 mm. In conclusion, this method proves to be a straightforward and cost-effective approach. If implemented during the initial design phase, it can offer valuable insights into surface texture, thereby enhancing the overall design process. However, it is advisable to conduct further studies utilizing various methods to validate the relationship between surface texture properties and the reliability of small surface areas.
CONSENT FOR PUBLICATION
Not applicable.
AVAILABILITY OF DATA AND MATERIALS
The data and supportive information are available within the article.
FUNDING
None.
CONFLICT OF INTEREST
The authors declare no conflict of interest, financial or otherwise.
ACKNOWLEDGEMENTS
The authors would like to thank the Department of Civil Engineering and the Research Management Centre of UPM for their continuous support.

