All published articles of this journal are available on ScienceDirect.

The Assessment of the Influence of Soil Type on the Nonlinear Seismic Response of a Corroded Reinforced Concrete Portal Frame
Abstract
Background
Most researchers have focused on the effect of rebar corrosion on the seismic behaviour of reinforced concrete (RC) columns. On the other hand, the influence of chloride corrosion of reinforced concrete in combination with soil type on the seismic behaviour of RC columns has not been investigated.
Objective
This paper investigates the influence of soil characteristics on the seismic vulnerability of reinforced concrete structures. The case study in focus is a reinforced concrete portal frame with columns exhibiting corrosion at ground level.
Methods
Chloride ingress initiates corrosion and reduces the cross-sectional area of the corroded concrete steel. In addition, this research considers two different soil types, namely rocky and loose, as relevant factors in the analysis. Firstly, the seismic loads are determined according to the Moroccan seismic building code RPS2011. Then, the evaluation of the evolution of the diameter of corroded bars due to chloride induced corrosion is investigated. Finally, pushover analysis is used to determine the location of the performance point on the capacity curve.
Results
The study also includes an investigation of the ductility characteristics of corroded reinforced concrete structures and the inter-storey displacement in different soil conditions. The results show that the inter-storey displacement decreases with increasing age of the structure. In addition, it is observed that the base shear force and roof displacement at the point of failure are more sensitive in loose soils compared to rocky soils.
Conclusion
The results indicate that consideration of soil type can significantly alter the expected seismic performance, resulting in higher vulnerability values.
1. INTRODUCTION
The corrosion of reinforced concrete frames contributes to the decline in the performance of existing structures. The latter is due to the diffusion of aggressive agents in the concrete, such as carbon dioxide or chloride ions. This diffusion produces a reaction that gives corrosion products. The development of corrosion products leads to three main effects: the reduction of the steel section, the development of a specific cracking from the frame to the outside of the structure and the modification of the adhesion properties to the steel/concrete interface depending on the degree of corrosion [1, 2].
This study aims to elucidate the impact of diminished cross-sectional area in corroded steel reinforcement within reinforced concrete portal columns. This impact is assessed in the context of two distinct soil types and their influence on the seismic vulnerability of the reinforced concrete structure. Various approaches exist for appraising the seismic performance of a structure. In this research, a pushover analysis, capable of characterizing the nonlinear structural response during seismic events, is employed to pinpoint the performance points of portal frame structures along the capacity curve. The seismic performance of the corroded reinforced concrete (RC) frame structure was evaluated through numerical simulation, employing the pushover analysis method. This method was selected due to its widespread utilization and practicality in assessing the seismic performance of RC frame structures within the middle-low structural vulnerability category [3, 4]. Seismic loads are determined in adherence to the regulatory provisions outlined in the Moroccan Earthquake-Resistant Building Regulation RPS2011 [5], which defines equivalent static charges of triangular shape. Nonlinear behaviour is defined at the base of the plastic hinges. The plastic development state of the structure is effectively represented by the plastic development state of its plastic hinges. This correlation underscores the importance of the plastic development degree of the plastic hinges as a reflection of the overall plastic development degree of the structure. The outcomes of this analysis are graphically depicted by a curve that establishes a relationship between the base shear force and the top displacement of the structure.
Therefore, this study aims to determine the performance point of an RC portal frame in two different soil types by performing the pushover analysis on the SAP2000 software [6] while reducing the steel section at 25, 50, 75 and 100 years. On the other hand, the ductility of reinforced concrete structures corroded in different soil types is analyzed. Moreover, the interstorey displacement is determined according to the age of the building and the type of soil. Finally, the results will be discussed and interpreted.
2. METHODS
The aim of this article is the determination of the performance point on the pushover curve in the case of a corroded reinforced concrete portal frame and tree-floor RC structure. This corrosion, due to the ingress of chloride ions, is of a generalized type in the reinforcement of the supporting elements: the ground floor columns. The calculation of the seismic forces is carried out in two site cases: site S1, representing rocky soil, and site S4, representing loose soil, defined according to the Moroccan standard: Earthquake resistant buildings regulation RPS2011.
The methodology used in this article is as follows:
- Modeling of the portal frame structure using SAP2000 software (materials and loads).
- Determination of the corrosion initiation time Tini.
- Estimation of the diameter of the reinforcement in the load-bearing elements on the ground floor at different ages of the portal frame (0, 25, 50, 75 and 100 years).
- Software modeling of the corroded structure and determination of plastic hinges.
- Application of pushover analysis.
- Comparison between the pushover curves obtained, the global displacement results and the inter-storey displacements in the two soil cases treated.
3. DESCRIPTION OF THE SEISMIC ANALYSIS OF A CORRODED RC PORTAL FRAME
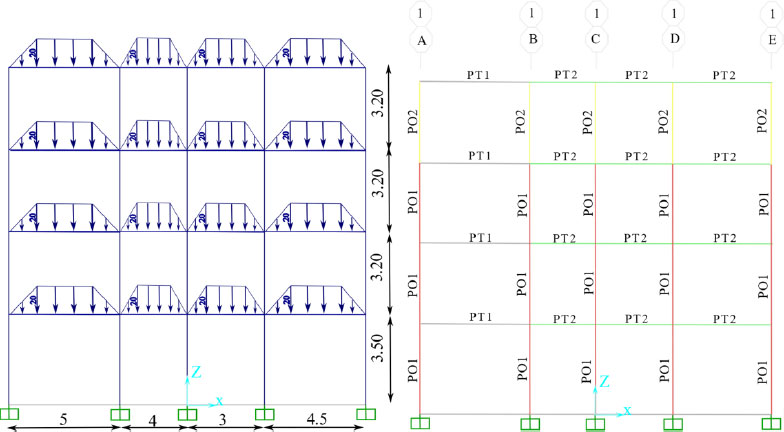
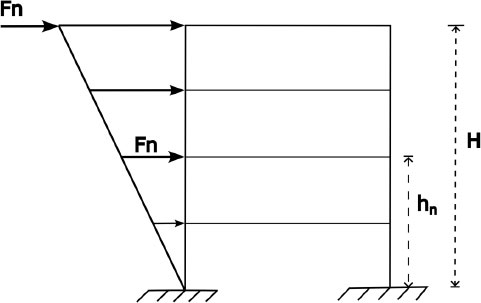
The building model has three stories with a story height of 3.5 m on the ground floor and 3.20m on the other floors (Fig. 1).
Table 1 details the characteristics of the structural elements.
Tables 2 and 3 [5] presents the seismic forces in the two cases of soil S1 (rocky soil) and S4 (loose soil).
With: T: fundamental period of vibration of a building (s); ν: Zone speed coefficient; S: soil factor. D: Dynamic amplification factor. I: priority coefficient. K: behaviour factor; W: weight of the structure. V: the base shear force.
| Element | Area of the Section of Concrete cm*cm | Reinforcement |
|---|---|---|
| Column PO1 | 30*30 | 4 HA 14 stirrup HA6 spacing 15cm |
| Column PO2 | 25*25 | 4 HA 12 stirrup HA6 spacing 15cm |
| Beam PT1 | 25*30 | Upper reinforcement 3HA6 Lower reinforcement 3HA16 |
| Beam PT2 | 25*40 | Upper reinforcement 4HA6 Lower reinforcement 4HA16 |
| Case | T (s) | v | S | D | I | K | W (KN) |

|
|---|---|---|---|---|---|---|---|---|
| Soil S1 | 0.516 | 0.17 | 1.8 | 1.864 | 1.2 | 3.5 | 1247.8 | 244.058 |
| Soil S4 | 0.516 | 0.17 | 1 | 1.864 | 1.2 | 3.5 | 1247.8 | 135.587 |
| - | Soil S1 | Soil S4 |
|---|---|---|
| Roof terrace | 52.289 | 94.12 |
| 2de floor | 40.951 | 73.712 |
| 1st floor | 27.714 | 49.886 |
| Ground floor | 14.633 | 26.34 |
The total lateral seismic force F (= the base shear force V) must be distributed over the height of the structure as follows: Part Ft of the force F is allocated to the top of the building, the rest(F-Ft) must be distributed over all levels including the top floor according to the following equation:
 |
(1) |
With: Ft=0 if T ≤ 0.7 s
Ft=0.07 T F if T > 0.7s
F: total lateral seismic force; Fn: horizontal design force applied at level n; Wn:total load at level n; hn:height of the floor considered from the ground; T:fundamental period of the structure; Ft: additive force at the top storey.
In the case stated, the distribution of the horizontal seismic forces in KN at the different storeys Fn is in Table 3.
The Fn is presented in the Fig. (2).
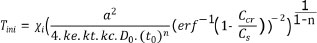
According to DuraCrete [7] and Choe et al. [8, 9], the corrosion initiation time by penetration of chlorides is:
 |
(2) |
 |
(3) |
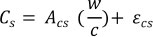
Where: a is the reinforcement cover depth, ke is an environmental factor, kt represents the influence of test methods to determine the empirical diffusion coefficient D0, kc is a parameter that accounts for the influence of curing, t0 is the reference period for D0, n is the age factor, Xi is a model uncertainty coefficient to account for the idealization implied by Fick’s second law, Cs is the chloride concentration on the surface, w/c is the water-to binder ratio, Acs and εcs are model parameters, Ccr is the critical chloride concentration, and erf is the error function.
The calculation of the initiation time of corrosion by equations (2) and (3) is presented in Table 4 [7, 10, 11].
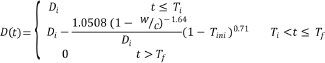
The diameter D(t) of the reinforcements at the end of (t-Tini) is equal to [9, 12, 13]:
 |
(4) |
Where: Di: initial diameter of the reinforcements; t: time (years) and Tf is the time when Di=0.
Using equation (4), the bar diameters of the ground floor columns are calculated at 25, 50, 75 and 100 years, as shown in Table 5.
Table 6 gives the main values of concrete and steel. The degradation of the mechanical properties of steel is not considered because of their low weights, which has been demonstrated in the literature [14].
| a | mm | 25 |
|---|---|---|
| Xi | - | 1 |
| kt | - | 0.832 |
| ke | - | 0.924 |
| kc | - | 2.44 |
| D0 | mm2/s | 473 |
| t0 | 28/365 | 0.0767 |
| n | - | 0.362 |
| Acs | - | 7.758 |
| W/C | - | 0.5 |
| εcs | - | 0 |
| Cs | kg/m3 | 3.879 |
| Ccr | W/C | 0.9 |
| 1-Ccr/Cs | - | 0.768 |
| erf-1(1-Ccr/Cs) | - | 0.8430 |
| Tini | years | 0.48 |
| Time (year) | 0 | 25 | 50 | 75 | 100 |
|---|---|---|---|---|---|
| D(t) mm | 6 | 5.87 | 5.77 | 5.68 | 5.59 |
| 12 | 11.87 | 11.77 | 11.68 | 11.59 | |
| 14 | 13.87 | 13.77 | 13.68 | 13.59 |
| Concrete | Steel | ||
|---|---|---|---|
| Compressive stress fcj | 25 MPa | Elastic limit fe | 500 MPa |
| Tensile stress ftj | 3 MPa | Ultimate stress fu | 550 MPa |
| Young’s modulus E | 31220 MPa | Young’s modulus Es | 200000 MPa |
| Deformation ε0 | 2. 10-3 | Elastic deformation εy | 2. 10-3 |
| Ultimate deformation εu | 3.5. 10-3 | Plastic deformation εh | 10. 10-3 |
Also, the seismic coefficients used according to the soil are [15]:
- For soil S1: ca = cv = 0.18.
- For soil S4: ca = 0.34 ; cv = 0.528.
These results are obtained by combining the codes ATC40 [16] and RPS 2011 [5]. The plastic hinges will be introduced according to ASCE 41-31 [17] defined by default in the SAP2000 V20 software.
4. RESULTS & DISCUSSION
4.1. The Performance Point
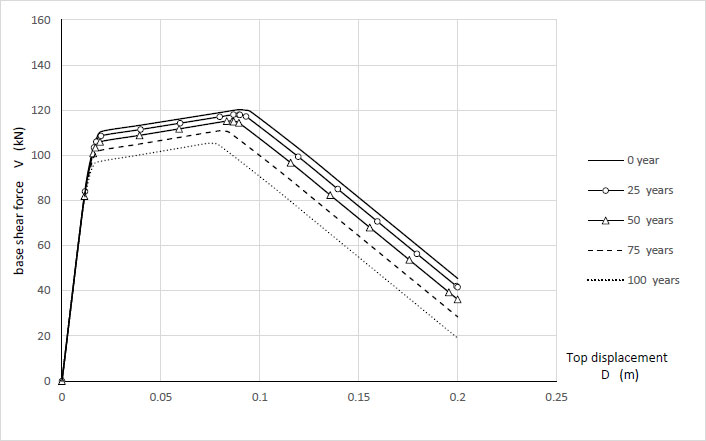
4.1.1. The Capacity Curves
The capacity curves of the structure are presented in Fig. (3). The structural capacity curve decreases with the corrosion of the reinforcements of the ground floor columns. It is independent of the type of soil site.
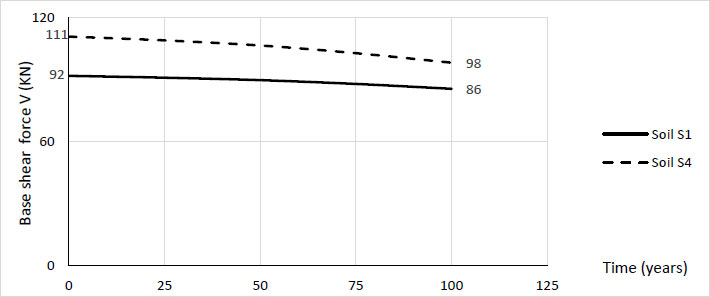
4.1.2. Base Shear at Performance Point
According to the results obtained, there is a decrease in base shear force at the performance point with the increase in the age of degradation of the construction. Fig. (4). The reduction in base shear at the performance point reaches 7% at rocky soil S1 and 11% at loose soil S4.
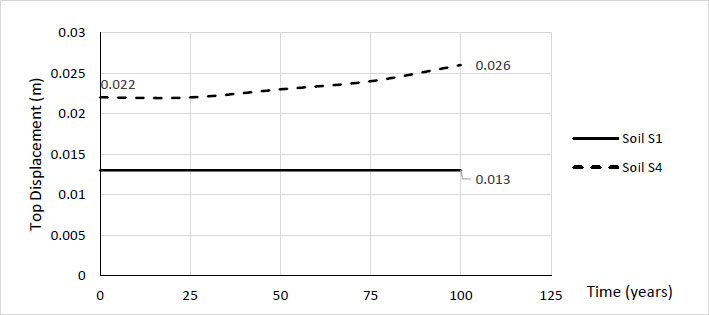
4.1.3. Displacement at the Performance Point
The top displacement at the performance point of the structure increases over time in the case of loose soil. Fig. (5). This increase is around 11% at 100 years compared to the initial state. While the displacement in the case of rocky soil is almost constant (D = 1.3 cm), whatever the age of the structure.
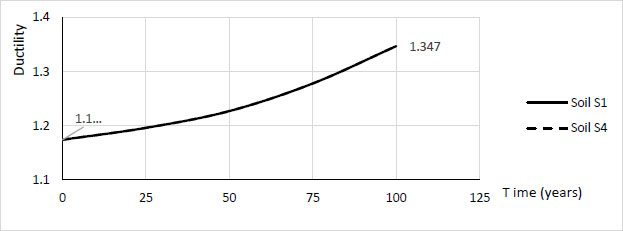
Building ductility does not depend on soil type. It increases from 1.174 to 1.347 (+ 15%) in the two cases of soil S4 and soil S1. Fig. (6).
4.2. Verification of the Functionality of the Portal Frame
The limit inter storey drift, which must not be exceeded to ensure the functionality of the structure in terms of displacement according to RPS2011 [5], is equal:
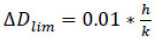 |
(5) |
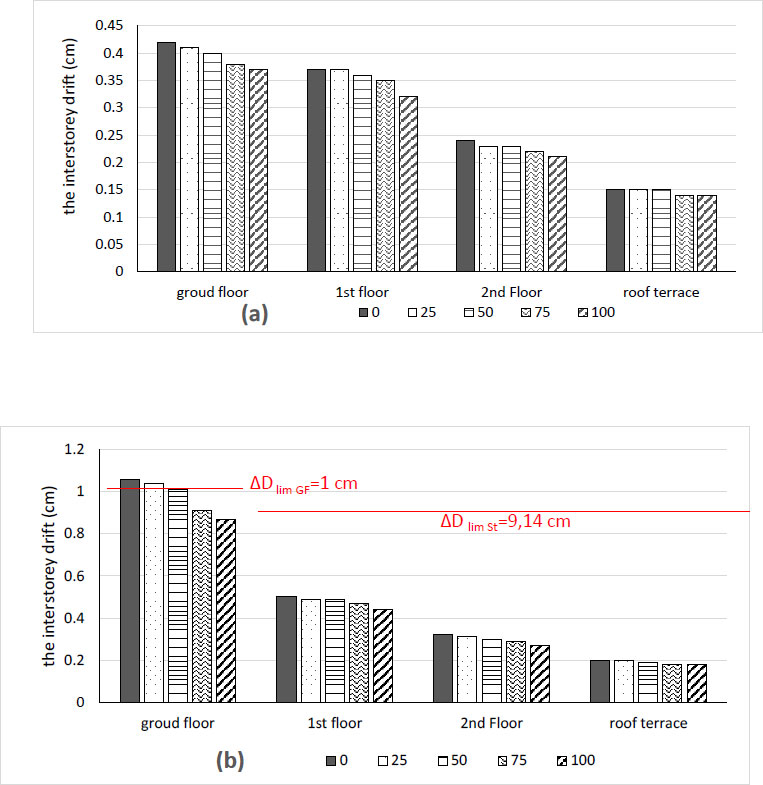
Where: h: interstorey height and K: the behaviour factor k = 3.2. In the case studied, the limit displacement at the ground floor is: ∆DlimGF=1cm, and the limit displacement at the storey is: ∆DlimSt=9.14 cm.
From the results of Fig. (7a and 7b), we see that the interstorey drift decreases over time on the rocky soil S1 and on the loose soil S4. The maximum values that are recorded on the ground floor in the initial structure 1.06 cm in soil S4 exceed the limit displacement. Therefore, the building functionality chosen on loose ground is not guaranteed. However, in soil S1, the inter storey drift is less than the limit displacement. In addition, we note that the interstorey drift recorded on the ground floor is higher than on the other floors (Fig. 7).
CONCLUSION
In conclusion, this paper presents the variation of the seismic response of a reinforced concrete portal frame in two cases of soil (rocky and loose soil) and different ages of corrosion (at 25, 50, 75, and 100 years). The case treated is the moderate corrosion of the reinforcement of the ground floor columns according to the corrosion model by penetration of chlorides. This model allows the calculation of the corrosion initiation time and the variation of the section of the reinforcements. The seismic analysis is based on the static non-linear Pushover method. The seismic loads were computed in accordance with the guidelines stipulated in the Moroccan earthquake-resistant building regulations RPS 2011.
The pushover curves show that the corroded frame's seismic bearing capacity decreased significantly due to the corrosion of its rebars. Furthermore, it is observed that as the rate of rebar corrosion increases, there is a corresponding escalation in the gradual degradation of the structural bearing capacity. The corrosion of the reinforcement of the ground floor columns of the structure causes a loss of its ability to resist seismic loads with time. On the one hand, the top displacement increases over time. Indeed, on loose soil, it is noteworthy that the base shear force and the maximum displacement at the performance point assume a more critical significance. On the other hand, the ductility of the structure, which does not depend on the type of ground, increases with the corrosion time of the construction.
Likewise, the findings suggest that as the corrosion rate increases, the inter-storey displacement experiences a reduction. It is evident that there is a decrease in inter-storey displacement as the corrosion rate of the structure increases. The values of the inter-storey drift are essential in the case of loose soil S4 compared to rock soil S1.
LIST OF ABBREVIATIONS
| RC | = Reinforced Concrete |
| Tini | = Initiation time of corrosion |
| HA | = High-adhesion steel |
| S1 | = Rocky soil |
| S4 | = Loose soil |
| T | = Fundamental period of vibration of a building (s) |
| ν | = Zone speed coefficient |
| S | = Soil factor |
| D | = Dynamic amplification factor |
| I | = Priority coefficient |
| K | = Behaviour factor |
| W | = Weight of the structure |
| V | = The base shear force |
| F | = Total lateral seismic force |
| Fn | = Horizontal design force applied at level n |
| Wn | = Total load at level n |
| hn | = Height of the floor considered from the ground |
| Ft | = Additive force at the top storey |
| a | = The reinforcement cover depth |
| ke | = An environmental factor |
| kt | = Represents the influence of test methods to determine the empirical diffusion coefficient D0 |
| D0 | = The empirical diffusion coefficient |
| kc | = Parameter that accounts for the influence of curing |
| t0 | = The reference period |
| χ | = The model uncertainty coefficient to account for the idealization implied by Fick’s second law |
| Cs | = The chloride concentration on the surface |
| Acs and ɛ cs | = Model parameters |
| Ccr | = The critical chloride concentration |
| erf | = The error function. |
| D(t) | = The diameter of the reinforcements |
| Di | = Initial diameter of the reinforcements |
| t | = Time (years) |
| Tf | = The time when Di = 0 |
| ΔDlim | = The limit interstorey drift |
| h | = Inter-storey height |
| ΔDlimGF | = The limit displacement at ground floor |
| ΔDlim St | = The limit displacement at storey. |
| fcj | = Compressive stress |
| ftj | = Tensile stress |
| E | = Young’s modulus |
| ε0 | = Deformation |
| εu | = Ultimate deformation |
| fe | = Elastic limit |
| fu | = Ultimate stress |
| Es | = Young’s modulus |
| εy | = Elastic deformation |
| εh | = Plastic deformation |
CONSENT FOR PUBLICATION
Not applicable.
AVAILABILITY OF DATA AND MATERIALS
The data supporting the findings of the article is available in the zenodo at https://zenodo.org/records/10480942, reference number DOI 10.5281/zenodo.10480942.
FUNDING
None.
CONFLICT OF INTEREST
The authors declare no conflict of interest, financial or otherwise.
ACKNOWLEDGEMENTS
Declared none.

