All published articles of this journal are available on ScienceDirect.

Hydraulic Modelling for Leakage Reduction in Water Distribution Systems Through Pressure Control
Abstract
Background
Leakage in a water distribution network makes up a significant amount of loss. In certain countries, this loss represents 40% to 50% of the supplied water, whereas the global average for most systems is estimated at around 30%. Furthermore, water demand is increasing as a result of population growth, while resources are dwindling.
Methodology
This study used hydraulic modelling for leakage reduction through pressure control. For this purpose, a hydraulic model was created using the software EPANET for a selected water distribution network in a district-metered zone in Jeddah. The model was calibrated and validated for the district-metered zone using data obtained by SCADA. Pressure management using a pressure-reduction valve was then implemented to control the amount of leakage in water distribution systems.
Results
The preliminary findings show that pressure optimization was required as there were nodes within the network that had excessive pressure. Application of pressure management to the district metered zone showed that the reduction in water pressure from 5 bar to 2 bar resulted in an immediate reduction in water losses. The leakage volume through the district-metered area at the time of maximum pressure dropped by 10% after pressure reduction. Simultaneously, the minimum required pressure was upheld at each demand node, preventing any lack of pressure in the water distribution system.
Conclusion
The results indicated that pressure control should be integrated with hydraulic modelling for effective leakage reduction. This research could help water-supply companies as a support tool for planning and managing leakage in water distribution systems.
1. INTRODUCTION
Leakage from water distribution systems is a significant issue around the world. A substantial amount of water is lost yearly from water distribution systems. This loss is equivalent to approximately 126 billion m3 per year (expressed as non-revenue water) [1]. In certain countries, this loss represents 40 to 50% of the supplied water, whereas the global average for most systems is estimated at around 30% [2]. Concurrently, water demand is increasing as a result of population growth, while resources are dwindling [3].
Leakage from water distribution systems not only leads to wasted water and lost revenue but also poses serious environmental, health, and safety problems [4]. The leaking flow could damage the structural integrity of buildings and roads, as well as result in contamination from pollutants. Therefore, there is a need for effective techniques and technologies to detect, localize, and minimize leakage in water distribution systems.
Leakages from water distribution systems can be caused by a variety of factors, including high internal pressure, material flaws, corrosion, differential settlements caused by improper backfilling beneath the pipe, and excessive loads and vibrations coming from road traffic. Depending on the types of causes, leakages can occur through various components of the distribution system, including joints, holes, and fractures. Fractures, in particular, are regarded to be the most significant of all, as they contribute the most to the overall leakage rate [5].
In leakage management, leaks in any water distribution system are normally classified as bursts and background leakages [6]. Bursts are large individual leaks that result from the structural failure of a pipe where water becomes visible at the surface. Background leakages consist of many small leaks that are extremely difficult or practically impossible to detect, even with the aid of leak-detection equipment. It is estimated that a considerable portion of pipe failures occurs from undetected and thus unaddressed leakages, in addition to poor fittings [7-9].
Typical strategies for controlling leakages from distribution systems include replacing aging mains, repairing reported leakages, actively locating and repairing hidden leaks, and pressure measurement [10]. It is widely agreed upon, however, that a significant proportion of leakages are attributable to many small leaks where detection and repair actions are otherwise uneconomical [11]. Leakage detection is a difficult process that is frequently constrained by limitations in financial and human resources. Additionally, many traditional leak-detection methods only provide a fleeting indication of the presence of leakage.
There are several leakage-detection methods employed for plastic pipes, which are progressively favoured for drinking-water applications, but their efficacy remains questionable [12]. For example, there are challenges in accurately identifying the location of failures in welded joints [13], as well as limitations of low-frequency detection in effectively detecting plastic materials, which function as low-pass filters [14]. Furthermore, conventional leakage detection methods inherently involve labour-intensive operations that add significantly to operating expenses [15, 16].
Pressure management is considered a highly impactful and economically efficient strategy for mitigating leakage. The term “pressure management” refers to the strategic management of pressures in a water distribution system to achieve optimal levels of service and to provide an adequate and efficient supply of water to users [17]. According to various studies, the reduction of pressure in the distribution system has a direct correlation with the decrease in water loss resulting from leaks [18-24]. Lambert [22] noted that the use of pressure-reduction measures has the potential to not only mitigate the leakage rate of existing leaks, but also to limit the occurrence of new leaks. Similarly, Thornton [23] indicated that both the leakage volume and the frequency of new leaks can be reduced greatly by reducing and stabilizing the pressure in a distribution system.
Thornton and Lambert [25] described several methods that could be used in pressure management for leakage reduction. These include pump controls, altitude controls, and the installation of pressure reduction valves and sustainable valves. However, before implementing any pressure-management scheme for leakage reduction, it is essential to understand its effect on the hydraulic behaviour of water distribution networks. In recent times, there has been a notable rise in the use of computer software for water distribution systems, which corresponds to the growing need for enhancements in their operating efficiency. Computer software has a wide range of applications, encompassing operational applications, optimization, and water quality assessments [26-28].
Trifunovic et al. [29] conducted research on leakage modelling using the hydraulic modelling software EPANET to simulate a hypothetical distribution system. This study revealed that the most effective approach for modelling leakage in a water distribution network was to use the emitter node feature as opposed to the demand multiplier and distinct demand-category features. Charalambous [30] described the implementation of pressure control in Lemesos, Cyprus, without using any model simulations.
In a study conducted by Kanakoudis [31], measures were taken to address the issue of high break rates of pipes and excessive water consumption in Thessalonoki, Greece. These measures involved the installation of pressure-reducing valves and the implementation of a public awareness campaign. Marunga et al. [32] used EPANET pressure management with a demand-multiplier approach to investigate ways to decrease water loss in the Chikanga neighbourhood in Mutare, Zimbabwe.
Thus, researchers have made substantial efforts to study leakages from water distribution systems and control them. However, every water distribution system has its own attributes, so before implementing any pressure-management scheme for leakage reduction, it is essential to understand its effect on the hydraulic behaviour of water distribution networks. Furthermore, because field measurements are sometimes difficult, time-consuming, and expensive, it is required to examine the hydraulic behaviour of a network using computer software.
This paper aims to employ hydraulic modelling to assess water supply networks and implement pressure control management as a vital engineering strategy to reduce leaks and improve the efficiency of water distribution systems. By utilizing hydraulic modelling and optimization techniques, the study presents a practical approach to tackling non-revenue water and enhancing the overall efficiency and sustainability of water supply networks. This is especially significant given the growing issue of water scarcity and the imperative for efficient water resource management.
2. METHODS
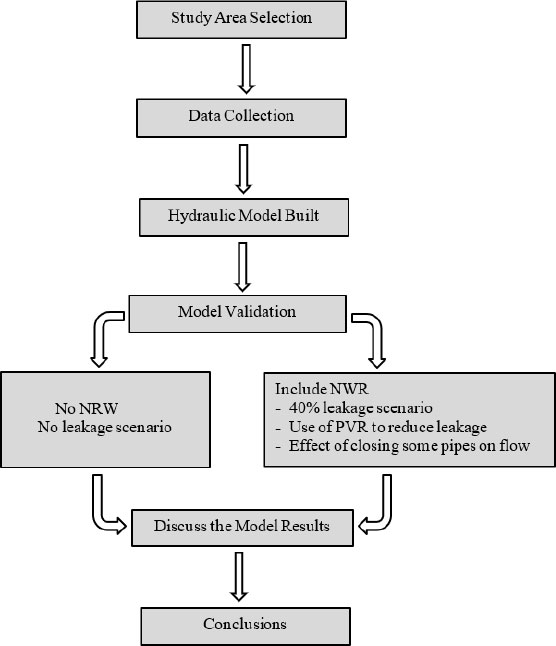
Fig. (1) shows a diagram of the research method. The focus of the study was to model leakage from a water distribution network in Jeddah using EPANET. Leakage was modelled and simulated as a function of the network's pressure head. Pressure management using a pressure-reduction valve was implemented to control the amount of leakage in the water distribution systems. The hydraulic model was used to ascertain the optimal pressure for the valve. Additionally, it was employed to replicate leaks and forecast the water conservation resulting from pressure regulation.
2.1. Hydraulic Model
Many computer models are used in the water industry to predict and assess the hydraulic efficiency of water distribution systems. Hydraulic analysis is used to calculate the pressure head, flow rate, velocity, and head loss in every component of the system. EPANET is one of the popular models for water distribution networks [33]. It has been extensively used in both academia and industry and serves as a foundation for other commercial water distribution systems modelling programs, such as H2OMAP, PipelineNet, and WaterCAd [33].
EPANET was created by the U.S. Environmental Protection Agency and is capable of simulating the hydraulic and water quality behaviour in water distribution networks under steady-state settings and over long simulation periods [34]. EPANET tracks the water flow within each pipe, the pressure at each junction, and the water level within each tank. It may also be used to model the concentration of a chemical species, water age, and source tracking across the network during a certain simulation time.
2.2. Study Area
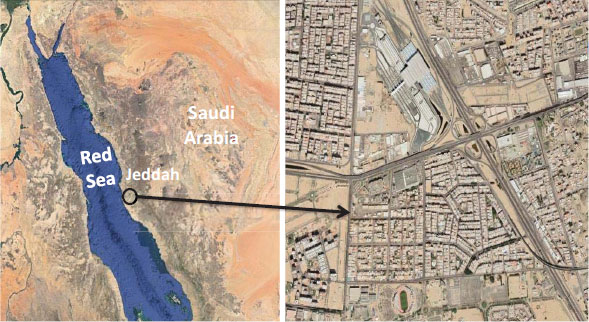
The study was conducted at a specific location located in the city of Jeddah, Saudi Arabia. The region is a residential zone with approximately 16,000 inhabitants. It spans an area of 1000 m by 814 m and is situated at coordinates of 21º 30’ 17” N, 39º 14’ 37” E (Fig. 2).
2.2.1. Water Supply Network Model
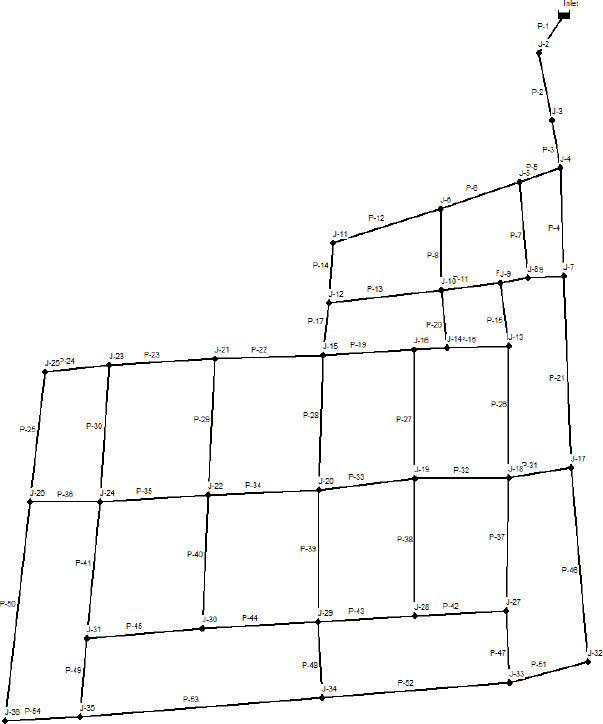
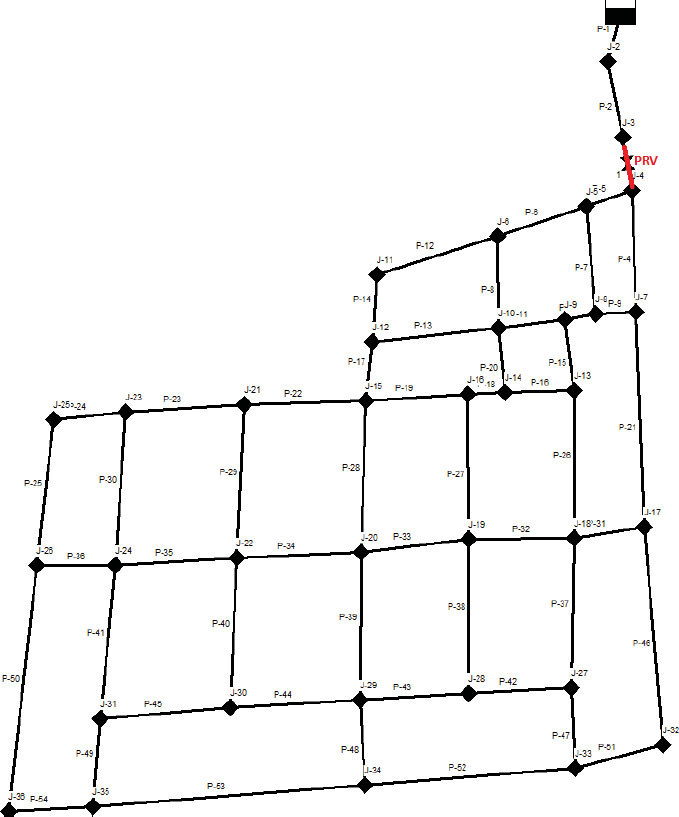
The primary water supply to the distribution network is an inlet, which serves as the point of entry for water from the larger network. Fig. (3) shows the simulated network, including identification labels for the different components (junctions and pipes). The total length of pipes is about 7.93 km, with varying pipe sizes ranging from 80 mm to 350 mm (Table 1). All pipes are manufactured from ductile iron. Table 2 presents the average base demand of each junction in the network.
| Pipes Number | Length (m) | Diameter (mm) | Pipes Number | Length (m) | Diameter (mm) |
|---|---|---|---|---|---|
| P-1 | 116 | 350 | P-28 | 199 | 200 |
| P-2 | 115 | 350 | P-29 | 195 | 150 |
| P-3 | 89 | 300 | P-30 | 200 | 150 |
| P-4 | 179 | 300 | P-31 | 95 | 250 |
| P-5 | 57 | 300 | P-32 | 132 | 250 |
| P-6 | 138 | 250 | P-33 | 135 | 250 |
| P-7 | 156 | 250 | P-34 | 161 | 150 |
| P-8 | 116 | 250 | P-35 | 159 | 150 |
| P-9 | 55 | 250 | P-36 | 104 | 100 |
| P-10 | 37 | 250 | P-37 | 192 | 150 |
| P-11 | 94 | 250 | P-38 | 199 | 150 |
| P-12 | 154 | 250 | P-39 | 192 | 150 |
| P-13 | 162 | 250 | P-40 | 191 | 80 |
| P-14 | 95 | 300 | P-41 | 195 | 150 |
| P-15 | 93 | 250 | P-42 | 130 | 100 |
| P-16 | 86 | 150 | P-43 | 131 | 100 |
| P-17 | 76 | 250 | P-44 | 158 | 150 |
| P-18 | 45 | 250 | P-45 | 155 | 150 |
| P-19 | 135 | 100 | P-46 | 269 | 200 |
| P-20 | 79 | 250 | P-47 | 92 | 150 |
| P-21 | 295 | 250 | P-48 | 91 | 150 |
| P-22 | 168 | 250 | P-49 | 98 | 150 |
| P-23 | 159 | 150 | P-50 | 290 | 100 |
| P-24 | 97 | 100 | P-51 | 102 | 150 |
| P-25 | 192 | 150 | P-52 | 262 | 150 |
| P-26 | 199 | 250 | P-53 | 322 | 100 |
| P-27 | 197 | 250 | P-54 | 101 | 100 |
| Node ID | Demand (L/s) | Node ID | Demand (L/s) |
|---|---|---|---|
| Inlet point | 52.06 | J-19 | 2.54 |
| J-2 | 0 | J-20 | 2.54 |
| J-3 | 0 | J-21 | 3.39 |
| J-4 | 0.611 | J-22 | 4.6 |
| J-5 | 1.34 | J-23 | 1.08 |
| J-6 | 0.67 | J-24 | 0.67 |
| J-7 | 1.462 | J-25 | 1.09 |
| J-8 | 1.462 | J-26 | 0.67 |
| J-9 | 0.728 | J-27 | 1.78 |
| J-10 | 0.48 | J-28 | 1.78 |
| J-11 | 0.67 | J-29 | 0.93 |
| J-12 | 0.48 | J-30 | 0.8 |
| J-13 | 1.58 | J-31 | 0.67 |
| J-14 | 1.58 | J-32 | 1.21 |
| J-15 | 4.09 | J-33 | 1.78 |
| J-16 | 2.68 | J-34 | 1.19 |
| J-17 | 1.21 | J-35 | 0.72 |
| J-18 | 2.43 | J-36 | 0.67 |
For newly manufactured ductile iron pipes, the Hazen-William roughness coefficient (CHW) is 145 [36]. However, it is commonly known that pipe roughness varies over time. The roughness of the pipes tends to increase as a result of the accumulation of corrosion products on the inner walls, leading to incrustation and tuberculation. As the roughness increases, CHW decreases, resulting in a larger frictional head loss in the pipe flow. Consequently, the calculation of head loss in a network involves the use of an adjusted roughness coefficient in the Hazen-William equation. The model calibration resulted in a CHW of 135.
2.2.2. Daily Demand Curves
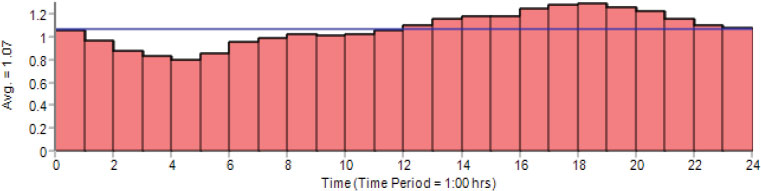
Water demand varies during the day, so the variation in demand patterns was considered in this study to make the simulation more realistic when looking at longer time frames. Fig. (4) shows the daily demand curve for Jeddah obtained from the National Water Company (NWC) [37]. This curve was used for the simulation in the current study and depicts how the rate of water consumption varies throughout the course of a day (24 hours). It provides the maximum demand factors in the form of multipliers that can be used to calculate the average base demand at a specific time.
2.3. Modelling Leakage in the Network
The fundamental physics governing the treatment process involves understanding the hydraulics of leaks and incorporating them into existing models of the water distribution system. Existing models attempt to model leaks from WDS using the orifice flow equation (Eq. 1), which suggests that leakage is proportional to the square root of the pressure head in the pipe.
 |
(1) |
Here, q is the rate of flow, Cd is the discharge coefficient, A 0 is the orifice area (area of the leak), g is the gravitational acceleration, and h is the pressure head. In practice, a more general leakage equation is used [22].
 |
(2) |
where C and N1 are the leakage coefficient and leakage exponent, respectively. This equation is part of the EPANET library and enables the simulation of fluid flow through a nozzle or orifice. Consequently, it may also be used to simulate a pipeline leak associated with a node [38].
The exponent N1 is normally assumed to be constant across the network and is usually taken to be the theoretical value of 0.5 for orifice flow. However, experimental and field studies have shown that the leakage exponent may be significantly higher than 0.5. On average, this value ranges from 0.35 and 2.95 [22, 24, 39-41]. This finding indicates that leaks in water distribution systems are more sensitive to changes in pressure than anticipated from the orifice flow equation.
According to the Saudi Water Partnership Company (SWPC) [42], the leakage rate in the distribution systems is estimated to be about 40%. The occurrence of this leakage can be attributed to several factors, such as unrecorded water usage, unauthorized connections, and defects in the distribution infrastructure. The total network water inflow at the critical time of 4:00 (when the lowest demand occurs) is 39.67 L/s, and it is assumed that the percentage of leakage from the total flow implies a leakage rate of 15.86 L/s. To include leakage in network models, the methodology proposed by Cobacho et al. can be used [43]. The leakage rate (15.86 L/s) was included as an additional demand at each junction with a value of 0.453 L/s. Given an average pressure head of 50 m in the network and assuming a pressure exponent (N1) of 1.38, the emitter coefficient C in Eq. (2) is 0.07.
This method was implemented in the network to determine the emission coefficient, which was then input into EPANET to model leakage. The network was first simulated in EPANET without the inclusion of a pressure-reducing valve. After identifying the valve's location, leakages were simulated by assuming the installation of the pressure-reduction valve. The impact of the valve installation was assessed.
3. RESULTS AND DISCUSSION
3.1. Calibration and Validation of the Model
In this study, the conventional method of calibration by trial and error was adopted [44]. The flow delivered to the district-metered area entered at a single point where the temporal variations in flow and pressure were continuously measured and recorded by SCADA. A portable pressure meter was used in the field to monitor additional water pressures.
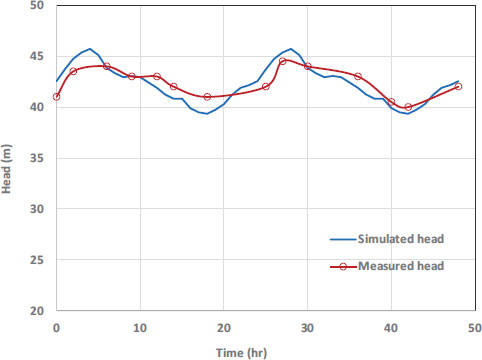
Fig. (5) shows a comparison between measured pre- ssures and those simulated by EPANET as an example. The mean absolute error (MAE) was employed to measure the disparity between the model's predictions and the actual data, yielding a value of approximately 0.899 m. After calibrating the hydraulic model, it was verified using additional datasets collected in the field under various conditions [44, 45]. Different datasets from those used in the calibration process were employed in the validation tests.
3.2. No-Leakage Scenario
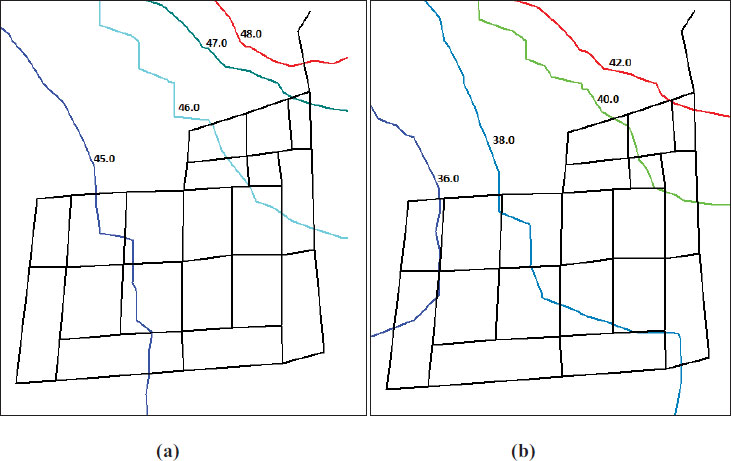
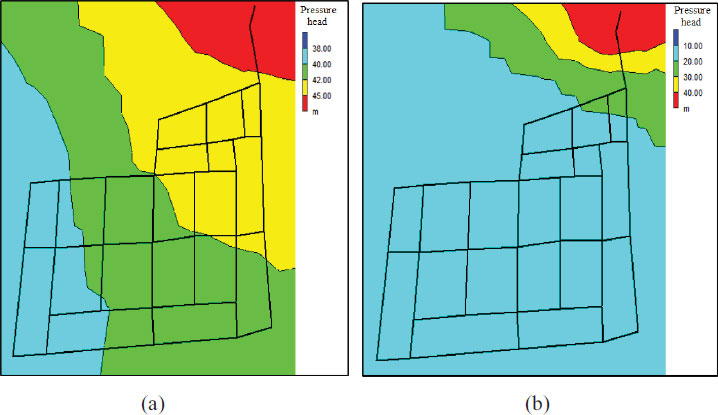
Graphs were generated for the scenario with no leakage to assist in understanding the obtained results. Fig. (6) displays the simulated pressures in the network at the lowest demand time (4:00), when the pressure is normally high, with a total inflow of 39.67 L/s from the reservoir to the district metered area. There are more junctions with a maximum pressure head between 44 m and 48 m during the periods of lowest demand, as shown in Fig. (6a). The pressure heads distributed at the time of greatest demand (18:00) were in the range of 35 m to 42 m (Fig. 6b) with a total inflow of 63.96 L/s from the reservoir to the district metered area.
Since the water supply to the distribution system is irregular, every household basically stores water underground in storage tanks. Under these conditions, a 5-m pressure head at a service connection is sufficient, according to the NWC. For continuous supply, however, other researchers, such as Aldana and Lopez [46], suggest a pressure head between 15 and 50 m. Al-Zahrani [27] reached pressure heads of 28–33 m. Kepa and Stanczyk-Mazanek [47] reported pressure head values of 29–54 m. In the current study, when examining the distribution of pressures at the time of lowest demand (4:00), the pressure head values were considered to be high as they ranged between 44 m and 48 m, as shown in Fig. (6a). Since the estimated leakage percentage in Jeddah’s water distribution system is about 40%, it is advised that an improvement and maintenance plan be established for the system.
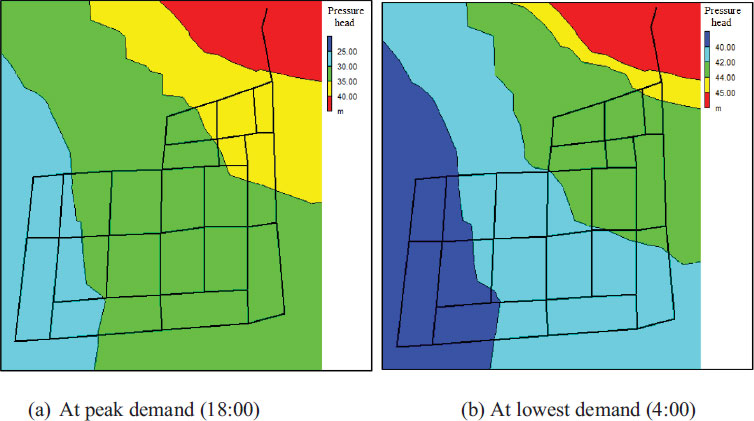
3.3. Leaks in the Network (40%)
Fig. (7) displays the pressure head distributions in the network in a scenario with 40% leakage. In this scenario, the pressure head was in the range of 27 to 47 m, and the majority of junctions had pressure heads above 30 m (Fig. 7a) at the time of greatest demand (18:00). During the period of least demand (4:00), the distributed pressure head was between 38 and 48 m, and the majority of the nodes experienced a pressure head above 40 m (Fig. 7b). The high pressures identified in this study highlight the necessity of installing pressure-controlling valves. These valves are essential for regulating pipes’ internal pressure to appropriate levels and avoiding high pressure that would cause breaks in the pipelines. This excessive pressure may also be linked to the loss of water, which must be controlled, so it is advisable to make an improvement plan for the system.
3.4. Use of Pressure-Reduction Valve to Reduce Leakage in the Network
According to the results, the need to implement a pressure-reduction valve was established. Pressure-reduction valves are devices that are installed at selected points in the network to reduce the leakage rate by reducing pipes’ internal pressures. They are designed to regulate the downstream pressure irrespective of the upstream pressure. Valves are normally located within a district-metered area and should be positioned downstream of flow meters to prevent any potential impact of valve-induced turbulence on the meter’s accuracy [10]. The installation of a 300-mm pressure-reducing valve was determined for pipe P-3 (upstream node J-4). The location of the valve is shown in Fig. (8). The pressure-reduction valve was set up to produce a constant pressure head of 20 m (in which case, the pressure head is reduced from 50 m to 20 m).
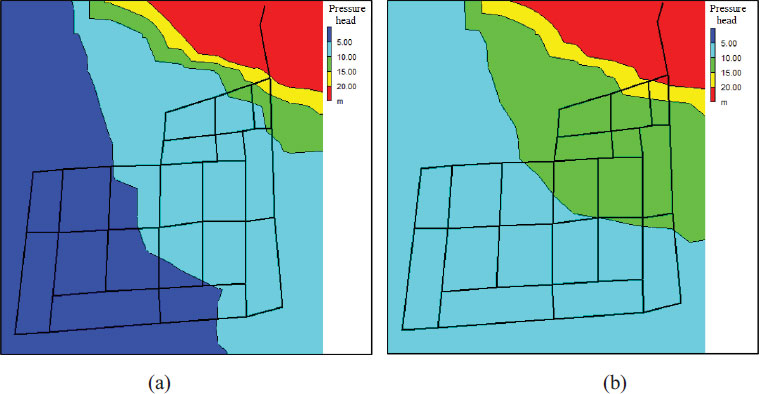
Fig. (9) displays the pressure contours for the district metered area at the time of least demand (4:00 am). Prior to the installation of the pressure-reduction valves, about 80% of the distributed pressure heads were above 40 m. Following the installation of the valves, approximately 20% of the pressure readings exceeded 20 m.
Generally, the highest leakage rate occurs at times of least demand (midnight to early morning), when the pressure head in the network is at its peak as a result of the low rate of consummation. Regarding the objective function of leakage minimization, at the time of lowest demand (4:00), the simulation showed that the hydraulic sector would achieve this goal by installing a pressure-reduction valve. The total inflow from the tank at 4:00 was 4829 m3/s before installing the pressure-reduction valve.
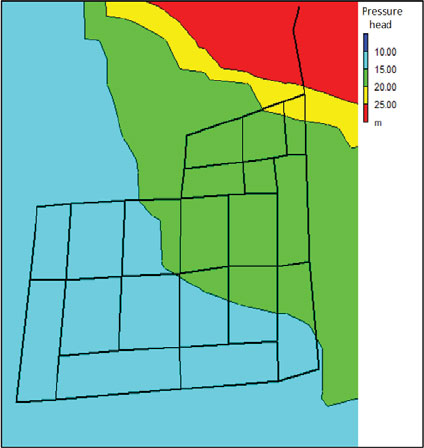
After installing the valve, the inflow decreased to 4347 m3/s, resulting in a reduction in leakage by 482 m3/d, which represents a 10% decrease in leakage rate. This provides confirmation that the deployment of the pressure-reduction valve is an effective solution that would enhance the distribution network behaviour. Fig. (10) shows the pressure contours after installing the pressure-reduction valve at the time of greatest demand (18:00). It can be seen that the lowest pressure in the district metered area was 10.29 m at peak demand, which satisfies the minimum requirement of 5 m according to the NWC.
It can be concluded that reducing the pressure head from 50 m (5 bar) to 20 m (2 bar) resulted in a 10% reduction in leakage in the district metered area. The average estimated daily savings would be 482 m3 per day, which would help extend the lifespan of assets and lower repair costs. This would also result in a 40% reduction in pipe bursts across the district-metered area zone, according to the NWC [37]. The findings of this study on leakage reduction through pressure control are in agreement with those from previous studies [23, 24]. The leakage rate and the frequency of new leaks are reduced by reducing and stabilizing the pressure in the distribution system.
One of the key advantages of implementing hydraulic modelling is its effectiveness in addressing network leakage. Through accurate simulation of water flow, hydraulic models provide insights into areas with high pressure. The hydraulic model can then be used to identify an optimal approach to pressure management, including the installation of pressure-reducing valves or rezoning sections, to reduce leakage risks, and improve overall system performance.
3.5. Effect of Closing Some Pipes on Pressure Head in the Network
Water distribution systems frequently experience scheduled maintenance and unscheduled disruptions (such as pipe bursts), which lower system performance [48]. The impact of closing some pipes on the pressure head in the network was examined. The network is fed through two main pipes: P-4 and P-5. If one of the two pipes is sealed, the western and southern regions of the network will have only one entry point. An extended simulation period was used to evaluate the network's performance under these conditions.
Fig. (11) demonstrates the impact of closing pipes P-5 and P-4 on the pressure distribution throughout the network. The variation of pressure head at the peak demand time (18:00) after closing pipe P-5 ranged from 1.5 to 20 m, whereas the pressure head changes caused by closing pipe P-4 ranged from 5.3 to 20 m. Hence, the closure of pipe P-5 had a more significant impact on the pressure distributions compared to the closure of pipe P-4. Closing P-5 resulted in pressure heads at some nodes in the network (J-25, J-26, and J-36) dropping below the minimum requirement of 5 m according to the NWC, which was not the case when closing P-4. The implications of these cases should be considered for planned and unplanned maintenance of water distribution systems.
CONCLUSION
Water distribution system leaks have considerable economic and environmental repercussions. They lead to wastage of water, revenue losses, and energy inefficien-cies associated with treating and transporting water that never reaches the intended customer. Consequently, proficient leakage management in water distribution systems is essential to secure water supply and safety. This study employed hydraulic modelling to evaluate water supply networks and implemented pressure control management as a pivotal engineering strategy to mitigate leaks and improve the efficiency of water distribution systems. For this purpose, a hydraulic model was created using EPANET. The model was calibrated and validated using data from SCADA. Pressure management using a pressure-reduction valve was then implemented to reduce the amount of leakage in the water distribution systems. The hydraulic model was used to determine the optimal pressure for the pressure-reduction valve, to simulate leakage, and to forecast the water savings due to pressure control.
Application of pressure management to the study area showed that the reduction in water pressure (from 5 bar to 2 bar) resulted in an immediate reduction in physical water losses. The leakage volume through the district-metered area at the time of maximum pressure dropped by 10% after pressure reduction. Besides leakage reduction, pressure control was estimated to reduce the frequencies of pipe bursts by 40% across the study area, thus reducing the number of repairs and protecting and extending the lifespan of infrastructure.
The study concluded that pressure control should be integrated with hydraulic modelling for effective leakage reduction. The methodology employed has demonstrated improved system performance, yielding successful outcomes for medium-sized water networks. Nevertheless, it is advisable to conduct additional studies to examine the impact of pressure changes on water quality within distribution systems.
LIST OF ABBREVIATIONS
| A 0 | = Orifice area (area of the leak) |
| C | = Leakage/Emitter Coefficient |
| Cd | = Discharge coefficient |
| CHW | = Hazen-Williams Coefficient |
| g | = Gravitational acceleration |
| h | = Pressure Head |
| MNF | = Minimum Night Flow |
| MAE | = Mean Absolute Error |
| N1 | = Leakage Exponent |
| NWC | = National Water Company |
| NWR | = Non-revenue Water |
| q | = Rate of Flow |
| SWPC | = Saudi Water Partnership Company |
CONSENT FOR PUBLICATION
Not applicable.
AVAILABILITY OF DATA AND MATERIAL
The author confirms that the data supporting the findings of this study are available within the article.
FUNDING
None.
CONFLICT OF INTEREST
The author declares no conflict of interest
ACKNOWLEDGEMENTS
The author would like to express gratitude to Umm Al-Qura University for the support provided during the research.

