All published articles of this journal are available on ScienceDirect.

Sewer Inlets Detection in UAV Images Clouds based on Convolution Neural Networks
Authors Info & Affiliations
Abstract
Background
Unmanned aerial vehicle (UAV) systems have underwent significant advancements in recent years, which enabled the capture of high-resolution images and accurate measurements, with the tremendous development in artificial intelligence, especially deep learning techniques, Which allows it to be used in the development of Drainage infrastructures that represent a major challenge to confront the flood risks in urban areas and represent a considerable investment, but they are often not as well classified as they should be.
Methods
In this study, we present an automatic framework for the detection of sewer inlets and Ground Control Points (GCPs) from image clouds acquired by an Unmanned Aerial Vehicle (UAV) based on a YOLO CNN architecture. The framework depends on the high image overlap of unmanned aerial vehicle imaging surveys. The framework uses the latest YOLO model trained to detect and localize sewer inlets and Ground Control Points (GCPs) in aerial images with a ground sampling distance (GSD) of 1 cm/pixel. Novel Object-detection algorithms, including YOLOv5, YOLOv7, and YOLOv8 were compared in terms of the classification and localization of sewer inlets and GCPs marks. The approach is evaluated by cross-validating results from an image cloud of 500 UAV images captured over a 40,000-m2 study area with 30 sewer inlets and 90 GCPs. To analyze the model accuracy among classes, two-way ANOVA is used.
Results
Images with models’ performances from the literature, the new YOLO model tested on UAV images in this study demonstrates satisfactory performance, improving both precision and recall. The results show that YOLOv5 offers the best precision (91%) and recall (96%), whereas YOLOv8 achieved less accuracy in precision and recall (82%) and (80%), respectively. Additionally, increasing image size in the training stage is a very important modification in the model.
Conclusion
The study approach has a remarkable ability to detect sewer inlets and can be used to develop the inventory of drainage infrastructure in urban areas.
1. INTRODUCTION
Urban growth is a continuing trend, and the development of entombed utility networks is an important part of its outgrowth, but locating network items is a hard mission. The object classification (larger than houses or equal) in aerial images has been extensively researched in the last studies, but small object localization is very challenging and rarely studied because of many factors, such as the difference in object colors, crowded neighborhoods, aspect ratios, shadow effect, and non-uniform background [1].
1.1. Artificial Intelligence (AI) and Remote Sensing (RS)
Artificial Intelligence (AI) and Remote sensing (RS) present an automated solution to error-prone and expensive traditional data collection. Remote sensing (RS) processes depend on data collected for small infrastructure objects at street level that are found on roads. In that respect, aerial imaging is very reliable; aerial imagery with high resolution can normally be georeferenced and rectified with centimeter-level accuracy. Although the georeferencing accuracy and rectification depend on the quantity and quality of GCPs, this is usually not important in height terrain urban areas. UAV imagery achieves this, particularly thanks to its large image overlap and very high GSD. Several studies investigated manhole cover detection, but sewer inlet (S.I) detection in aerial imagery has not been studied. From the standpoint of remote sensing, sewer inlets are like manhole covers in terms of construction material, frequency, location of occurrence, and size. So, it's important to illustrate the latest research in the detection of manhole cover. Pasquet et al. combined detection method, predictions from the SVM support vector machine, and HOG features with detection from a geometric circle filter. Trained and tested on GSD 4 cm/pixel aerial imagery, the method achieved detection equal to 40% of total manholes with 80% precision [2]. More recently, Commandre et al. implemented a deep learning CNN to detect manholes using aerial imagery with a (5 cm/pix) resolution. Although the resolution is lower, the performance achieved a recall of 50% and a precision of 69% [3]. Most of studies apply detection in a single view, to enhance the performance of detection, Vitry, Schindler et al. used multiple views and a Viola and Jones model to detect (S.I) in aerial images with 3–3.5 cm/pixel resolution. In the multiview approach compared with the single-view detector showed improvement in average precision, which increased from 65% to 73% [1]. The proposed method by Zhou et al. classifies the images into types of rainy and non-rainy, then based on the coarse classification results, performs manhole cover detections. The method achieves an accuracy in detecting manhole cover of 86% and an F1 score of 87% using the SVM model [4]. For aerial detection applications, UAVs are a natural competitor: when creating orthoimage using UAVs, recommended high overlap captured aerial images to reduce perspective distortion resulting from low flight height. It is recommended to have an overlap of more than 50% in the side and 70% in the front [5]. The high accuracy was achieved at (50 m) a flight altitude and (10) GCPs also proving that the accuracy of (X, Y) depends on the GCPs number. Mirko et al. illustrated the effect of the GCPs on the geometric accuracy of photogrammetric. The results illustrated that 3 GCPs for georeferencing for GIS applications, and it was recommended that 7 GCPs and cartographic production need 15 GCPs [6]. Jiménez-Jiménez 2021 et al. showed the DTMs' accuracy and quality depending on four factors: (1) the UAV system, either camera or UAV platforms; (2) image acquisition and flight planning (image overlap, flight altitude, flight line orientation, UAV speed, georeferencing, and camera configuration) (3) photogrammetric digital terrain model generation (software, ground filtering, and DEM generation) and (4) geomorphology. They recommended optimizing process variables to have high-accuracy DTMs [7]. Liu, Han et al. studied the influence of five factors on UAV photogrammetry (altitude, image resolution, overlap (side and front), GCPs, and focal length), The results prove a better design for processes that produce high accuracy [8]. A few years ago, J. Redmon et al. presented a novel model based on a Convolution Neural Network for object detection named You Only Look Once (YOLO). They used a single CNN to predict bounding boxes and then class probabilities directly from the full image in one evaluation. So, the detection pipeline can be enhanced directly on prediction performance [9]. Since the original version (YOLOv1) of the novel model achieves a low (mAP), they have improved the model to a new version (YOLOv2) [10]. YOLO deep learning method in the road field presents an applicable method for the detection of road diseases like pavement crack prediction [11]. Zhu et al. proposed the capture of road distress images using a UAV depending on three CNN models for object detection YOLOv4, R-CNN, and YOLOv3 that were trained on the dataset, and compared their performance [12]. In the agriculture field, Puliti et al. used the YOLOv5 model to recognize tree leaves and then classify the trees depending on leaves damage. UAV imagery was acquired from 89 study areas and was manually annotated into 55 thousand single trees classified into three classes based on their health. The results showed a precision of 76% and recall of 78% [13]. Recently, new versions of the YOLO model, namely, YOLOv5, YOLOv7, and YOLOv8, have become more accurate in object detection [14].
1.2. Scope and Novelty of Study
The study aims to create an automated method for detecting small objects to identify sewer inlets using UAV clouds for orthophoto. In total, 500 images were acquired covering an area =40000 square meters used as a case study with 30 S.I sewer inlets and 90 GCPs. Additionally, the optimal UAV flight settings were examined to ensure accurate orthophoto and DEM generation using the Agisoft Metashape program. Novel Object-detection algorithms, including YOLOv5, YOLOv7, and YOLOv8, were compared to the classification of sewer inlets and GCPs. This study is the first clarification of the latest YOLO detector based on UAV images in the water management field.
2. DATASETS AND STUDY AREA
2.1. Data Acquisition
A low-cost UAV (DJI Phantom) is used to acquire images during a half-hour maximum flight time. The UAV has a 16 MP compact digital camera (8.8 mm Focal Length) controlled by UAV autopilot. The GCPs coordinates were determined by a Trimble R8 GNSS. The UAV was flown over an area of 40000 m2 and 40 m flight height. In total, 500 images were taken with a GSD of 1 cm/pixel. In the study area, 30 sewer inlets and 90 GCPs were identified in the UAV images as shown in Table 1.
| Location | Mosco-Russia |
|---|---|
| Date of data collection | January 2021 |
| Weather case during flight | Overcast |
| Area | 40,000 m2 |
| Altitude | 40 m average |
| Lateral and Frontal overlap | 80% and 60% respectively |
| No. of GCPs | 90 |
| Data Quantity | 500 images |
| Aquation data duration | 2 * 30 min |
| GSD Image | 1 centimeter per pixel |
| Image resolution | 4864 x 3648 pix |
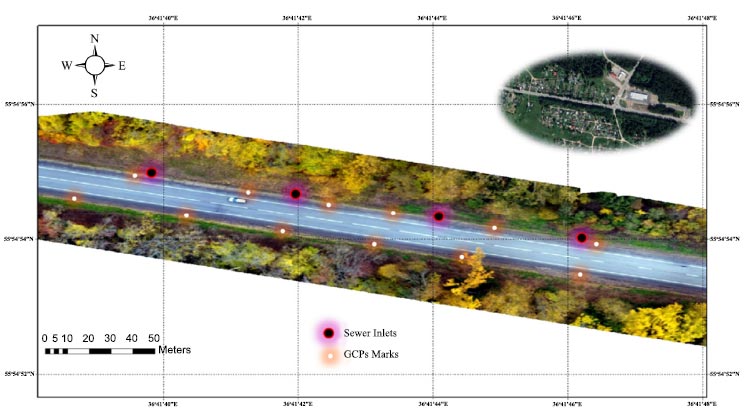
Study area (40,000 m2) used as a case study for this work. The Generated Orthoimage and DEM.
| GCP | Error X (cm) | Error Y (cm) | Error Z (cm) |
|---|---|---|---|
| Min | -7.9 | -1.2 | -39.1 |
| Max | 2.7 | 1.2 | 54.9 |
| Total | 4.9 | 0.9 | 37.5 |
Table 3.
| Seq | Tool | Function |
|---|---|---|
| 1 | UAV DJI-phantom | Image acquisition. |
| 2 | GPS | Observation GCPs coordinates. |
| 3 | Metashape Agisoft | Orthophoto and DEM Generation. |
| 4 | Python | The model writing language. |
| 5 | Roboflow | Dataset annotation. |
| 6 | YOLO Detector | Automatic Sewer inlets Localization. |
| 7 | Google Colab | Environment of Model Training and Validation. |
| 8 | CPU | Environment of Model testing. |
| 9 | Arc GIS | Map Production & Orthophoto Clipping and Merging. |
| 10 | ANOVA | Analysis of Variances for results. |
| NVIDIA- 525.85.12 | Driver: 525.85.12 | CUDA:12.0 |
|---|---|---|
| GPU Name Fan Temp Perf | Bus-Id .A Memory-Usage | Volatile .GPU- M. |
| Tesla T4 N/A 45C P0 25W/70W |
0MiB / 15360 MiB | 0% Default N/A |
2.2. Image Processing and Orthophoto Production
The Agisoft program was used for image processing [15] to evaluate the external and internal parameters of the camera and produce an orthoimage as well as DEM for the case study using the steps as shown in the program (Fig. 1).
The orthoimage is generated from the image projections by making a mosaic. For orthoimage georeferencing ten GCPs were used. The study area is shown in Fig. (1) and the registration error is shown in Table 2. The processing time to generate the orthophoto and DEM was 12 hours (using core i5, 12 GB RAM, and card 2 GB).
3. METHOD
Table 3. Data collection instruments and image processing tools.
3.1. Experimental Environment
The YOLO detectors were trained using 500 full-scale images captured with a resolution of 4864 x 3648 pixels, which needs a long processing time to train detectors. Because of the limited computing resources, the experiments were conducted on a Google Colab cloud server. PyTorch 1.2.0 was the experimental frame. Python was used for writing object-detection algorithms. to accelerate training GPUs were used (Table 4). PyTorch 1.2.0 was the experimental frame. Python was used for writing object-detection algorithms. to accelerate training GPUs were used.
3.2. Framework of Machine Learning
Workflow to train YOLO, as illustrated in Fig. (2), The study depends on resizing the original image into two image sizes before input to the network. First, the original image was resized to 640 pixels in YOLO5, YOLO7, and YOLO8. Second, the original image was resized to 1280 pixels. Before the training stage, Sewer Inlet and GCPs were labeled manually by rectangular boxes (ground-truth boxes) in all images. The collected images were divided into a training dataset with proportions of 0.8 and a validation dataset with proportions of 0.2. Data augmentation using roboflow was performed to increase the training dataset by three times. Finally, the dataset for training based on epochs (100 to 150) was input to the YOLO network architecture.
3.3. Model Training
The YOLO Convolution Neural Network architecture is a single-stage detector consisting of three parts: The first component is named backbone to extract features of an input image using cross-stage partial architecture that enhances the model size and speed of boosting [16, 17]. The second component, named the neck, is used to enhance the ability of the model on object scaling and unseen data transformation using path Aggregation net [18]. The third and final component named Head output vectors generated with the confidence of class, bounding box, and scores. Such a step is important to perform the final detection parameters. This step-in version 5 and previous versions have not changed [13]. The Sewer Inlets prediction using the YOLO model was studied in terms of precision, recall, and F1 score. Fig. (3) shows the small objects, Sewer inlets and GCPs used in training.
3.4. Loss Function
YOLO model corrected confidence values and coordinates of the bounding box using the square error loss are called the loss function [9]. Regression of the bounding box, objectness, and probability of a class for the three scores computed the loss function and then the compounded loss function [13].
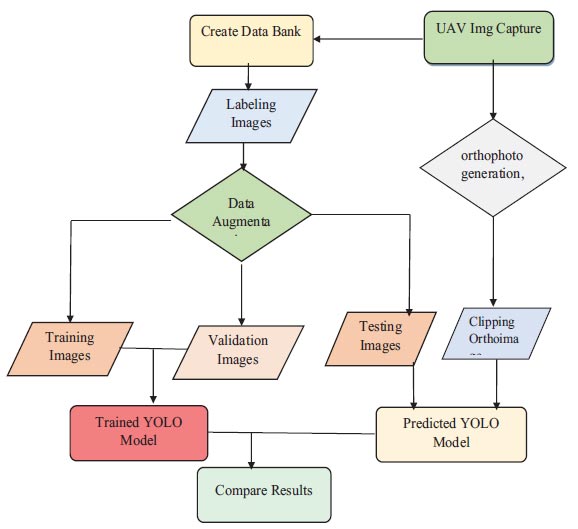
Flowchart of the proposed methodology.
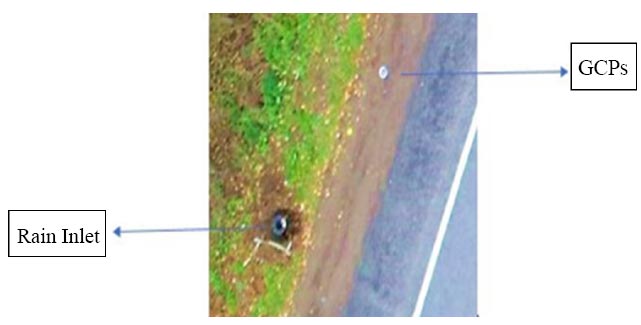
Shows the small objects used in experiment.
| Ground Truth Bounding Box | Results Prediction | - |
|---|---|---|
| - | (Positive) | (negative) |
| Objects (existing actually) | (TP) | (FN) |
| Nonobjects (not existing actually) | (FP) | (TN) |
3.5. Evaluation Metrics
Evaluation metrics of the model are Recall (R), Precision (P), which is equivalent to accuracy, and intersection over union (IoU), identical to mean average precision (mAP) [13] as illustrated in Eqs. (1 and 2):
 |
(1) |
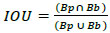 |
(2) |
Where:
Bp = Bounding Box predicted,
Bg = ground truth (BB),
(TP) = number of correctly predicted object samples,
(FP) = predictions number where non-objects are founded,
(FN) = number of undetected objects,
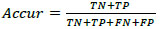
Accuracy model evaluated by metrics, P, R, and F1 as shown in Table 5 and Eqs. (3-5) [19]:
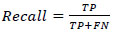 |
(3) |
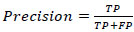 |
(4) |
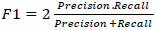 |
(5) |
Precision score equals correct prediction percentage, a greater IOU indicates a smaller P. The F1 score indicates confirmation of R and P metrics, and it is the harmonic mean of them. AP equals the P–R curve integration, which equals the area under the P_R curve.
3.6. Post-processing and Mapping
The possibility of using YOLOv5, YOLOv7, and YOLOv8 for purposes of mapping with orthophoto generating by image UAV needs to add post-processing steps, which are as follows: First, the UAV orthomosaic tiling: As described [20] the orthomosaic were tiled into suitable area with geoTIFF tiles (The image size in the prediction stage equals the image size in the training stage) using an overlap = 2 m between tiles. Second step was predicting each tile: using the best weights generated from the training model, for each tile coordinates of bounding box were predicted. Third, Image/map: YOLO predicted bounding box coordinates from the original images' top left corner in pixel values and then we converted it using the UTM coordinates to a geographical space. Fourth, Bounding/box: when the intersection between bounding box pairs was > 0.75, the smallest confidence of class and box was discarded.
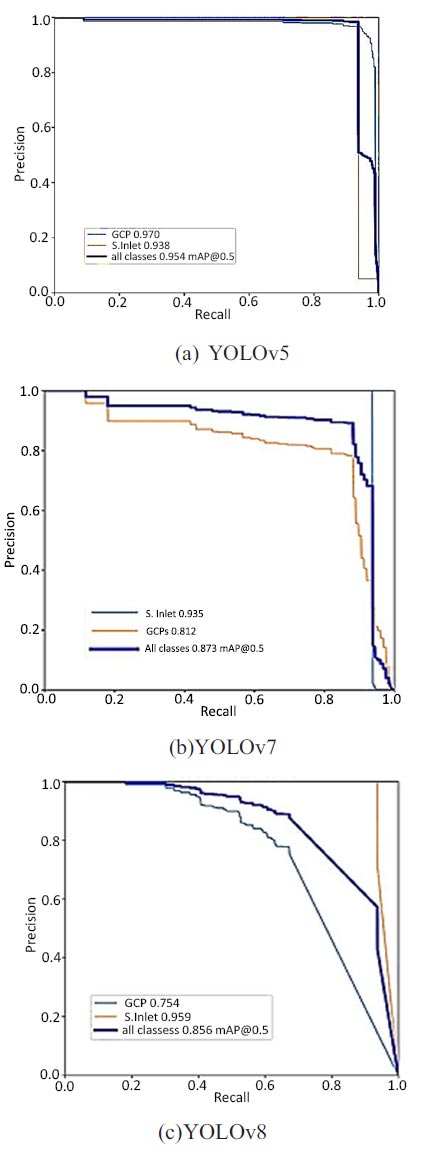
Sewer inlet and GCPs precision recall curve.
4. RESULTS AND DISCUSSION
4.1. Effect of YOLO Detectors on Object Types
Fig. (4) shows the P–R curves for sewer inlet and GCP using three YOLO models. The P–R curves for sewer inlet in Fig. (4) cover a larger area than the curve of GCPs, except Fig. (4a). The P–R curves for GCPs cover a larger area than the curve of sewer inlet, but it still covers the area greater than 93% indicating that sewer inlets have higher AP values.
Figs. (5a and b) shows the P, R, PR, F1 scores for Sewer inlet and GCPs using YOLO detector. YOLOv8 exhibits inferior performance in GCPs detection more than in sewer inlets with a mAP = 80% and 94%. YOLOv7 exhibits good performance than YOLOv8 with an F1 score and recall of 85% and 90%, respectively. YOLOv5 demonstrated better overall performance, with F1 score of 95.4% and recall of 96.4. Compared with model performances from the literature, the YOLOv5 model tested on UAV images in this study demonstrates satisfactory performance. Schindler et al used a test dataset of 252 images for S.inlet detection, achieving an AP of 73% with a Viola–Jones classifier. (Nie et al. used a test dataset of 400 images for pavement distress detection, achieving a MAP of 53.1% with YOLOv3. Mao et al. made some improvements based on the original YOLOv3 baseline, achieving a mAP of 52.3%. Zhong et al. used the YOLOv3 model tested on UAPD for pavement distress detection, achieving a mAP of 56.6%. Fig. (5) shows that YOLOv5 and YOLOv7 generally performed better than YOLOv8. Anchors in the three scales extract the object features of different regions. With the concatenation of low-level texture information with higher semantic features, YOLOv5, YOLOv7 and YOLOv8 are vigorous in sewer inlet detection. Compared with YOLOv8, YOLOv5 has a higher MAP, indicating better performance. They have similar architectures; the difference is that YOLOv8 includes some improvements. These improvements had little impact on small object detection with UAV images. Although the original YOLOv8 was found to be better than YOLOv5 with the COCO dataset, the performance with our dataset illustrates that YOLOv5 is still robust in sewer inlet detection and can be studied further to pursue a higher AP value. To verify the stability of these models, repeated predictions were made using the three models.
4.2. Effect of Repeat Training
Five additional training experiments were performed to ensure the validity of the model prediction performance. The experimental configuration was the same as that in the previous training. Figs. (6a and b) shows the mAP and F1 score of the third model. Fig. (6) illustrates the five experiments' results with stable performance. The error is in the range of 3% between all experiments, with volatility. Although the same weights are used, the training results are slightly different each time. Due to the random selection of training images in each batch and the variety of gradients, it has led to slightly different predictive results in each training round. The results of the YOLOv5 model once again showed a performance distinct from other models.
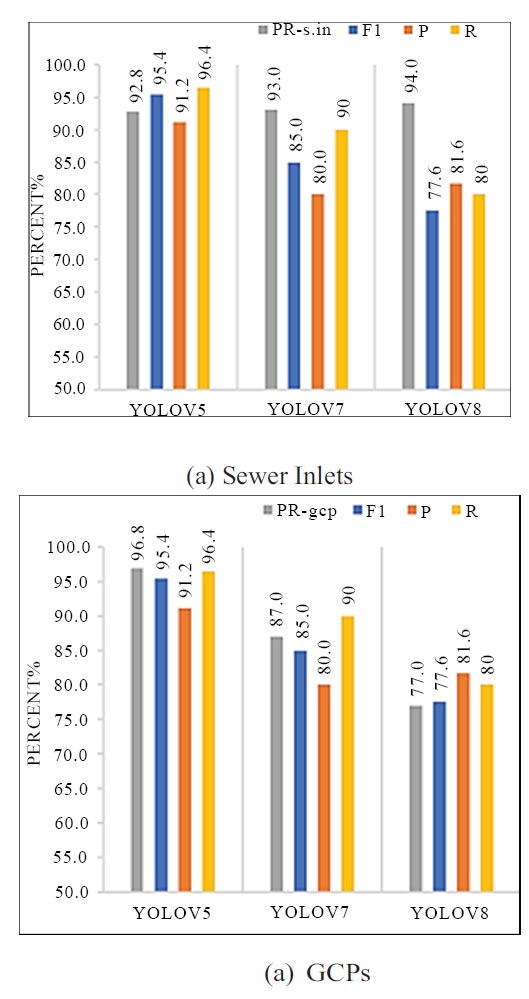
Metrics (P-R, P, R and F1 score) for three YOLO detectors.
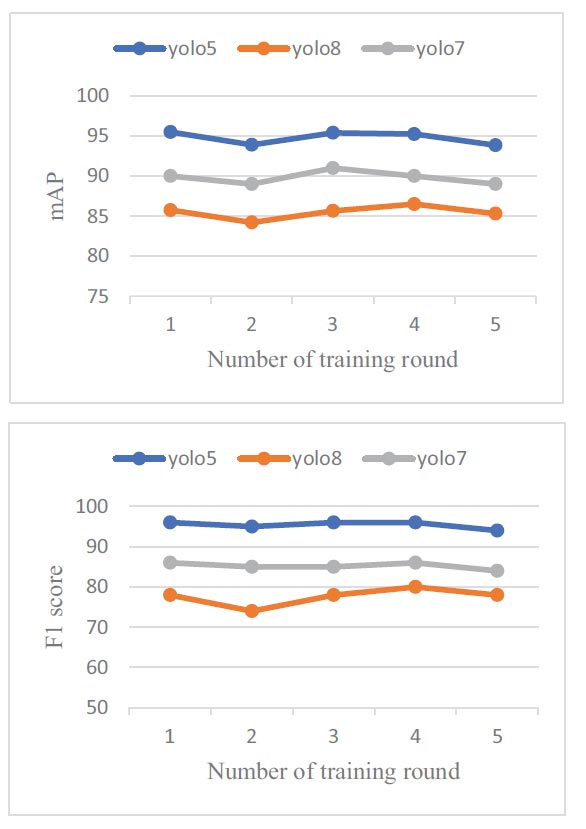
Model prediction with repeated training (mAP) and (F1 score) respectively.
4.3. Effect of MaxEpoch on Dataset Augmentation
Adjusting MaxEpoch significantly affects object detection accuracy. To enhance the S. inlet and GCPs detection performance of YOLO detectors, MaxEpoch should be at least 50. An epoch refers to the total number of iterations through the entire training dataset in one cycle and is critical to deep learning performance (Deng, Lu et al. 2020). Determining the number of MaxEpochs can provide information regarding the maximum iterative epochs that enhance network performance to a certain degree, although no further significant improvement can be achieved. In this study, max epochs (150) in the training were investigated. To examine the effect yielded, the testing accuracy of YOLOv5 was recorded, and the result is presented in Fig. (7a and b). The error bands of accuracy for all the augmentation steps were generally <5%, which indicates high testing replicability. The accuracy of object detection increased significantly as MaxEpochs increased up to 50. However, a further increase in MaxEpoch did not yield much better detection performance yet extended the runtime in cases 900 images and 1200 images, but it increased after 100 MaxEpochs in 300 images and 600 images. Hence, the optimal MaxEpoch was determined to be 70–100 for achieving accuracies exceeding 94% by 900 images and 1200 images. For 600 images, the accuracy improved by more than 95% after 100 MaxEpochs was increased. In general, dataset augmentation achieved higher (95%) accuracies at less than 100 MaxEpoch, to achieve the same accuracy when dataset augmentation did not use more than 100 Max Epoch indicating augmentation dataset reducing MaxEpochs.
The study presents recall and F1 score for testing datasets, as shown in Figs. (8a and b). YOLOv5 and YOLOv8 achieved values > (95% and 77%) for recall, and > (95% and 74) for F1-score. The reliability of autonomous Sewer Inlet detection in UAV images by a deep learning method is very much dependent on the databank size of the training images. During the training process, 300, 600, 900 and 1200 training images were created via data augmentation and input into the deep learning network of YOLO. Fig. (8) displays the average accuracies of YOLO detectors trained by different numbers of images. In general, the accuracy of Sewer Inlet detection increased to a platform with the number of training images. YOLOv5 presented a significant improvement in accuracy (Recall was increased from 93% to 98%), when augmentation was applied on training images. YOLOv7 showed relatively low accuracies in terms of Sewer Inlet detection when the number of training images increased from 300 to 600, but the Recall was still more than 95%. Compared with YOLOv5, it indicated better performance in terms of accuracy over the range of a number of training images. Based on this parametric evaluation, a minimum of 300 training images are recommended for training a YOLO detector such that it reliably detects Sewer inlets in UAV images.
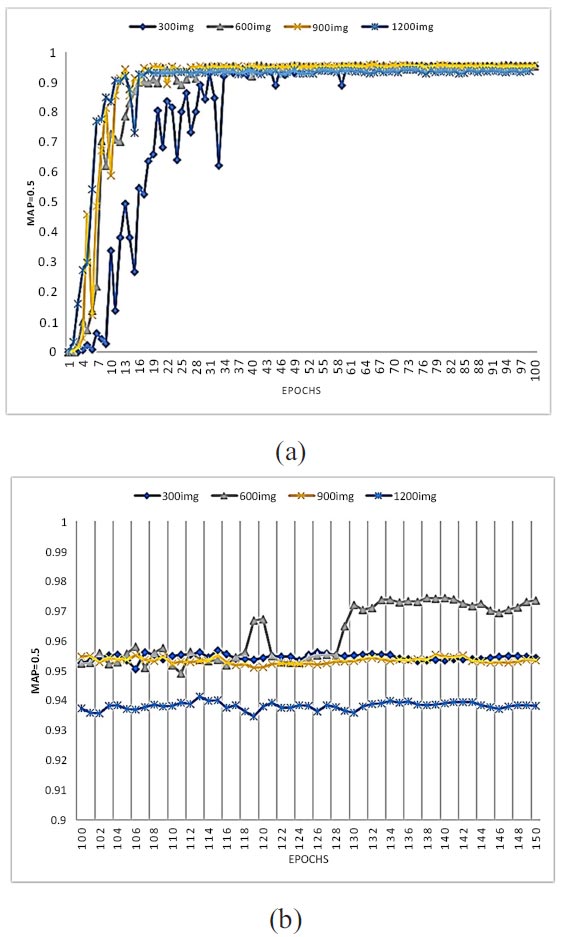
Effect maxepochs on dataset augmentation based on YOLOv5.
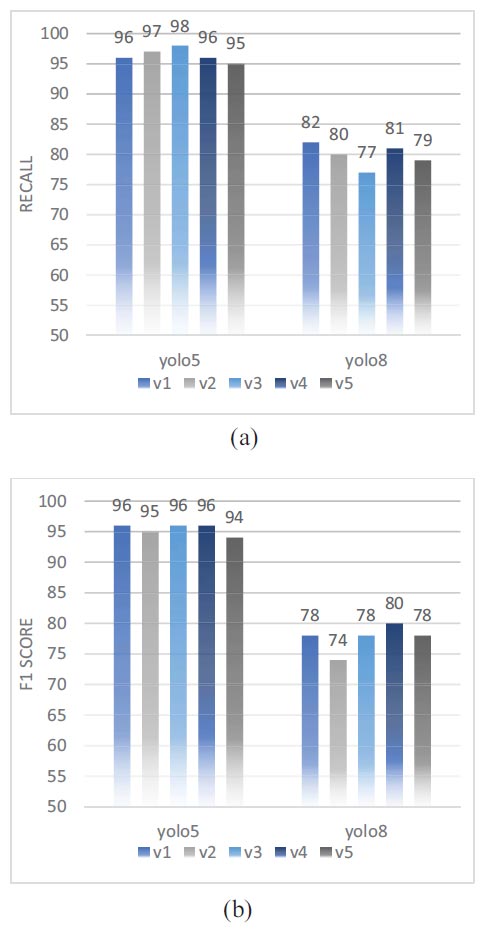
Effect of augmentation on recall and F1 score.
4.4. Results of YOLO Models
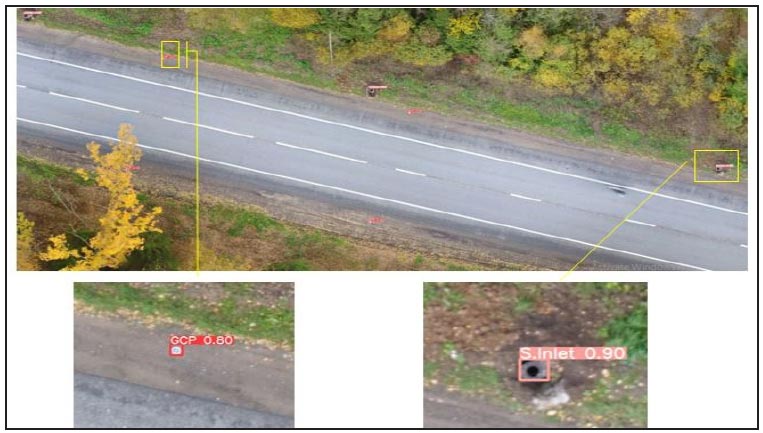
Results of YOLO model are shown in Fig. (9a). Predictions of Sewer inlets and GCPs using YOLOv5 were generally better than YOLOv8. Based on the mAP of the SI and GCPs were calculated as 80% for the three models. Sewer inlet detection using YOLOv5 was 96% for Recall, compared with 73% achieved by Vitryet al., proof of the potential of UAV sewer inlet prediction based on CNN. Sewer inlet and GCPs prediction results by YOLOv5 and YOLOv8 are presented in Figs. (9a and b), YOLOv5 is the best model in prediction. Sewer inlets have parallel features and are extensively annotated in a dataset, so, they can be predicted well with high-confidence values, as shown in Fig. (9).
4.5. Orthophoto Predictions
The YOLOv5 model appeared to have excellent consistency between the visible Sewer Inlets and Bounding box prediction and highlighted in the Orthophoto as shown in Fig. (10). The model has an important advantage as the ability to recognize Sewer Inlets in crowded scenes and different features in Orthophoto with a (GSD) of 1 cm/pixel; the YOLOv5 model achieved 96% accuracy for Sewer Inlets detection.
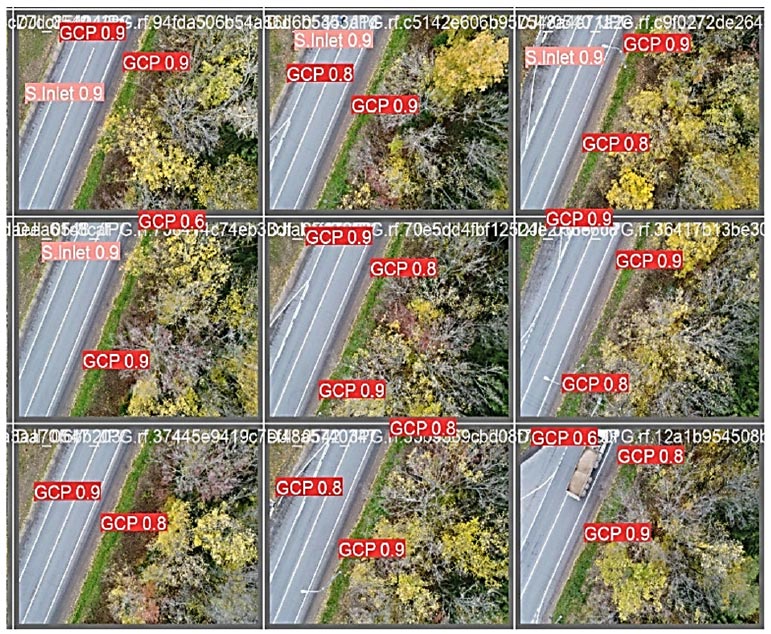
Sewer inlets and GCPs detection results. YOLOv5.
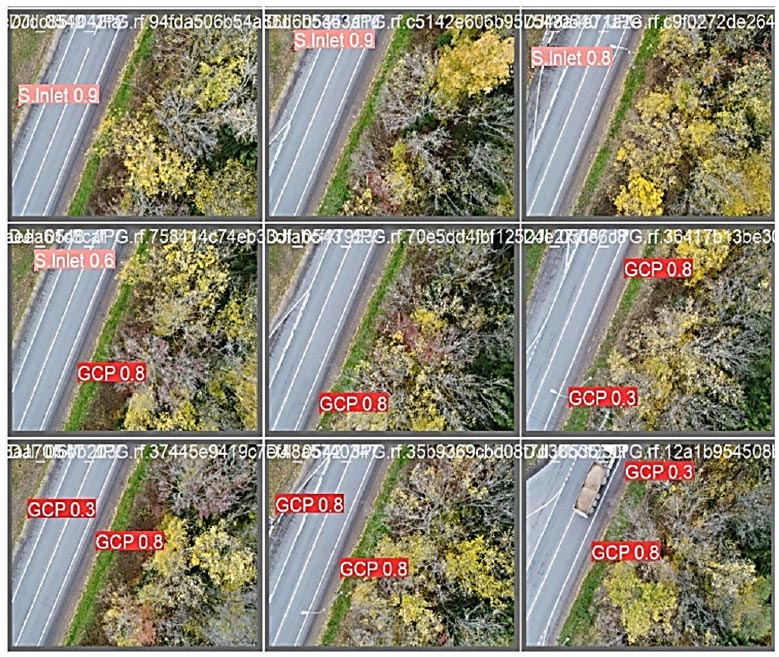
Sewer inlets and GCPs detection results (YOLOv8).
4.6. ANOVA Two-way Test
To analyze the model accuracy among classes, ANOVA (two-way) is used [24-26]. The test is conducted to compare the (mAP) for two classes in each model. Two versions of the YOLO model (V5 and V8) called M and two classes (S.Inlet and GCPs) called C are taken as factors. ANOVA's first step should be declared null [27]. A Null hypothesis is called H0. The alternative is called H1.
 |
(6) |
 |
(7) |
 |
(8) |
ANOVA was performed as illustrated in the studies [28, 29]. Here, the sum of squares was declared as three types: sum of square for factor M (SSM), sum of square for factor C (SSC), and sum of square for both factors M and C (SSMS). The two-way ANOVA can be calculated by declaring the factors M and C as model and class, respectively. The result of the calculation is shown in Table 6.
From Table 6, the F-value is calculated as 130. So, it is denoted as the calculated F-value.
 |
(9) |
 |
(10) |
Critical F-value is 4.5. So, it is denoted as tabulated F-value.
 |
(11) |
Prediction of sewer inlets and GCPs in orthophoto.
| Source of Variation | SS | df | MS | F | P-value | F crit |
|---|---|---|---|---|---|---|
| Classes | 211.25 | 1 | 211.25 | 130.582599 | 4.16471E-09 | 4.49399848 |
| Models | 432.45 | 1 | 432.45 | 267.315716 | 2.08489E-11 | 4.49399848 |
| Interaction | 555.458 | 1 | 555.458 | 343.352187 | 3.09506E-12 | 4.49399848 |
| Error | 25.884 | 16 | 1.61775 | - | - | - |
| Total | 1225.042 | 19 | - | - | - | - |
When the calculated F-value is greater than the tabulated F-value, the null hypothesis can be rejected. Here, the calculated F-value is 130 and the critical F-value is 4.5. Hence, the null hypothesis can be rejected, and the alternative hypothesis can be accepted.
Analysis proves that there is a significant relationship between the mean values of the two factors. By declaring the models and classes as two factors, the two-way analysis proves that the mean values of (mAP) vary between each model and each class, (mAP) was better. During S inlet, it reached 95% with YOLOv5, but in GCPs, it was less than 77% with yolo8.
5. RECOMMENDATION
There are many possibilities for the development of an automated sewer inlet detection approach and drainage mapping using aerial imagery, but two main limitations need more study. First limitation, the sewer inlets are not visible in (UAV) images because they are temporarily covered by trees and debris or vehicles. This problem can be reduced by performing flights at different times. The second limitation, there are many sewer inlet forms and situations. In our case study, only one type of sewer inlet is trained. To adjust this variety, first must increase the training data variety, second, best adaptation of image capturing, like increasing camera tilt. Therefore, depending on the relevance of the illustrated limitations and the completeness required of the data, it may be necessary to either adjust the detection approach or verify the detection results manually.
CONCLUSION
The paper studied how to develop a YOLO model, through the combined use of a labeled database of UAV images and Convolution Neural Networks, to predict sewer inlets and GCPs accurately and mapping them. The important study results are that the model achieved suitable accuracy metrics for a sewer inlet, with a validated case study using 500 UAV full-scale images.
Results show that the use of the YOLOv5 model increases (AP) from 0.73 to 0.92 as compared to a literature review. The gain is attributed to the ability to exploit the full resolution of the raw UAV images.
This study can identify more than 92% of the (S.I and GCPs) with a precision of 96% and localize them when using a YOLOv5 detector that trained on 500 UAV images and max epochs 200 and based on YOLOv8 at the same factors was able to identify about 82% of the (S.I and GCPs) with precision of 80%.
Both P, R, and mAP are substantially better than the last results for the sewer inlet and manhole cover detection.
Now, urban water practitioners can create and update their inventory, the value added by the YOLOv5 detector is more than the incremental improvement that is usually gained by tuning the image classification method. Thus, this (S.I) detection solution can be used to develop the inventory of drainage infrastructure in urban areas.

