All published articles of this journal are available on ScienceDirect.

Sedimentation Analysis Study in Lake Tondano Due to the Development of the Surrounding Area
Authors Info & Affiliations
Abstract
Background
Population growth has increased the need for food, putting great pressure on the environment. This has triggered economic development and land use alternation, which have a major impact on the hydrological cycle. Natural and human factors have impacted the water catchment area of uncontrolled land cover changes in Lake Tondano, which is shallow from a depth of 36 meters to 14 meters due to soil erosion.
Objective
This research emphasizes the assessment of the lake, considering the efforts of conservation and analyzing its influence on the erosion rate and shallowing of the lake. The impact of land use dynamics on sedimentation is essential in providing alternative efforts for land conservation and, subsequently, optimum utilization.
Methods
The analyzing process requires rainfall data and land use maps, including soil type maps and land slope data, while the process itself is assisted by spreadsheets and GIS. In addition, the Universal Soil Loss Equation (USLE) and Sediment Delivery Ratio (SDR) model deliver the expected result of the total sediment production entering the lake.
Results
The calculated total value of actual sediment production governs the thickness of sediment deposition at the bottom of the lake.
Conclusion
The research concludes that the thickness of sediment deposition at lake bottom can be resolved by the total value of actual sediment production, whereas the value is analyzed from the USLE and SDR models previously correlated to bathymetry measurement.
1. INTRODUCTION
The dynamics of land use and land cover change is a global issue that is a concern and challenge in maintaining the balance of nature. This significant change phenomenon causes problems in the ecosystem, as well as both land and water resource sustainability [1, 2]. Natural and human factors in global land cover change, especially in terms of changes in forest cover to other types of land cover, have become one of the important issues in global change research [3]. In the global issue, the lake is a natural resource that undergoes uncontrolled land cover and land use development. Lake Tondano, which has an area of 46.87 km2, is a natural resource that periodically attracts government attention since it has experienced degradation in the form of a decrease in capacity and water quality. This water resource is utilized for hydropower plants installed in series (cascade) and serves electricity needs for 2 provinces (North Sulawesi and Gorontalo), raw water for drinking water and irrigation, freshwater fisheries, and tourism. It is reported that in about 7 decades since 1936, Lake Tondano has silted up from a maximum water depth of 36 meters to 14 meters (siltation of 0.31 m/year) due to soil erosion and other causes, which has reduced the function of the lake [4, 5]. However, the correlation between the deposition thickness of lake bottom sediments and soil erosion is not discussed. The rapid process of land use change and land cover types in the lake catchment area in the form of deforestation, intensive agricultural practices, and urbanization in the highlands around Lake Tondano has a very important role in increasing the rate of land erosion and sediment formation process [6, 7, 8]. The study of the level of erosion hazard in the Lake Tondano catchment area, especially in the eastern part of the Lake Tondano sub-watershed, revealed that 20.28% of the land area is categorized at the level of severe to drastic erosion hazard [9, 10].
Further research conducted in 2014 reported an increase in the average erosion rate of 61.56% due to the distribution of land cover development for forests, shrubs, rice fields, residential areas, and water bodies [11]. The study on the level of erosion hazard of the Lake Tondano catchment area between 2008 and 2020 found that the Lake Tondano catchment area experienced land use change and had a significant impact on increasing the total erosion rate by 160% [6]. Examining the results of previous studies, it appears that changes in land use patterns and variations in land cover conditions are important driving forces for changes in stream runoff and sediment yields at all spatiotemporal scales that require immediate action to maintain the degradation of land and water resources in Lake Tondano. Several studies have been conducted in the Lake Tondano catchment area, but the impact of land use and land cover dynamics on the amount of sediment deposited in the lake and its influence on the siltation process has never been evaluated. The lack of primary data and adequate survey equipment has made it difficult to analyze the interdependencies between land use dynamics, sediment production, and siltation processes in the study area [12].
Moreover, during the last twelve years, various land conservation efforts in preserving its catchment area have been made by the Indonesian government; however, no further investigation of positive impact evaluation has been conducted. This study takes these conservation efforts into account and analyzes how they affect the rate of erosion, sedimentation, and siltation of Lake Tondano [13]. All the above reasons imply that a study of the impact of land use dynamics on sedimentation in Lake Tondano is necessary to ascertain alternative land conservation measures for optimal utilization of natural resources [14].
2. MATERIALS AND METHODS
Geographically, the Lake Tondano watershed is located between 10o20'25” and 01o45'04” North Latitude and between 124o6'06” and 124o58'20” East Longitude extending from South to North. The watershed area of 186.62 km2 is then divided into 123 sub-watersheds based on the tributaries that enter Tondano Lake. Around the study area, there are 10 rain gauge stations, but only 4 rain gauge stations affected the Tondano Lake watershed, namely the Malalayang-Kakaskasen rain gauge station, the Paleloan rain gauge station, the Noongan-Winebetan rain gauge station, and the Molompar-Rasi rain gauge station. The location is presented in Fig. (1).
This study uses maximum monthly rainfall data throughout 2008-2022 from the four rainfall stations above. Other secondary data in the form of land use maps along with soil type maps in the Tondano Lake watershed were obtained from the Tondano Watershed and Protected Forest Management Center (BPDASHL) Office. Both data characteristics of the Tondano Lake catchment, along with information on land slope in the study area, were processed and analyzed spatially using ArcMap 10.8 GIS and worksheet-based software.
The Universal Soil Loss Equation (USLE) model by Wischmeier and Smith was used to calculate surface erosion rates in this study because it is often used to assess the success of land conservation programs in Indonesia. In addition, this model shows similarities between theoretical calculations and factual observations in determining the amount of watershed soil loss; the USLE model is generally feasible in estimating the quantity of sediment entering reservoirs [5, 15]. The USLE model analyzes the average amount of soil loss (t/ha/year) based on the influence of several variables, namely rainfall erosivity, R, (KJ/ha), soil erodibility, K, (t/ha/R), topographic factor, LS (unitless), land cover index, C (unitless), and support particle index, P (unitless) as in Eq. (1).
 |
(1) |
The USLE is only based on the amount of soil moved on a field [16]. Therefore, analyzing the total actual sediment production entering the lake is requisite for this study using the Sediment Delivery Ratio (SDR) model. Furthermore, the actual total sediment production value obtained is used as the basis for determining the thickness of sediment deposited on the bottom of Lake Tondano after being correlated with the results of bathymetry measurements [9].
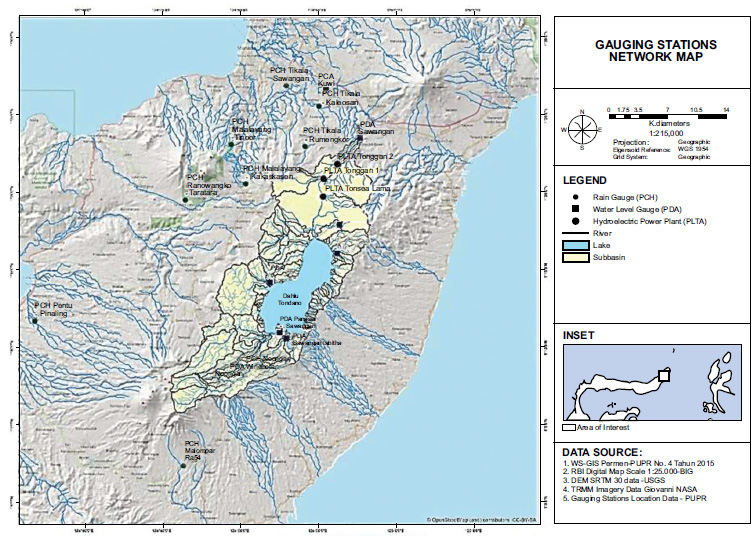
Hydrological observation stations in the Tondano lake area.
2.1. Rainfall Erosivity Index (R)
R is the potential for erosion caused by rainfall and runoff flow factors at a particular geographic location. R is influenced by the amount of monthly rainfall, Rain, expressed in (cm), the incidence of rainy days during the month, Days, (days), and the maximum daily rainfall that occurred, RMax, expressed in units of (cm), in the month under review. The calculation of the monthly rainfall erosivity index is shown in Eq. (2). Furthermore, the analysis of annual average erosivity is by summing Rm for 12 months.
 |
(2) |
2.2. Soil Erodibility Factor (K)
Soil erodibility indicates the sensitivity of soil particles to segregation and discharge by stormwater and water flow [14]. Therefore, the determination of the K factor, which is strongly affected by soil texture, is propriety. The Tondano Lake catchment consists of various soil types and their distribution (Fig. 2), and each soil type has its own K factor, as shown in Table 1.
2.3. The Slope Length Gradient (LS) Factor
The slope length gradient (LS) factor expresses the effect of topography, i.e., combining the effects of slope length (L) and slope steepness (S) on the rate of soil erosion.
The slope length factor (L) depends on the value of the slope length, Lo (metric units), as shown in Eq. (3). If the site consists of different soil types, the Lo value for each soil type is determined after overlaying the soil type map and the slope map as follows,
 |
(3) |
The slope steepness factor (S) is calculated based on the actual slope (s) using Eq. (4).
 |
(4) |
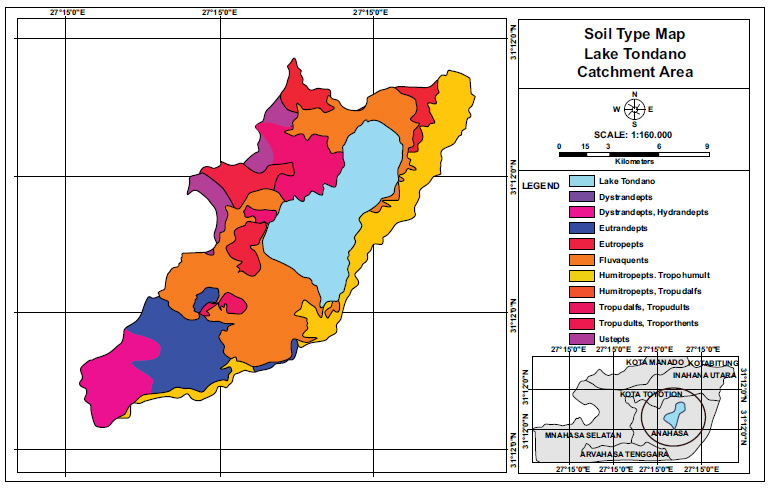
Soil-type map of Tondano lake’s Water.
Source: The Tondano Watershed and Protected Forest Management Center (BPDASHL).
| Ordo | Great-group | K -Factor | Sources |
|---|---|---|---|
| Inceptisol | Dystrandepts Hydrandepts Humitropepts Ustepts Udepts |
0.31 0.32 0.22 0.23 0.23 |
Arsyad et al. [17] Isma et al. [18] Dangler and El-Swaify in Silalahi et al. [19] |
| Eutropepts | 0.16 | Chay Asdak [20]. | |
| Eutrandepts | 0.22 | Chapter 7 Soil Erosion: 100-114 [21] | |
| Dystropepts | 0.23 | Chay Asdak in Rantung M [22]. | |
| Tropaquepts | 0.20 | Chapter 7 Soil Erosion: 100-114 [21] | |
| Entisol | Fluvaquents | 0.178 | Osok et al. [23] |
| Afisol/Inceptol (Mediteran) | Tropohumult | 0.10 | Undang K. and Suwardjo in Brigita Raco et al. [24] |
| Afisol/Inceptol (Mediteran) | Tropudalfs | 0.23 | Chapter 7 Soil Erosion: 100-114 [21] |
| Ultisol (Podsolik) | Tropudults | 0.16 | Chay Asdak in Rantung M [22]. |
| Entisol/Inceptisol (Regosol) | Troporthents | 0.14 | Undang K. and Suwardjo in Brigita Raco et al. [24] |
LS values were determined using spatial analysis of Geographic Information System (GIS) data management. The LS factor was obtained using vector values of slope (in degrees) derived using digital elevation model (DEM) data with the help of ArcMap software. For the simplification of the assessment, the LS factor was determined by the Ministry of Forestry of the Republic of Indonesia, and it is based on the slope class [20]. It is presented in Table 2.
The slope map of Lake Tondano catchment area (Fig. 3) is the result of data processing from the Digital Elevation Model (DEM) map downloaded from the Geospatial Information Agency (BIG).
| Slope Classes | Slope (%) | LS-value |
|---|---|---|
| I | 0-8 | 0.4 |
| II | 8-15 | 1.4 |
| III | 15-25 | 3.1 |
| IV | 25-40 | 6.8 |
| V | > 40 | 9.5 |
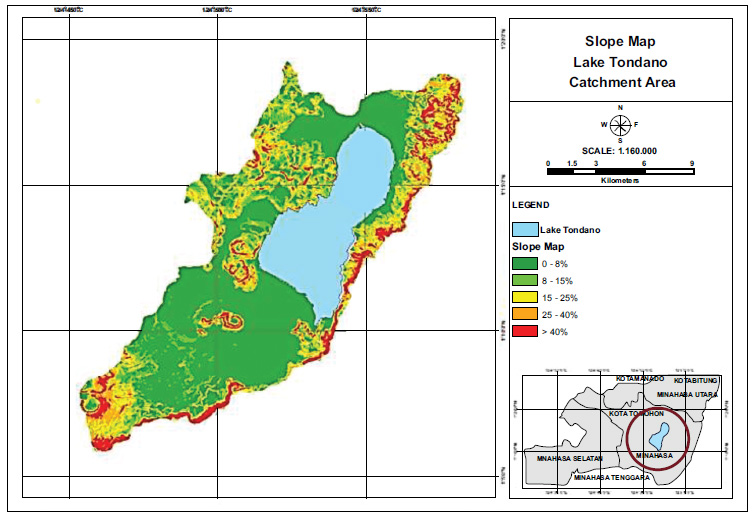
Slope map of Tondano lake’s watershed.
Source: Result Analysis.
| Conservation Method | P-Factor |
|---|---|
| Bench terrace according to type of construction | 0.04-0.4 |
| Strip crops | 0.40 |
| Soil management and planting based on the land slope 0-8% |
0.50 |
| 8-20% | 0.75 |
| >20% | 0.90 |
| No soil conservation | 1.00 |
2.4. Crop Management Factor (C) and Support Practice Factor (P)
Factor C incorporates soil loss due to the choice of vegetation type and specific land management system treatments. Furthermore, the P factor represents the effect of various land conservation measures on soil loss. In this study, the C factor is determined based on the land cover types, as summarized in Table 3.
Land management and conservation activities in the Lake Tondano catchment land cover types vary widely. The determination of the land management factor (P) is highly dependent on the form of human activities [25], as shown in Table 4. The value of P varies from 0.04 to 1, depending on the conservation techniques carried out, and the value of P = 1 indicates that no conservation measures have been taken on the land. The selection of the P factor in the study is based on direct observation in all locations by taking into account the conservation efforts by the government [26].
2.5. Estimation OF Sedimentation Rates Using Sediment Delivery Ratio (SDR)
Analysis of sedimentation rates in the watershed can be done without direct sediment sampling in the field. The sediment Delivery Ratio (SDR) method was chosen for this study because it focuses more on the source of sediment from the watershed, the distance of the source to the reservoir/lake, the eroded soil particles, and the transport system along with the characteristics of the watershed [20]. There are several ways to determine the value of SDR, and this study used the determination of SDR values as a function of watershed size [28]. Furthermore, the analysis of the amount of potential sediment (Spot) that occurs is the actual erosion value (Eact) multiplied by the SDR value.
2.6. Bathymetric Survey
Bathymetric surveys were conducted to obtain the overall cross-sectional shape as well as the capacity curve of Lake Tondano. This curve will be used to analyze changes in the thickness of deposited sediments, the main cause of lake siltation. Some tools, such as Hemisphere VS330 for navigation and Teledyne ODOM ECHOTRAC CV100 of single beam echosounder, are applied in surveys by collecting water depth data at some designated points or lanes. The water depth measurement was done by echo sounding and terrestrial topographic measurement to partially connect the cross-section of the lake from echo sounding to the maximum elevation of lake inundation.
Theodolite and communication equipment are operated to control the perpendicular position between the bow of the dredged and lakeshore waterline. The total tracer path in this study was 860 km, with an average interval distance of 50 meters and a tracer speed of less than 5 knots.
3. RESULTS AND DISCUSSION
3.1. Land Cover Alteration in the Catchment Area of Tondano Lake
Land cover conditions in the Tondano Lake catchment are divided into various types, namely primary dryland forest, secondary dryland forest, shrubs, dryland agriculture, mixed dryland agriculture, rice fields, settlements, open land, and water bodies (Fig. 4). Based on data from BPHDSL Tondano, the distribution of land cover between 2020 - 2022 has experienced dynamic changes in the land cover area as listed in Table 5. The largest addition of land cover area to the total land is dryland agriculture and mixed dryland agriculture, amounting to 37.71% and 17.57%, respectively. In contrast, by the end of 2022, the decrease in land cover area occurred in paddy fields by 30.58% and settlements by 6.6% from the previous land area. The phenomenon of reducing the area of rice fields and settlements occurred due to a decrease in the capacity of the lake, and its overflowing water inundated the land located on the shore of the lake. The area of dry land for agriculture taking over open land is one effort of conservation by the government.
3.2. Rainfall Analysis
The Thiessen polygon method determines the area of influence of each rainfall station based on polygon lines between all existing rainfall stations. Thiessen Polygon analysis of the Tondano Lake watershed using four rainfall stations can be seen in Fig. (5). The four rainfall stations that directly affect the Tondano Lake watershed and their areas of influence are the Malalayang-Kakaskasen rain gauge station (261.36 Ha; 1%), the Paleloan rain gauge station (7,988.96 Ha; 43%), the Noongan-Winebetan rain gauge station (9882.33 Ha; 53%), and the Molompar-Rasi rain gauge station (529.35 Ha; 3%). Each rain gauge station has recorded different rainfall data, so it is necessary to analyze regional rainfall values that represent rainfall events throughout the Lake Tondano catchment. Maximum monthly rainfall data representing the four rain gauge stations varied between 12.87 cm and 37.99 cm.
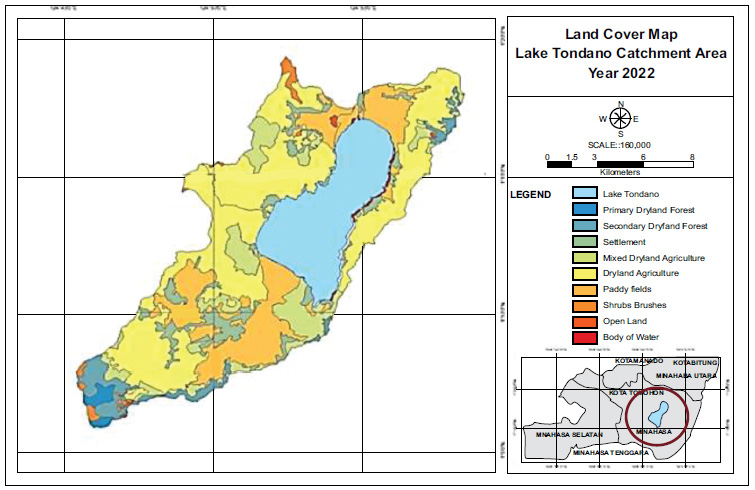
Land use map of tondano lake’s watershed.
Source: The tondano watershed and protected forest management center (BPDASHL) office.
| Types of Land Use in Tondano Lake’s Watershed | Area | Changes in Total Land Area | ||||
|---|---|---|---|---|---|---|
| Year 2021 (Ha) |
Percent (%) | Year 2022 (Ha) |
Percent (%) | Ha | % | |
| Primary Dryland Forest | 253.08 | 1.36 | 252.89 | 1.36 | -0.2 | 0.01 |
| Secondary Dryland Forest | 428.96 | 2.30 | 625.36 | 3.35 | +196.4 | 6.28 |
| Shrub | 246.09 | 1.32 | 354.34 | 1.90 | +108.2 | 3.46 |
| Settlement | 1,708.65 | 9.16 | 1,232.45 | 6.60 | -476.2 | 15.23 |
| Open Land | 127.32 | 0.68 | 54.48 | 0.29 | -164.1 | 5.25 |
| Water | 120.48 | 0.65 | 120.60 | 0.65 | +0.1 | 0.00 |
| Dryland Agriculture | 6,499.93 | 34.83 | 7,036.64 | 37.71 | +536.7 | 17.17 |
| Mixed Dryland Agriculture | 2,602.91 | 13.95 | 3,279.20 | 17.57 | +676.3 | 21.63 |
| Paddy Fields | 6,674.73 | 35.77 | 5,706.19 | 30.58 | -968.5 | 30.98 |
| Total | 18,662.15 | 100 | 18,662.15 | 100 | 14,954.203 | 100 |
3.3. Rainfall Erosivity Index (R)
The erosivity values were analyzed with the Bols equation using the magnitude of the annual rainfall values of the region [29]. For the 2021 and 2022 events (Table 6), annual rainfall of 3,024.49 mm/year and 2,874.21 mm/year, respectively, resulted in erosivity values of 3,100.44 MJ.cm/ha.jm/yr and 2,663.14 MJ.cm/ha.jm/yr. Fig. (6) presents the relationship between annual rainfall amount and erosivity index for the period 2008-2022. This figure presents the annual rainfall of the region as well, showing a high correlation between annual rainfall and erosivity value and yet illustrating more soil particle segregation and discharge by the flow as a result of the higher kinetic energy of stormwater.
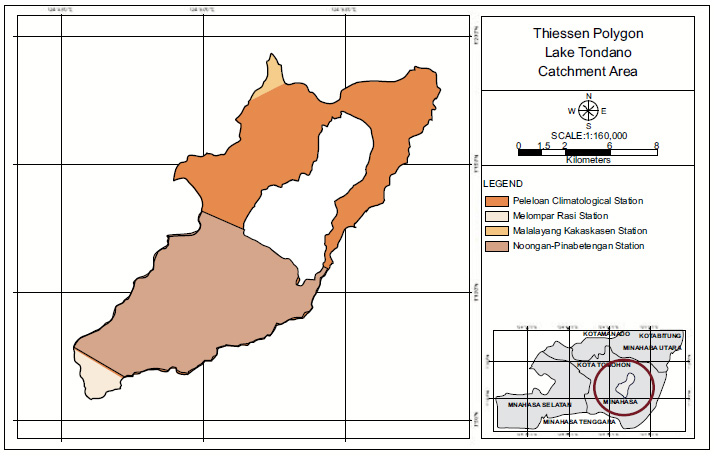
Area of influence of the rain gauge stations.
Source: Result Analysis.
| Year | MNTH | Rain | Days | MAXP | Rm | R Total |
|---|---|---|---|---|---|---|
| [cm] | [days] | [cm] | ||||
| 2021 | Jan | 18.512 | 18 | 4.35 | 103.20 | 3,100.44 |
| Feb | 23.960 | 15 | 4903.45 | 333.19 | - | |
| Mar | 32.090 | 19 | 2653.44 | 366.76 | - | |
| Apr | 20.319 | 14 | 4207.88 | 302.10 | - | |
| May | 27.374 | 15 | 5700.62 | 449.71 | - | |
| Jun | 24.849 | 14 | 2316.30 | 278.32 | - | |
| Jul | 26.310 | 15 | 4277.82 | 282.29 | - | |
| Aug | 13.378 | 10 | 381.47 | 127.08 | - | |
| Sep | 37.986 | 18 | 2103.65 | 382.23 | - | |
| Oct | 24.264 | 11 | 2947.67 | 91.37 | - | |
| Nov | 24.329 | 17 | 2657.47 | 167.43 | - | |
| Dec | 29.079 | 19 | 2738.49 | 216.76 | - | |
| - | 302.449 | - | - | - | - | |
| 2022 | Jan | 22.245 | 17 | 3467.62 | 262.83 | 2,663.14 |
| Feb | 16.695 | 17 | 4952.35 | 161.04 | - | |
| Mar | 25.634 | 19 | 2005.20 | 225.63 | - | |
| Apr | 33.188 | 18 | 2440.49 | 311.11 | - | |
| May | 22.284 | 15 | 2836.29 | 243.98 | - | |
| Jun | 16.214 | 12 | 2199.58 | 126.81 | - | |
| Jul | 14.827 | 14 | 1781.32 | 110.95 | - | |
| Aug | 18.524 | 17 | 1947.21 | 145.97 | - | |
| Sep | 12.870 | 14 | 2967.32 | 117.74 | - | |
| Oct | 33.319 | 15 | 1726.85 | 303.99 | - | |
| Nov | 36.970 | 21 | 2625.56 | 334.51 | - | |
| Dec | 34.650 | 16 | 14.34 | 318.60 | - | |
| - | 287.421 | - | - | - | - |
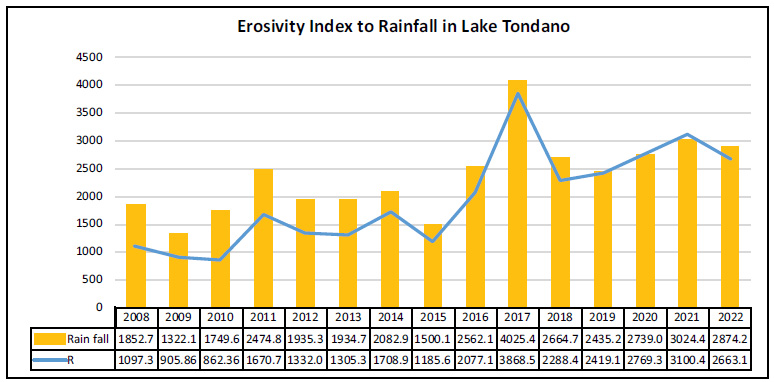
Erosivity index to rainfall in lake Tondano.
Source: Result Analysis.
| Soil Type | Area, A (Ha) | Erodibility (K) | The Slope Length Gradient (LS) Factor | ||||||
|---|---|---|---|---|---|---|---|---|---|
| K Factor | A × K | S Value (%) | Slope Length | L Value | LS Value | LS × A | |||
| (m) | (m) | - | |||||||
| Dystrandepts, | Humitropepts | 1,646.370 | 0.28 | 460.98 | 11.186 | 150.5 | 2.62 | 0.878 | 1,444.72 |
| Humitropepts, | Dystropepts | 397.125 | 0.18 | 71.48 | 11.186 | 150.5 | 2.62 | 0.878 | 348.48 |
| Humitropepts, | Dystropepts | 3,105.405 | 0.18 | 558.97 | 11.186 | 150.5 | 2.62 | 0.878 | 2,725.05 |
| Tropudults, | Dystropepts | 254.773 | 0.18 | 45.86 | 11.186 | 150.5 | 2.62 | 0.878 | 223.57 |
| Tropudults, | Dystropepts | 124.666 | 0.18 | 22.44 | 11.186 | 150.5 | 2.62 | 0.878 | 109.40 |
| Tropudults, | Dystropepts | 210.779 | 0.18 | 37.94 | 11.186 | 150.5 | 2.62 | 0.878 | 184.96 |
| Ustepts | Udepts | 24.514 | 0.23 | 5.64 | 11.186 | 150.5 | 2.62 | 0.878 | 21.51 |
| Ustepts | Udepts | 406.845 | 0.23 | 93.57 | 11.186 | 150.5 | 2.62 | 0.878 | 357.01 |
| Ustepts | Udepts | 259.856 | 0.23 | 59.77 | 11.186 | 150.5 | 2.62 | 0.878 | 228.03 |
| Ustepts | Udepts | 339.033 | 0.23 | 77.98 | 11.186 | 150.5 | 2.62 | 0.878 | 297.51 |
| Fluvaquents | Tropaquepts | 4,896.056 | 0.19 | 930.25 | 0.439 | 50 | 1.51 | 0.166 | 813.31 |
| Eutropepts | - | 814.125 | 0.16 | 130.26 | 3.166 | 350.5 | 3.99 | 0.482 | 392.34 |
| Humitropepts, | Dystropepts | 68.441 | 0.23 | 15.74 | 1.496 | 500 | 4.77 | 0.386 | 26.45 |
| Eutropepts | Distrandepts | 434.581 | 0.24 | 104.30 | 7.374 | 350.5 | 3.99 | 0.799 | 347.29 |
| Dystrandepts, | Humitropepts | 31.003 | 0.28 | 8.68 | 11.186 | 150.5 | 2.62 | 0.878 | 27.21 |
| Fluvaquents | Tropaquepts | 1,041.288 | 0.19 | 197.84 | 0.439 | 50 | 1.51 | 0.166 | 172.97 |
| Eutropepts | Distrandepts | 471.638 | 0.24 | 113.19 | 6.166 | 350.5 | 3.99 | 0.708 | 334.15 |
| Eutrandepts | Eutropepts | 127.832 | 0.19 | 24.29 | 1.496 | 350.5 | 3.99 | 0.354 | 45.20 |
| Tropudalfs, | Dystropepts | 162.386 | 0.21 | 34.10 | 3.166 | 150.5 | 2.62 | 0.390 | 63.35 |
| Tropudalfs, | Dystropepts | 1,465.711 | 0.21 | 307.80 | 3.166 | 150.5 | 2.62 | 0.390 | 571.78 |
| Eutrandepts | Eutropepts | 1,692.008 | 0.19 | 321.48 | 1.496 | 350.5 | 3.99 | 0.354 | 598.28 |
| Eutropepts | - | 466.729 | 0.16 | 74.68 | 3.166 | 350.5 | 3.99 | 0.482 | 224.92 |
| Dystrandepts | Eutropepts | 78.986 | 0.24 | 18.96 | 6.166 | 75 | 1.85 | 0.482 | 38.06 |
| Total | - | 18,520.151 | - | 3,716.209 | - | - | - | 14.812 | 9,595.58 |
| Average | - | - | K = 0.201 | - | - | - | LS = 0.518 | ||
3.4. Soil Erodibility Factor (K)
Table 1 shows the soil erodibility value (K) of each soil type in the Lake Tondano catchment, which varies between 0.10 - 0.32. The grouping of soil types is based on the similarity of the nature of the forming material, geographical location, and distribution according to a certain pattern. Furthermore, the value of soil erodibility throughout the Tondano Lake catchment area is obtained from the average of each soil type erodibility value with the influence of each area. From the results of the analysis, the value of soil erosivity (K) of the entire Tondano Lake catchment is 0.201, as shown in Table 7.
3.5. The Slope Length Gradient (LS) Factor
In addition to the soil type itself, the length and slope where each soil type is located also affect the erosion rate in an area. Large slopes result in land erosion due to increased surface flow rates. Table 2 presents the classification of slope classes with the percentage of land slope and LS value. Based on this grouping, the Lake Tondano catchment has 36.55% of the area with slopes greater than 40%, and the remaining 63.4% is divided into several groups of slope percentages. The length and slope factor (LS) of the Tondano Lake catchment is the calculated average of soil types with their respective areas and LS = 0.518 (Table 7).
3.6. Crop Management Factor (C) and Support Practice Factor (P)
The values of C and P are coefficients that represent the choice of plant species and the treatment of certain land management systems in the Lake Tondano catchment. In this study, the value of C is the average value of 9 types of land cover (Table 3) with the effect of the area of each type of land cover (Table 5). The C values for 2021 and 2022 were 0.211 and 0.199, respectively. The value of P is determined based on the condition that conservation has been carried out in the Lake Tondano catchment, ranging between 0.50-0.90 according to Table 4. Conservation is carried out with a land cover management approach based on the distribution of the dominant slope in the Tondano Lake catchment. Replanting on open land and land with steep slopes can prevent rainwater from falling directly on the ground surface, thereby reducing soil degradation due to rainwater and runoff.
3.7. Determination of Erosion Rate and Sediment Potential
The erosion rate in the Lake Tondano catchment was analyzed using the USLE model as Eq. (1) for each type of land cover. The erosion rate obtained in 2021 was 51.09 tons/ha/year, and in 2022 was 41.281 tons/ha/year, as shown in Table 8. The value of the erosion rate in the last 2 years shows a decrease compared to the results of the previous study, where the erosion rate was obtained as 95.66 tons/ha/year. A moderate erosion hazard level was with an erosion rate of 60-180 tons/ha/year [10].
Government land conservation efforts continue to be carried out to reduce erosion rates in the Tondano Lake catchment area. From this study, it was found that in 2021 and 2022, the level of erosion hazard was mostly in a mild condition with erosion rates between 15-60 tons/ha/year, based on the Guidelines for the Preparation of Watershed Land and Forest Rehabilitation Technical Plans (RtkRHLDAS). Furthermore, the map of the erosion hazard level of the entire Lake Tondano catchment area in 2022 can be seen in Fig. (7).
In addition to the analysis of erosion rate determination, potential erosion (Epot) can be analyzed based on the influence of rainfall erosivity factor (R), soil erodibility (K), Slope length gradient factor (LS), and land area. The calculation of the actual erosion value is based on the E potential value, including the influence of the management of crops and some factors of soil conservation. Furthermore, the analysis of the amount of potential sediment (Spot) entering the lake is a function of Eakt and the Sediment Delivery Ratio (SDR) value.
SDR is defined as the ratio of sediment delivery to actual erosion in a watershed. The specifics of SDR include the source of sediment coming from the watershed, the distance of the source to the lake, the soil particles eroded, the transport system, and the characteristics of the watershed. The determination of the SDR value is a function of watershed size [28] and is generally less than 1 because there can be deposition on the land surface and in the stream system.
The catchment area of Lake Tondano is 18,662.15 Ha, and from the table of the relationship between watershed area and sediment delivery ratio [28], for the catchment area between 10,000-20,000 Ha, the SDR value is 0.11. Thus, the amount of actual sediment (Eact) for 2021 and 2022 was 140,897.55 tons/year (53,168.89 m3/year) and 113,846.61 tons/year (42,960.99 m3/year), respectively.
Table 8.
| Year | R | K | LS | C | P | USLE | Epot | Eact | Classes | ||
|---|---|---|---|---|---|---|---|---|---|---|---|
| Erosion (A) (ton/ha/yr) | (ton/yr) | (ton/ha/yr) | (ton/yr) | (ton/ha/yr) | Erosion | ||||||
| 2021 | 3,100.437 | 0.20 | 0.518 | 0.211 | 0.75 | 51.090 | 8,081,274.94 | 322.333 | 1,280,886.78 | 51.090 | II |
| 2022 | 2,663.142 | 0.20 | 0.518 | 0.199 | 0.75 | 41.281 | 6,941,468.37 | 276.871 | 1,034,969.18 | 41.281 | II |
| Total | 5,763.580 | - | - | - | - | 92.371 | 15,022,743.30 | - | 2,315,855.960 | - | - |
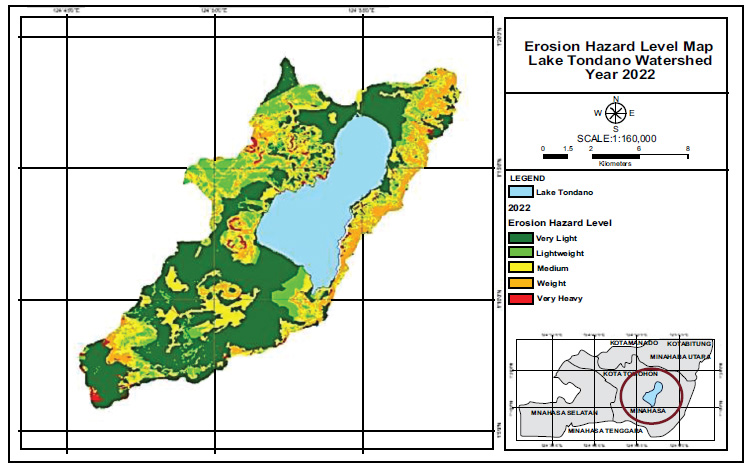
Erosion hazard level map in the Tondano lake watershed.
Source: Result Analysis.
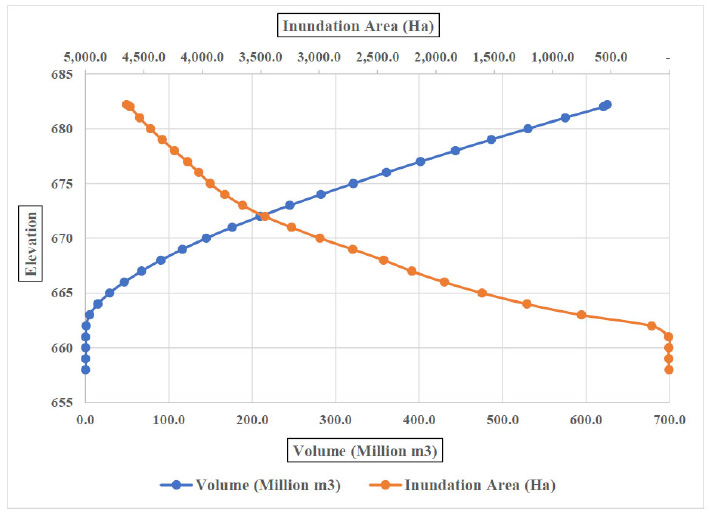
Tondano lake capacity curve.
Source: Result Analysis.
In this study, bathymetric measurements of Lake Tondano were carried out in an area covering all the space available to hold water, both in submerged conditions and above the water level. The capacity curve of the lake is an expression of the cross-sectional shape of the lake, which is obtained by bathymetric measurements. This curve illustrates the relationship between each increase in lake body elevation to the water surface area and storage volume of Lake Tondano, as shown in Fig. (8). From this curve, the elevation of the lake bed can also be analyzed due to the volume of sediment that will settle in the lake (Potential sediment; Spot).
Based on Fig. (8), the bottom elevation of Lake Tondano is at +662 meters. The potential sediment generated during the analysis year period (2020 - 2022) is 55,191.13 m3/year (2021) and 43,977.24 m3/year (2022). All the sediments produced enter the lake and influence the increase in the thickness of the sediment deposited at the bottom of the lake. This condition can result in the process of shallowing and reduce the capacity of the lake. Using the FORECAST.LINEAR function in Excel, this total potential sediment of 99,168.37 m3/year has the potential to increase the bottom elevation of Lake Tondano (siltation) by 0.024 meters within 2 years or 0.021 m./year. This result shows a great decrease from the previous study, which reported a shallowing of 0.31 m/year.
CONCLUSION
The increase in the erosion rate caused by changes in land cover in the Lake Tondano catchment area needs to be controlled so as not to worsen the sedimentation. Control of erosion can be carried out through land conservation at the catchment area, which is a determinant of the sedimentation rate process in Lake Tondano. Further, an alternative scenario for land management or conservation, namely in the form of land cover utilization management planning with soil management and planting over the entire catchment area with a slope of 8-20%, has reduced the amount of erosion and sedimentation by 58.18%.
The class II erosion hazard level has 15 to 60 tons/ha/year of erosion with an average of 46.19 tons/ha/year, which defines the erosion class in the catchment area. However, from the Erosion Hazard Level Map, it appears that areas in the Tondano Lake catchment area with slopes of 25-40% and >40% are still at very high erosion hazard levels. Therefore, land cover management and land conservation efforts are very necessary for these areas.
The thickness of sediment deposited at the bottom of Lake Tondano can be determined from the total value of actual sediment production analyzed from the USLE and SDR models after being correlated with the results of bathymetry measurements.
AUTHORS’ CONTRIBUTIONS
It is hereby acknowledged that all authors have accepted responsibility for the manuscript's content and consented to its submission. They have meticulously reviewed all results and unanimously approved the final version of the manuscript.
LIST OF ABBREVIATIONS
| USLE | = Universal Soil Loss Equation |
| LS | = Length Gradient |
| GIS | = Geographic Information System |
| DEM | = Digital Elevation Model |

