All published articles of this journal are available on ScienceDirect.
Dynamic Analysis of Construction and Safety for a Giant Column Frame-core Tube-extension Arm Truss Structure System
Abstract
Introduction
Considering the influence of the shrinkage and creep of high-strength concrete on the vertical deformation and stress of structures, the mechanical behaviour during the construction of the giant column frame-core tube-extension arm truss structure system was simulated by using finite element analysis software.
Methods
For the engineering example of the Wuhan Center, and the safety of the construction channel under a moving load was analysed numerically. The results indicated that that there was a difference in deformation between the elevation position and design position of floor; the maximum deformation difference occurred in the middle of the tower.
Results
Under moving loads, the displacement and stress of the channel were 0.5 times that under full load.
Conclusion
As the load moved, the maximum displacement and stress of steel beam and plate changed, while the displacement and stress of the supports and the placed beam and plate remained unchanged and maintained the minimum value.
1. INTRODUCTION
The giant column frame-core tube-extension arm truss structure system refers to a composite structural system resistant to multiple lateral forces and composed of giant columns, frames (usually steel), concrete core tubes, and extended arm trusses. The giant column frame-core tube -extended arm truss structure system, a new type of structural system, is increasingly applied in practice. It provides a good source of lateral force for the construction of super high-rise buildings, effectively utilizes the mechanical properties of materials, and achieves good economic benefits. However, the current engineering design is based on the structural analysis and bearing capacity design of the complete structure, which is reliable and effective for general buildings. The application of the giant column frame-core tube-extension arm truss structure system to super high-rise buildings involves a long construction period, variable loads, and different processes [1]. The geometric shape and physical properties of the structure gradually change. It is not scientific to simply apply past experience and methods to a different case. Therefore, mechanical simulation and stress behaviour analysis of the construction process of this structural system are effective means to ensure the safety and rationality of the structure during and after construction and are among the main problems that should be solved in the field of civil engineering mechanics research [2, 3].
At present, the research hotspots related to this structural system at home and abroad mainly focus on mechanical calculation models and analysis methods for the system [4], wind and seismic design [5, 6], and carbon sink energy consumption [7, 8], with relatively little research on the construction process. Weigert et al. [9] defined a set of system boundaries based on European standards by defining the fuel consumption process and calculated carbon emissions during the construction process at four sites in Austria. Lim et al. [10] explored the factors that affect the construction period and established a construction period estimation model. The research avoided the inevitable acceleration of construction during the construction process, thus minimizing the occurrence of construction accidents to the greatest extent possible. Eldeep et al. [11] studied the beneficial role of Building Information Modeling (BIM) in the construction process through a case study, which could reduce the total contract price by 11% and the total construction time by 25%. Taeyong [12] proposed a new construction process modelling method that improved the traceability of ICT (Information And Communication Technology) applications in construction management and validated the effective- ness of IAMB (ICT Application Tracking Model for Business Process). Rinke et al. [13] proposed hierarchical and modular modelling of the construction process using Petri nets, which provided a foundation for the real-time quality assessment of construction sites but was relatively complex. Zhou et al. [14] took the U-shaped concrete single box double hole concrete box girder continuous bridge of Shanghai Metro Line 10 as an example, proposed a new method to construct a non-cantilever precast assembly continuous bridge, and conducted a simulation of the construction process. Jiang et al. [15] analysed the mechanical performance of the bilateral displacement support system during excavation and demolition during tunnel construction through numerical simulation and monitoring, providing a reference for the design and construction of tunnels with large cross sections. Wang et al. [16] considered the effects of structural self-weight, construction load, and concrete shrinkage and creep during the construction process and conducted a simulation analysis of the entire construction process of the twin towers in the Yinchuan Green Space Center. They studied the vertical deformation and difference in vertical deformation of the outer frame tube and core tube. He et al. [17] established a finite element analysis model for the construction stage of large and complex-shaped arched shell concrete structures by combining the construction plan and process, which effectively simulated the stress state of the structures during the construction stage. Lin et al. [18] considered the time-varying characteristics of structures and materials during the construction process and conducted a comprehensive analysis of structural deformation during the construction of the Lize SOHO. Finally, the deformation behaviours of complex super high-rise structures during the construction stage were analysed and summarized.
Zhou Xuhong [19] performed calculations with the finite element method and suggested that the vertical deformation difference of members must be considered for steel frame reinforced concrete core tube structures above 150 m. China's “Code for Design of Seismic Structures” [20] clearly stipulates that when the reinforced concrete cylinder is constructed before the steel frame, unfavourable stress states under wind and other loads during the construction phase should be considered. Steel reinforced concrete components should be checked for the bearing capacity, stability, and displacement of the steel frame under construction loads and possible wind loads before pouring concrete, and the number of floors between the installation of the steel frame and the pouring of concrete should be determined on this basis.
Given the complexity of the construction site and the unique nature of the construction environment, the construction process remains a weak link, and further research is needed. The construction channel that bears moving loads is another key consideration in the construction process. There are also many construction safety accidents caused by the collapse of the construction channel, but related research is still lacking. Therefore, taking the Wuhan Center as an example, this paper conducts a dynamic simulation analysis of the construction process and construction channel of its giant column frame-core tube-extension arm truss structure system. The results provide a basis for the adjustment of construction measures for similar projects in the future.
2. METHOD
2.1. Construction Process Simulation Method and Finite Element Model
2.1.1. Project Overview
The Wuhan Center project is located in the first office building, hotel, commerce, conference and other functions in the Wangjiadun Central Business District (Wuhan CBD) in Wuhan. There are plans to build a 438 metre tall high-rise multi-functional business complex. The Wuhan Center consists of 88 floors of tower, 4 floors of atrium, and 3 or 4 floors of basement. The aboveground part is approximately 260000 square metres. The tower has four underground floors and 88 aboveground floors, with a total height of 438 metres.
The lateral force resisting system of the Wuhan Center tower is a multiple force bearing system consisting of a mega column frame core tube outrigger truss. The system consists of three parts: the first part is a reinforced concrete core tube with built-in steel plates in some floors. The second part, the frame formed by steel tube concrete columns and steel beams, is reinforced with six ring truss structures. The third part is a three arm truss that connects the giant columns and the core tube. The core tube is the main lateral force resistance system; the giant column frame and extended arm truss are secondary lateral force resistant systems. The extended arm truss connects the giant column frame with the core tube, enhancing the overall lateral resistance of the outer frame.
2.1.2. Construction Process Calculation and Analysis
The main steps of construction process simulation analysis include establishing an analysis model, dividing construction sections according to the construction plan, and numbering the construction sections; defining unit information and constraint information for each construction section; defining the load information for each construction section; adjusting the complete model, defining the construction phase time, load groups, structural groups, and boundary groups for calculation; completely organizing the displacement, internal force, stress and other information during each construction period; and drawing conclusions.

The model of the integrated computation.
2.1.3. Construction Process Analysis
During program calculations, the actual construction process and the sequence of construction considerations are gradually tracked and analsysed to obtain the internal forces and deformations of the structure and components in each completed state to truly reflect the dynamic process of construction. According to the analysis process described above, a detailed analysis is conducted on the vertical deformation differences during the construction process based on different construction periods, advanced layers, and other construction factors. This article focuses on the study of vertical deformation differences during the construction process of super high rise buildings, which does not involve the issue of foundation settlement. The software fixes the structure with a rigid connection to the ground.
2.1.4. Establishment of a Three-dimensional Finite Soft Model
The overall calculation model of the three-dimensional finite element of the Wuhan Center is established according to the design drawings and construction scheme. With reference to the relevant literature [21, 22], the finite element software Midas Gen is used for simulation. The beam element is used to simulate the steel structure beam, and the column and wall element is used to simulate the core tube. The overall simulation model is shown in Figs. (1-3).
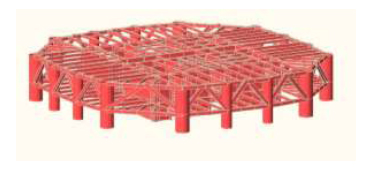
The model of the cantilever truss structural arrangement.
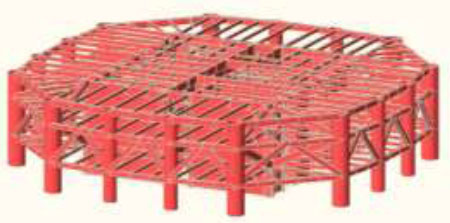
The model of the ring and cantilever truss structure.
3. INFLUENCE OF THE SHRINKAGE AND CREEP OF HIGH-STRENGTH CONCRETE ON STRUCTURES
3.1. Shrinkage and Creep Characteristics of High-strength Concrete
The main differences in shrinkage deformation between high-strength concrete and ordinary concrete are as follows: high-strength concrete has a smaller water-cement ratio, lower moisture content, and more intensified shrinkage, and shrinkage mainly occur in the early stage high-strength concrete contains a large amount of cement, has a small water-cement ratio, undergoes concentrated release of hydration heat and rapid temperature rise in the early curing stage of and large cold shrinkage is caused by dropping temperature in the later stage, but the final shrinkage is roughly the same as that of ordinary concrete [23, 24].
The analysis of creep in high-strength concrete shows that for the same stress ratio, the creep of high-strength concrete is less than that of ordinary concrete, while the total deformation of the two is similar [25]. This is due to the large stress that high-strength concrete bears, resulting in significant initial deformation. According to many studies at home and abroad [26-28], for the same water–cement ratio, the creep coefficient of concrete mixed with superplasticizer is the same as that of reference concrete, which has no adverse effect on creep.
3.2. Mathematical Expressions and Models for Concrete Shrinkage and Creep
Assuming that the age of concrete is t0, the size of the X is σ=X, the uniaxial stress is 1, and the amount of uniaxial deformation that occurs at age t day is J (t, t0), and the mathematical expression for X is (Eq 1):
 |
(1) |
where J(t, t 0) is the creep value under unit stress, called the flexibility coefficient, as shown in Figs. (4 and 5) below, which can be expressed as the sum of instantaneous elastic strain and creep during loading using the following formula (Eq 2).
 |
(2) |
In the above equation, E(t 0) represents the elastic modulus under the load action; C(t, t 0) represents the creep at age t and is called the degree of creep; and J(t, t 0) is expressed as the ratio of X to elastic deformation (Eq 3).
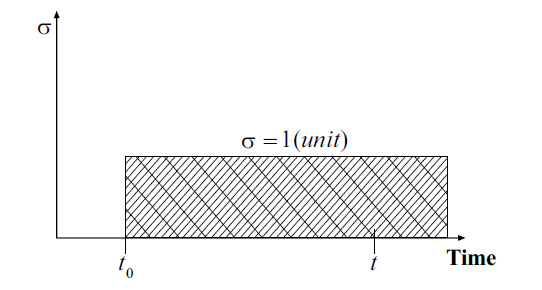
The stress variation with time diagram.
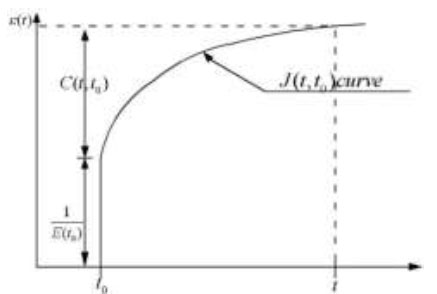
The strain variation with time diagram.
 |
(3) |
where ϕ(t, t 0) is the creep coefficient, which represents the ratio of elastic deformation to creep.
Based on the above two formulas, the relationship between the creep coefficient and creep degree can be obtained as follows (Eqs 4, 5):
 |
(4) |
 |
(5) |
Shrinkage is not related to the stress that occurs inside the component but rather is a function of time. The software program expresses the strain caused by shrinkage from time X to time t as (Eq 6):
 |
(6) |
where εs0 is the final shrinkage coefficient; f(t, t 0) is a time function, t is the observation time, and t0 is the start time of contraction.
The formulas for the creep coefficient or shrinkage strain in the program can use CEB-FIP or custom input experimental data.
4. RESULTS AND DISCUSSION
4.1. Simulation and Analysis of the Influence of the Construction Process on Vertical Structures
4.1.1. Empirical Estimation and Setting of Target Deformation Control Parameters
In the construction process, similar engineering practices can be used as a reference to estimate the number of layers leading to the core tube [13]. Table 1 lists the number of floors of the core tube leading to the outer steel frame during the construction of national super high-rise building structures. Generally, for super high-rise mixed structure buildings (over 40 floors), the core tube can lead the outer steel frame construction by 8-15 floors.
| Project | Number of Layers | Height(m) | Construction Layers of Core Tube Leading the Steel Frame |
|---|---|---|---|
| Jin Mao Tower | 88 | 420.5 | 15 |
| World Trade ISQUARE | 63 | 333 | 12~15 |
| Zhendan Building | 37 | 158 | 6~12 |
| Shanghai Bank Building | 43 | 230 | 6~10 |
When the interlayer displacement of the structure increases with an increasing number of layers, the influence of external horizontal loads gradually increases (wind load). When the bending deformation of the cantilever part is ignored, the interlayer corner reaches its maximum value at the intersection layer of the cantilever part and the complete part. Therefore, it is possible to verify whether the displacement value of this section exceeds the design value. According to the Technical Specification for Concrete Structures of High-rise Buildings, the ratio of maximum inter-story displacement to floor height is limited as follows:
(1) When the building height is less than 150 m, (∆u/h) ≤ 1/800;
(2) When the building height is 250 m or more, (∆u/h) ≤ 1/500;
(3) When the building height is in the range of 150~250 m, the limit is determined by the linear interpolation of building height between (1) and (2).
During the entire construction period, the number of leading layers of the core tube is not fixed. In actual engineering, factors such as construction speed, material supply, and weather conditions should be comprehensively considered to determine the leading plan for each construction stage.
4.2. Finite Element Algorithm, Load Overview, and Division of Construction Stages
4.2.1. Finite Element Method
According to the construction sequence, the structural components, support constraints, and load conditions are divided into 17 groups according to the construction steps, and the construction stages are defined according to the construction steps and duration. The program is analysed based on control data. When analsysing a construction step, the program freezes all the components in the later stage of the step and the load conditions that must be applied in the later stage. Only the components completed before the step are included in the calculation. The calculation process is analysed by considering the time-dependent effect (cumulative model) to obtain the internal force and deformation of the structure in each stage of completion. In the next stage, the program adjusts the model based on the new deformation, thus obtaining a realistic simulation of the dynamic process of construction.
4.2.2. Load Overview
In the total vertical gravity load of high-rise buildings, the structural self-weight accounts for over 80%, and the proportion of service load is very small. The calculation of loads mainly considers the structural self-weight, floor dead load, construction live load, and adhesion of the tower crane.
(1) The dead load on the floor is the self-weight of the floor, and the construction live load is 1.0 kN/m2.
(2) The effect of a tower crane on the structure includes both horizontal and vertical loads. The tower crane load is applied in the form of a uniformly distributed force to the core tube unit at the location connected to the core tube. The adhesion of the tower crane gradually considers changing the loading position during the analysis process according to the climbing conditions of the tower crane. The vertical load of the tower crane is calculated based on the total weight of 960 T. When the tower crane climbs, the original tower crane load is cancelled and applied to the new position of the tower crane load.
(3)The specific calculation of the load value on the steel platform can be applied to the main structure as a uniformly distributed load.
4.2.3. Division of Construction Stages
The core tube structure, giant steel frame column structure, and inner and outer floor structures of the core tube were organized for flow construction according to the principle of “unequal height synchronous climbing”. Structural analysis is mainly divided into the following stages:
(1) The core tube structure came first, and the giant steel columns and beams outside the core tube lagged behind the core tube.
(2) Below the steel structure operation layer were the concrete inside the giant columns, the composite floor profiled by steel plates, the floor reinforced concrete operation layer, and the reinforced concrete structure inside the core tube.
(3) The core tube shear wall structure was constructed layer by layer upwards according to the construction schedule of 4-5 days per structural layer.
(4) The peripheral giant steel frame columns were constructed synchronously at a rate of 5 days per structural layer and behind the core tube by 6 layers. The construction of composite floor profiled steel plates and floor reinforced concrete progressed at a rate of 5 days per floor and fell behind the lifting work surface of the outer steel frame structure by 6 floors. The reinforced concrete structure floor inside the core tube lagged behind the combined floor outside the core tube by 3-4 floors.
(5) There was a significant amount of lifting and welding work for steel structures on floors with extended arm truss structures, resulting in a slowdown in construction progress.
Based on the overall construction schedule and the main structure construction plan, we divided the entire construction process into 17 steps for construction simulation analysis. The specific division is shown in Table 2.
4.3. Analysis of Calculation Results
According to the requirements of relevant literature standards [29, 30], the bottom adopts a fixed end and the upper part is a free end. The load arrangement is shown in the previous section, and the material settings are specified in the requirements of the concrete structure design code.
The results of each construction stage are described in detail in graphical form, including the horizontal direction (DX, DY), vertical displacement value (DZ), and the most unfavourable combination of beam, column, and shear wall components, considering the results of elastic compression, shrinkage, and creep. Due to space limitations, representative calculation results (stage 1, stage 4, stage 8, stage 12, stage 16, stage 17) were selected in this article in the form of charts (displayed in order from left to right), as shown in Figs. (6-8):
| Stage | Construction Date | Construction Layer of Core Tube Structure | Construction Layer of Outer Frame Tube Steel Structure |
|---|---|---|---|
| Stage1 | 1th month - 4th month | 6F | 0F |
| Stage2 | 4th month - 9th month | 11F | 5F |
| Stage3 | 9th month - 11th month | 16F | 11F |
| Stage4 | 11th month - 12th month | 24F | 17F |
| Stage5 | 12th month - 13th month | 30F | 21F |
| Stage6 | 13th month - 14th month | 39F | 30F |
| Stage 7 | 14th month - 15th month | 45F | 32F |
| Stage 8 | 15th month - 16th month | 50F | 41F |
| Stage9 | 16th month - 20th month | 58F | 46F |
| Stage10 | 20th month - 21th month | 62F | 51F |
| Stage11 | 21th month - 22th month | 64F | 54F- |
| Stage12 | 22th month - 23th month | 71F | 62F |
| Stage13 | 23th month - 24th month | 76F | 65F |
| Stage14 | 24th month - 25th month | 80F | 68F |
| Stage15 | 25th month - 26th month | 85F | 75F |
| Stage16 | 26th month - 27th month | 86F | 86F |
| Stage17 | 27th month - 28th month | RF | RF |
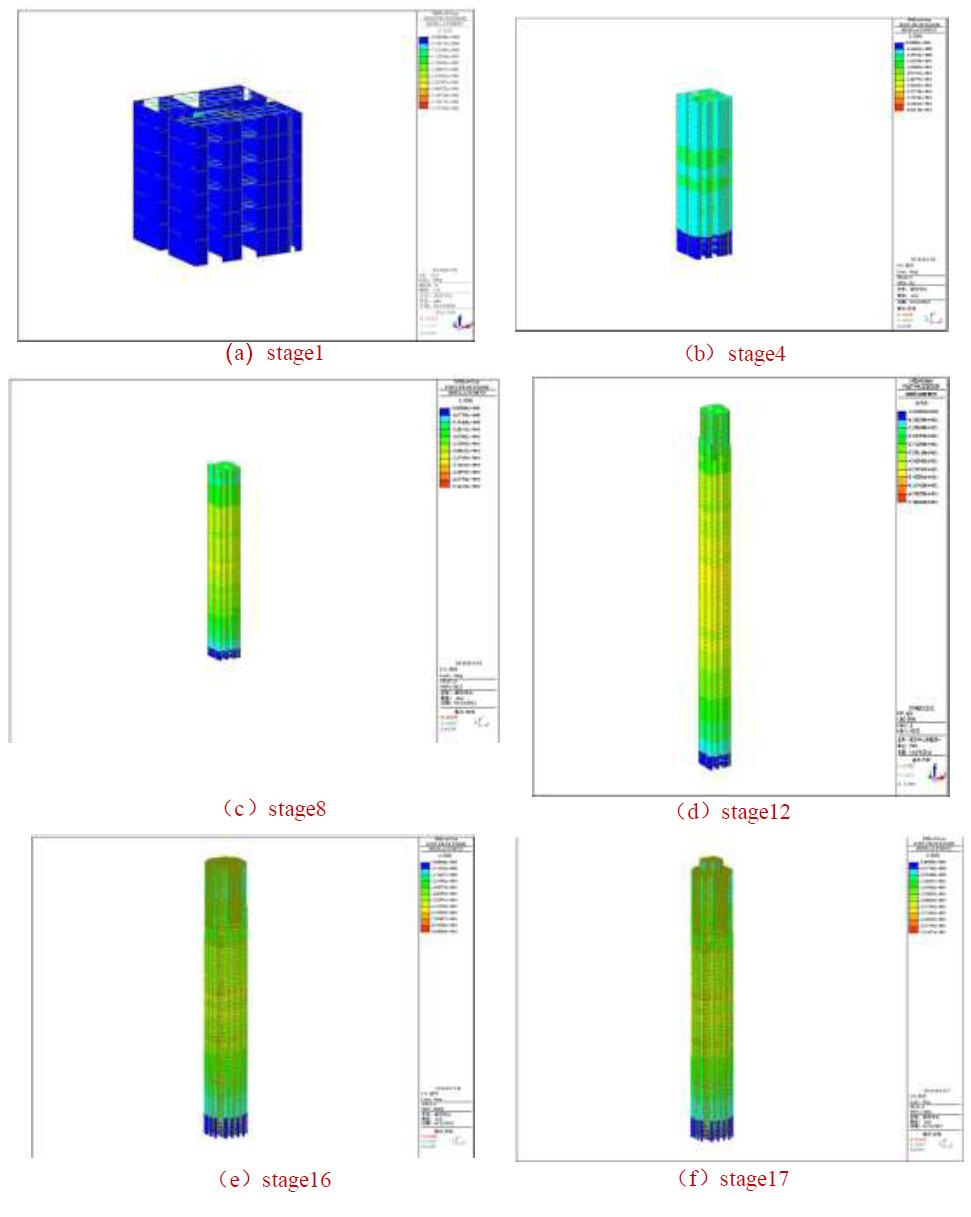
Typical construction stage of the structure vertical deformation distribution nephogram.
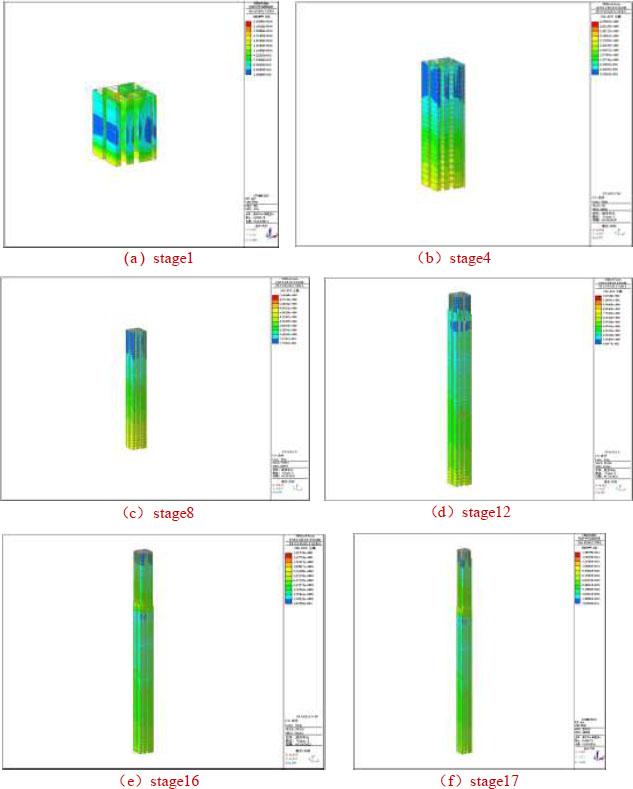
Typical construction stage of the core tube concrete structure stress distribution nephogram.
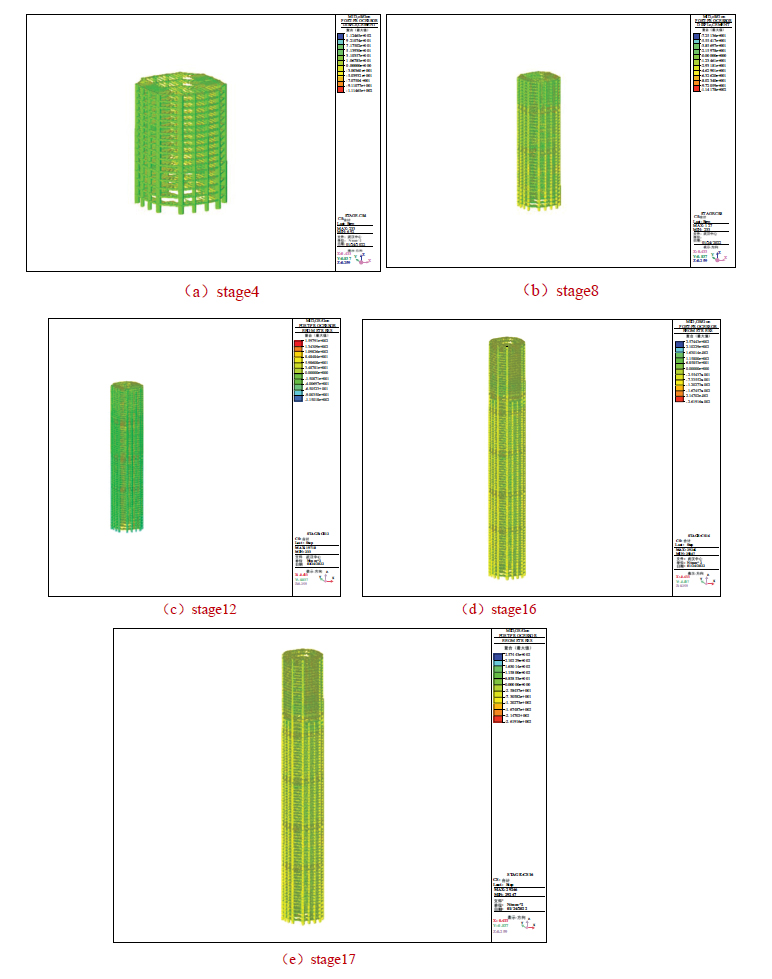
The outside steel framework of the stress distribution nephogram in the typical construction phase.
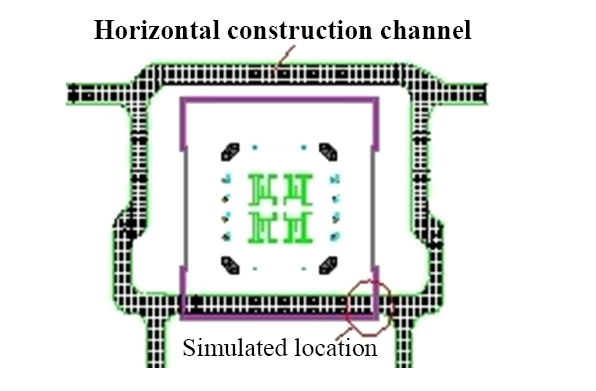
Schematic diagram of the horizontal construction channel.
4.3.1. Analysis of the Vertical Deformation Calculation Results
The calculation results show that there was a deformation difference between the elevation position of the floor and the design position under the action of gravity and construction loads during the construction process. The above figure shows that the six typical stages of vertical deformation were 10 mm, 45 mm, 51 mm, 74 mm, 88 mm, and 99.6 mm in sequence. The development and variation process of the vertical displacement of floors in each stage developed rapidly in the initial stage, and the amplitude of change decreased with time. The deformation value tended to stabilize, and the deformation characteristics of the external frame columns were similar to those of the core tube. In the initial stage, the overall vertical displacement of the core tube was larger than that of the external giant column structure, and the displacement between the core tube and the giant column decreased with increasing construction speed. The maximum vertical deformation occurred in the middle of the tower. However, with the occurrence of creep, the direction and stability of the overall vertical deformation of the structure were not significant, and the effect on the overall structure was not significant. During the construction stage, the vertical deformation difference should be adjusted through levelling.
4.3.2. Stress Calculation Results of the Core Tube Concrete Structure and Outer Steel Frame Structure
Figs. (8 and 9) show the cloud maps of the stress distributions of the core tube concrete structure and the outer steel frame during typical construction stages, respectively. The calculation results show that the stress of the core tube concrete structure was 2.3 MPa, 4.25 MPa, 7.66 MPa, 12.1 MPa, 14.9 MPa, and 15.1 MPa. The stress of the outer steel frame was 0 MPa, 112.46 MPa, 114.17 MPa, 159.7 MPa, 261 MPa, and 268 MPa, respectively, all of which did not exceed the maximum allowable stress value of the material. The structure was within the safe range. The results of this study were similar to those in references [16, 18], indicating that they were consistent with the actual situation.
5. SIMULATION AND ANALYSIS OF THE EFFECTS OF A MOVING LOAD ON CONSTRUCTION CHANNEL SAFETY
5.1. Analysis of the ANSYS Calculation Steps
The horizontal construction passage of the building was set between the main structure and the peripheral structure for vehicle transportation and pedestrian flow. The channel steel beam was simulated using the BEAM188 beam element, and the steel plate was simulated using the SHELL63 shell element [31]. The simulation process under the two types of loads was basically consistent, and the specific steps were as follows:
(1) Define the unit type, material properties, and beam cross-sectional dimensions.
(2) Establish geometric modelling of the steel beam and steel plate from bottom to top in the order of point, line and plane by using the direct method;
(3) Apply boundary constraints. Set the degree of freedom constraints at the horizontal position of the steel plate and steel beam, with Y-direction constraints at the beam position and Z-direction constraints at the four corners;
(4) Under the action of a car load, select the area that the car tires pass over;
(5) Apply the load. Under the action of a car load, there are three steps to loading: Step 1: apply wheel pressure only when the front wheels are on the platform; Step 2: place the front and rear wheels on the platform and apply wheel pressure; Step 3: apply wheel pressure only when the rear wheels are on the platform. Under full load, select the surface where the entire inclined plate is located and apply the average pressure;
(6) Under the action of the carload, the length of each unit that the car moves forward is calculated once, and the previously applied wheel pressure is deleted before the next calculation. The forward speed of the car is set to 0.25 m/s, and under full load, the applied load is directly calculated.
5.2. ANSYS Calculation Parameter Analysis
The horizontal passage at the settlement post-pouring zone of the building adopted a composite structure of steel beams and steel plates, and the horizontal construction passage is shown in Fig. (9).
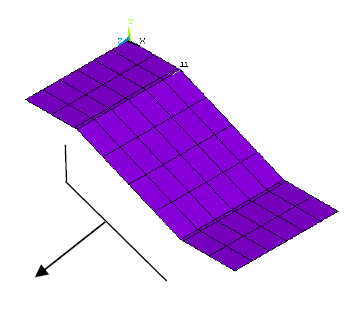
Simulation diagram of the construction channel for settlement of the post-pouring strip.
In Fig. (9), the pink area is the settlement post-pouring zone of the building, and the peripheral construction channel serves as a channel for large transportation vehicles and personnel flows. A channel was set up on the south side of the main structure to connect with the main structure, facilitating the entry of vehicles and personnel into the main structure. Due to the difference in elevation between the peripheral construction channel and the corresponding structural layer, a connecting channel was set up between the two. The steel beams under the horizontal construction channel had a span of 9 m and a height difference of 0.95 m between the top and bottom of the main structure. Therefore, the connecting part of the inner and outer channels was a beam plate combination structure with diagonal simple supports on both sides, as shown in Fig. (10).
During the construction process, 7 steel main beams, 3 secondary beams, and steel panels were initially set up. All the steel beams were hot-rolled H-shaped steel H400 × 400 ×13 × 21. The dimensions of the steel plate were 16 mm, and the steel plate was made of Q345B material. According to the “Code for Design of Steel Structures” [32], the elastic modulus of steel was taken as 2.06 × 10¹¹ Pa, Poisson's ratio was 0.3, and the density was 7850 kg/m2. The finite element model, with a unit size of 0.25 m, is shown in Fig. (11).
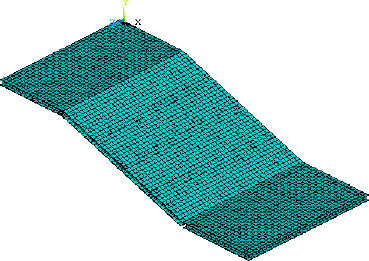
Schematic diagram of the finite element model.
There were two types of load forms:
5.2.1. Full Construction Load
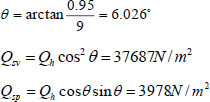
For a dynamic load of 20 kN/m2 and 70 t static load acting on the channel, according to the “Load Code for Building Structures” [32], the total distributed load value was:
 |
Due to the certain inclination angle of the channel, for ease of handling, the above distributed loads were decomposed, as follows in Fig. (12):
In the figure, θ is the inclination angle of the channel.
 |
5.2.2. Moving Vehicle Load
In this study, when simulating the dynamic load of a car, the dynamic load was simplified as the static load of motion, which was converted into gravity based on the actual weight of the car and then evenly distributed to each tire according to the number of tires (for large transport vehicles, 10 tires). Based on the size of the divided units, it was converted into the pressure value of the units under the action of the tires. Each unit that the car moved forward took 1 second.
The pressure value borne by each unit was:
 |
Using the same treatment method as the first load, the vertical pressure was decomposed into the pressure of the vertical channel and the pressure along the surface of the channel.
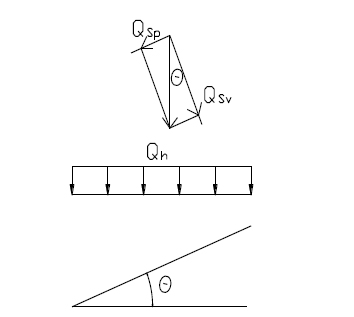
Equivalent diagram of the load.
5.3. Numerical Simulation Results
The connection between the steel and steel plates and the embedded parts on the reinforced concrete beam was welded, and a hinge joint was used here. The side edges of the steel plate and both ends of the steel secondary beam were free. Two horizontal plates were set as hinge constraints, as shown in Fig. (13).
By comparing the stress of inclined plates under full load and vehicle motion load, typical load steps were selected, and the differences in stress under the two types of loads were observed. The displacement and stress cloud diagram of the steel beam and steel plate when the car moved to the middle of the inclined plate (for the 41st load step) under the action of the car motion load are shown in Figs. (14-18).
Figs. (19-23) show the displacement and stress nephograms of the steel beam and steel plate under full load on the inclined plate.
Figs. (24-28) show the changes in the displacement in the Y-direction along a specific path selected on the inclined plate.
5.4. Results and Analysis
Figs. (14, 15, 19 and 20), show that the maximum total displacement (USUM) of the entire beam and plate under the action of a vehicle moving load and full load was 16.899 mm and 27.234 mm, respectively, and the maximum total displacement (USUM) of the steel beam was 11.358 mm and 23.241 mm, respectively, both at the centre of the inclined plate. Figs. (16 and 21) show that under the action of the dynamic automotive load, the vertical displacement at the horizontal plate was 0.610 mm in the positive direction, while the vertical displacement under the action of the dynamic automotive load on the inclined plate was in the negative direction. The maximum displacement was at the middle position, 10.460 mm, and the minimum displacement was near the upper and lower edges, 0.620 mm. Under the full load, the vertical displacement at the horizontal plate was in the positive direction of 1.115 mm, while the vertical displacement under the dynamic load of the car on the inclined plate was in the negative direction. The maximum displacement was at the middle position, 21.383 mm, and the minimum displacement was near the upper and lower edges, 1.385 mm. The comparative analysis of displacement under the two types of loads above shows that the displacement was smaller under the dynamic load of automobiles than under the full load and close to 0.5 times smaller. Moreover, it can be predicted that as an automobile moves, the area where the maximum displacement occurs changes accordingly, which can prevent the maximum displacement from continuously appearing in the same area under full load, which would cause safety hazards.
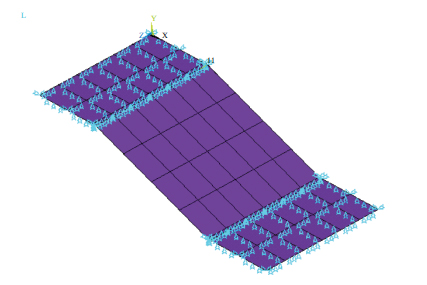
Schematic diagram of the constraint.
Figs. (17 and 22) show that the maximum stress intensity of the steel beam under two different loads was 0.106,106 MPa and 149 MPa. Both occurred within the middle two spans of the section steel main beam and at the lower edge of the section steel beam, the stress intensity from the lower edge to the upper edge increased accordingly. The minimum stress intensity occurred in both horizontal steel beams and oblique steel secondary beams, with values of 0.118, 11.8 MPa and 16.5 MPa, respectively.
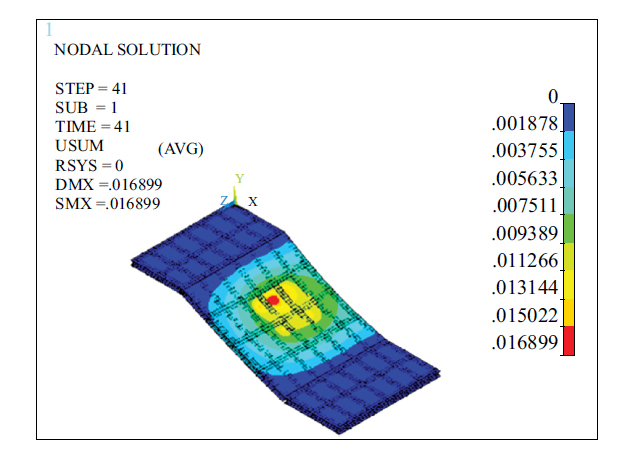
Cloud diagram of the total displacement of the vehicle under dynamic load (m).
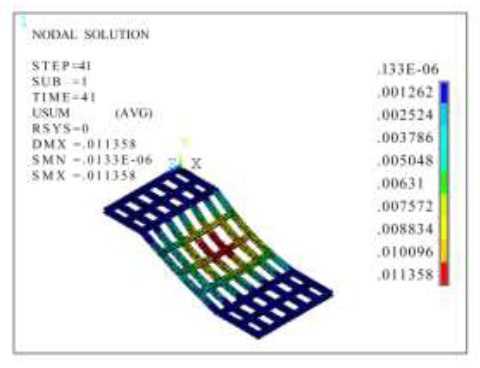
Cloud diagram of the total displacement of steel beams under an automotive dynamic load (m).
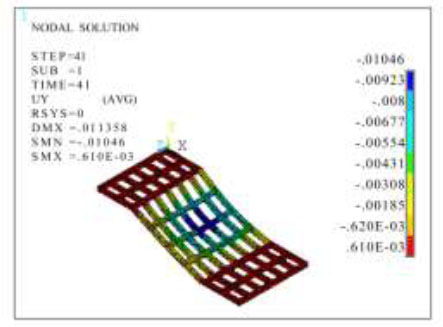
Cloud diagram of displacement in the Y-direction for a steel beam under the dynamic load of automobiles (m).
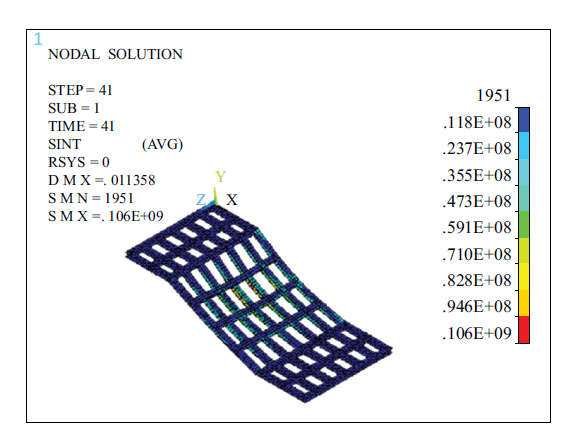
Cloud diagram of the stress intensity of a steel beam under the dynamic load of automobiles (N/m2).
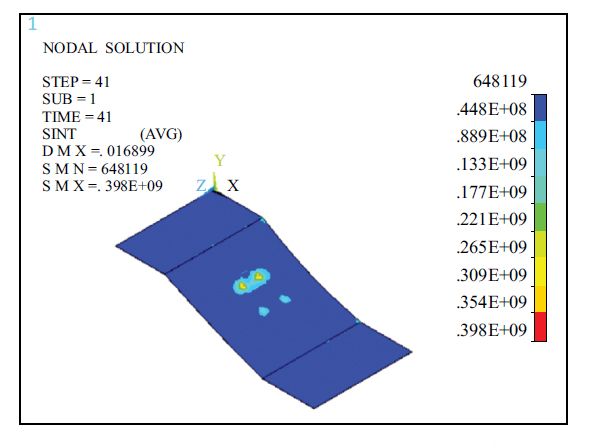
Cloud Diagram of stress intensity of a steel plate under the dynamic load of automobiles (N/m2).
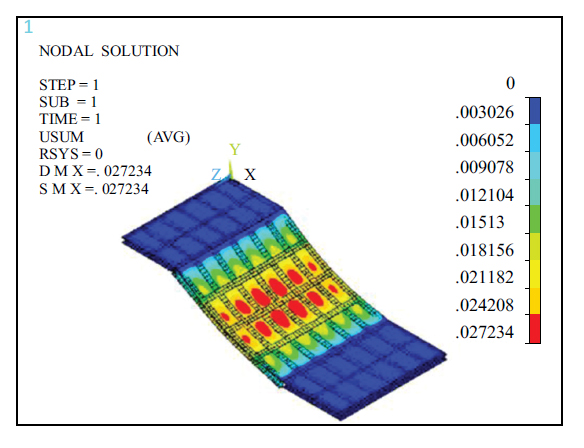
Cloud map of the overall displacement under full load (m)
Figs. (18 and 23) show that the maximum stress intensity of the steel plate was 0.398 when subjected to vehicle motion loads of 398 MPa, appearing at the point of load action, and when fully loaded, the maximum stress strength of the steel plate was 417 MPa, appearing in small local areas at the four corners of the steel plate. The stress intensity in most areas of the inclined plate was 100 MPa, and the minimum stress intensity appeared in the contact area with the secondary beam of the section steel, approximately 48 MPa.
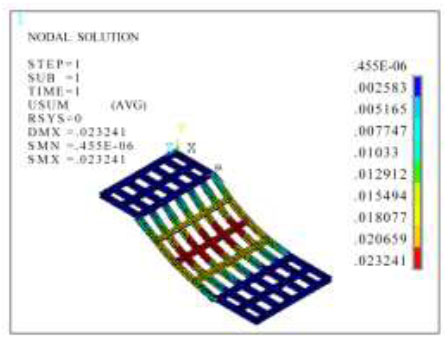
Cloud map of the total displacement of a steel beam under full load (m).
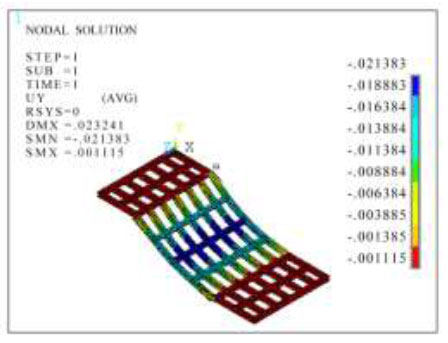
Cloud map of the displacement of a steel beam under full load in the Y-direction (m).
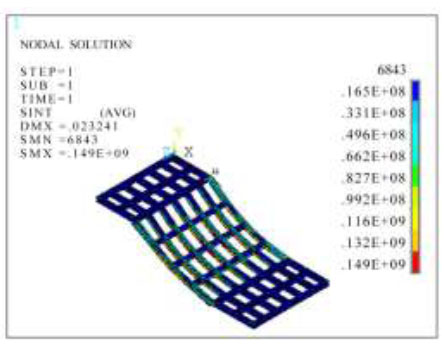
Cloud map of the stress intensity of steel beams under full load (N/m2).
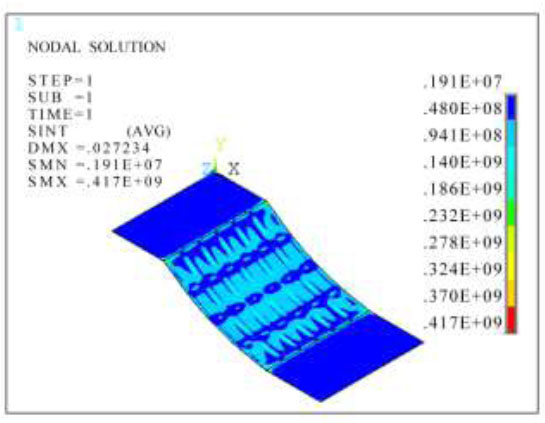
Cloud map of the stress intensity of steel plate under full load (N/m2).
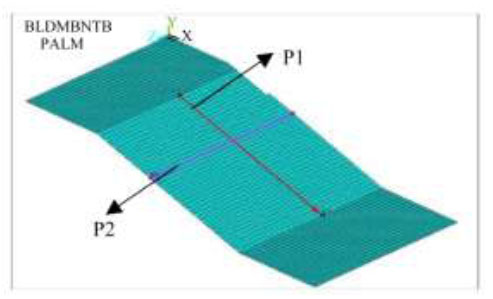
Path diagram.
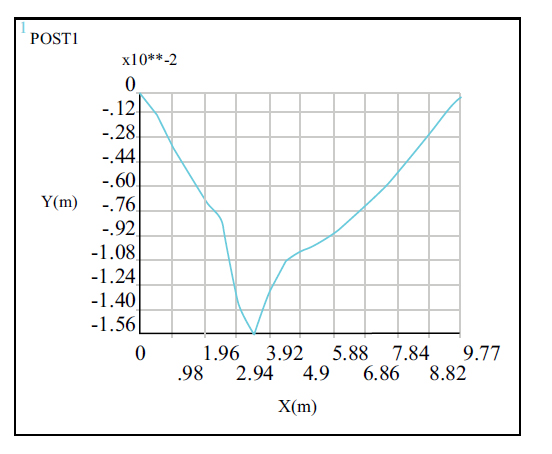
Displacement of path P1 under dynamic automotive load.
Figs. (25 and 26) show that under the dynamic load of the car, the vertical displacement of the plate from the upper and lower supports to the middle of the span (path P1) only had one extreme point, that is, at the point of load application, where the displacement value is 15.6 mm (negative). However, there were multiple extreme points in the vertical displacement change in the direction of the secondary beam (path P2), which was because the rear wheels of the car were in a double row, that is, within the tire width range, there was an extreme point with a maximum displacement value of 13.9 mm (negative).
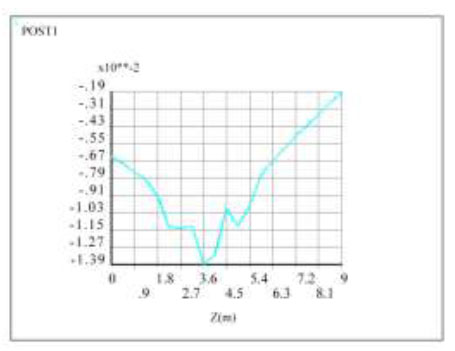
Displacement of path P2 under dynamic automotive load.
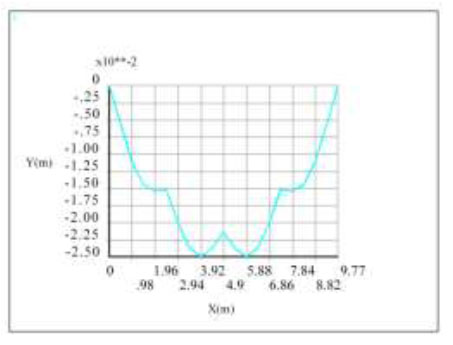
Displacement of path P1 under full load.
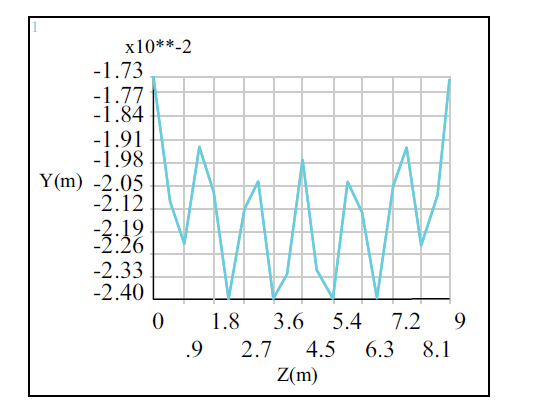
Displacement of path P2 under full load.
In Figs. (27 and 28), under full load, there were three extreme points from the upper and lower supports to the middle of the span (path P1), and the minimum values appeared at 3.92 m and 5.88 m from the upper support, that is, two were minimum displacement points, approximately 25 mm (negative direction), with a maximum value at a distance of 4.9 m from the upper support, and there was a maximum value in the middle of the minimum point. Therefore, the maximum negative displacement of the inclined plate appeared at two positions, with a distance of 1.96 m, and there was an increase in displacement between the two positions. In the direction of the secondary beam (in the direction of P2), the displacement values showed alternating fluctuations with the distribution of the steel main beam, and the distribution of the extreme points was symmetrical about the centre of the inclined plate. The maximum point was the position of the main beam, the minimum point was the position of each small plate near the middle of the span, and the maximum displacement value was 24 mm (negative direction).
According to the “Code for Design of Steel Structures” [30], if the deflection limit is taken as X, the maximum displacement value under the two types of loads was 25 mm<36 mm, indicating that the displacement of the beam slab channel met the requirements of the Code. Because the maximum thickness of the profiled steel beam was 21 mm, the tensile, compressive and flexural strengths were 295 MPa, and the shear strength was 170 MPa. After ignoring the local small area of the maximum stress, if the maximum stress of the profiled steel beam in other areas was 170 MPa, as shown in Fig. (17), then if fully loaded, the maximum stress of steel beams in other areas was 170 MPa, as shown in Fig. (22). Similarly, the thickness of the steel plate was 16 mm, and the shear strength was taken as 180 MPa. Small local areas with maximum stress were ignored. Under the action of automotive motion loads, the maximum stress of the steel plate in other areas was in the range of 177 to 180 MPa. Under full load, the maximum stress of steel plates in other areas ranged from 140 MPa to 186 MPa, which was greater than the stress intensity under vehicle motion load and exceeded the specification requirements. However, the range was not large. Therefore, the steel plates were considered to still be in a safe state [33].
CONCLUSION
Through theoretical analysis, detailed dynamic simulation and analysis of the actual project construction process, considering the influence of concrete shrinkage and creep during the whole construction process, the following was concluded:
(1) By using finite element analysis software, the dynamic process of each stage of structural construction was truly simulated, ensuring the continuity, authenticity, and safety of the structural construction process. At each construction stage and after the completion of construction, the deformation and stress of the main components of the structure were within the safe range and did not exceed the maximum allowable stress range of the material.
(2) During the construction process, there was a deformation difference between the elevation position of the floor and the design position under the action of gravity and construction loads, with the maximum deformation difference occurring in the middle part of the tower. After the construction was completed, the maximum vertical deformation of the core tube of the structure was 99 mm, and the maximum vertical deformation of the outer frame giant column was relatively small. The maximum vertical deformation of the two occurred in the middle of the structure. The advanced construction of the core tube had a certain impact on the vertical deformation difference of the tower, but it had a small impact on the overall deformation and could be adjusted through levelling during the construction process.
(3) The construction platform had little influence on the core cylinder. In the most unfavourable combination, considering the role of tower cranes and construction platforms on the core cylinder could meet the requirements of the construction process. The horizontal displacements of the core tube and outer steel were relatively small and could be ignored without consideration.
(4) Taking the horizontal construction channel at the post-pouring strip as an example, a simulation was conducted under two different load conditions. Steel plates and shaped steel beams were selected as the objects and compared with full load. The construction channel of the beam plate composite structure under the action of automotive motion load was in a safe state and had more safety assurance than the structure under full load. Thus, the results of this study provide a reliable reference for the safety of construction channels for high-rise buildings.
In future construction dynamic simulation analysis of similar structures, the finite element analysis method mentioned in the article can be used, but during the construction process, attention should be paid to the deformation differences that occur in the middle of the tower. In addition, the overall impact of the construction platform on the stress of the core tube structure is relatively small, but attention should be paid to the stress analysis of the horizontal construction channel of the post-pouring belt.
AUTHOR’S CONTRIBUTION
Y.L.: Study conception and design were contributed; C.G.: Data collection was provided; H.W.: Methodology was adopted.
ABBREVIATION
| BIM | = Building Information Modeling |
AVAILABILITY OF DATA AND MATERIAL
The data used in the paper comes from the actual design data of Wuhan Center. The research team established a model based on actual engineering problems for analysis and calculation, and analyzed the results. The data supporting the findings of the study will be available upon reasonable request by the corresponding author [Y.L].
FUNDING
This work was funded by Henan Province Science and Technology Research Project (232102321016), Key Project of Research and Practice on Higher Education Teaching Reform in Henan Province (2024SLGLX0174), Henan Province Higher Education Research Project (2021SXHLX 101), Research Project on Higher Education Teaching Reform of Huanghuai University, China (2022XJGYLX03).


