All published articles of this journal are available on ScienceDirect.
Liquefaction Potential Analysis on Pandansimo Bridge using Nonlinear Site Response Analysis
Abstract
Background
The construction of bridges is one of the infrastructures that support the Trans South-South Java Road in Yogyakarta Province, including the Pandansimo Bridge. This bridge is located in a high liquefaction vulnerability zone near the coastal area with a shallow groundwater table, composed of saturated sandy soil and less than 10 km from the active Opak fault.
Objective
The study aims to evaluate the liquefaction potential in the Pandansimo Bridge area with the scenario of the 2006 Yogyakarta earthquake of 6.3 Mw.
Methods
The evaluation used eight modified pairs of ground motion to obtain peak ground acceleration values through nonlinear calculations with site-specific response analysis. Furthermore, the liquefaction potential analysis was conducted based on these results using simplified procedure methods.
Results
The results show that each soil layer’s peak ground acceleration value ranged from 0.30 g to 0.49 g. Liquefaction potential is at a depth of 1 m to 16 m, with various thicknesses for each borehole depending on the soil properties, with vulnerability levels varying from very low to very high.
Conclusion
The findings indicate that liquefaction potential occurs at several borehole locations at Pandansimo Bridge. This liquefaction condition may serve as a reference for mitigating strategies applicable in case of probable liquefaction in the infrastructure.
1. INTRODUCTION
Developing an integrated and sustainable road and bridge network system is among the efforts to enhance connectivity for a region’s development. In this context, the Indonesian government has prioritized the cons- truction of the Pandansimo Bridge in Yogyakarta Province as part of the Trans South-South Java Road route. The bridge construction will support the prosperity of Java's coastal region, thereby contributing to the local economy through transportation infrastructure. Despite the signi- ficance of this infrastructure, natural disasters, such as earthquakes, pose substantial challenges to sustainability. Specifically, the earthquake on May 27, 2006, due to the Opak fault [1], had a magnitude of 6.3 Mw and lasted for approximately 60 seconds, causing severe damage such as liquefaction [2].
The Indonesian National Standard (SNI) 2833:2016 governs seismic loads for bridges in Indonesia. The standard requires site-specific response analysis (SSRA) to be conducted when the seismic source is less than 10 km from the bridge location due to the potential effect of the fault [3]. Based on soil investigation data collected in 2022, the location of the Pandansimo Bridge construction has predominantly sandy soil and a shallow groundwater table, with a distance of approximately 8.9 km from the active Opak fault.
Dynamic responses in structures that occur due to earthquakes potentially cause many losses [4]. This condition showed that the infrastructure design must consider several earthquake damages, one of which is the liquefaction potential [3-5], particularly for bridges built in regions susceptible to lateral spreading across streams and rivers that can be triggered by earthquakes [6]. The seismic design for structural engineering requires ground motion parameters such as peak ground acceleration (PGA) [7]. The PGA value represents the acceleration level observed at the surface during an earthquake, which will be used to calculate the cyclic stress originating from the earthquake. Hence, several studies related to liquefaction potential in the Yogyakarta area have been conducted on the southern coast of Yogyakarta and the Opak River [8, 9]. However, the location of Pandansimo Bridge has remained unexplored in terms of its liquefaction hazard, considering that this bridge is a large structure, will be used extensively for traffic, and has a proximity to the active Opak fault, which is a highly vulnerable seismic hazard as one of the causes of liquefaction.
Liquefaction potential analysis has a major impact on future bridge design and retrofitting practices, particularly in seismically active countries. It allows for modification of bridge design for liquefaction resistance, necessitating updated standards and more stringent geotechnical analysis to determine liquefaction potential before construction begins.
Based on the description, this research aimed to evaluate the susceptibility of Pandansimo Bridge to liquefaction due to its location in a highly susceptible area. The investigation was conducted at six borehole points on the main span of Pandansimo Bridge using the soil investigation data. The nonlinear analysis approach is used to represent the complex soil behavior under seismic loading [10]. The SSRA method was used to calculate the PGA value, a crucial parameter for planning and designing buildings, and calculating liquefaction during an influential earthquake. The empirical method assessed liquefaction potential by comparing the cyclic resistance ratio (CRR) and cyclic stress ratio (CSR) at various depths. These values were used to calculate the safety factor (FS), which was applied to calculate liquefaction potential analysis (LPI).

Borehole locations of pandansimo bridge modified from the geologic map of Yogyakarta [11].
2. MATERIALS AND METHODS
2.1. The Research Area
The research was conducted at Pandansimo Bridge, built across the Progo River. This 1,900 m long bridge served as a national priority program from the Indonesian government, connecting the national road between Kulon Progo and Bantul Regency. Moreover, the evaluation focused on the 675 m long main bridge, comprising the construction of 6 borehole points with a depth of 40 m, as shown in Fig. (1).
2.2. Geological and Geotechnical Conditions
In Bantul Regency, the geological conditions are defined mainly by young volcanic deposits (Qmi), which are included in quaternary deposits [11]. The research location has a geological character that combines fluvial, estuary, alluvial, coastal, and eolian sedimentation with the liquefaction potential [12].
The soil investigation survey of the main bridge conducted in 2022 showed that the N-SPT value at the site varies between 2 and 60, with a value below 20 showing a high susceptibility to potential structural damage [13]. Moreover, the results of soil laboratory tests revealed a variety of fine content (FC) values. The N-SPT and FC values at the research location are shown in Fig. (2) for all boreholes. Additionally, the value of groundwater level is among the factors that trigger liquefaction. The variation of groundwater level is between 0.2 m to 1.2 m, thereby categorizing the location as having very high liquefaction susceptibility [14]. The liquefaction vulnerability analysis shows that water plays a critical role in influencing the behavior of soil during seismic events. When an earth- quake occurs, the shaking can cause the groundwater level to rise and saturate the soil, particularly in sandy soils.
The difference from ground surface water behavior is that it is characterized by a sudden change in depth and velocity of a flowing liquid, typically transitioning from a higher velocity (supercritical flow) to a lower velocity (subcritical flow) [15, 16]. The environmental impacts include the potential for erosion and damage to riverbanks and beds if excess energy is not contained [17].
The soil investigation survey of the main bridge conducted in 2022 showed that the location was dominated by well-graded sand (SW), silty sand (SM), and poorly graded sand (SP), as presented in Fig. (3). The susceptibility of poorly graded soil to liquefaction was higher than to well-graded type due to instability. Grain size distribution for samples taken at three borehole points with a certain depth at the location showed that the soil gradation was susceptible to liquefaction potential based on the curve [18], as presented in Fig. (4).
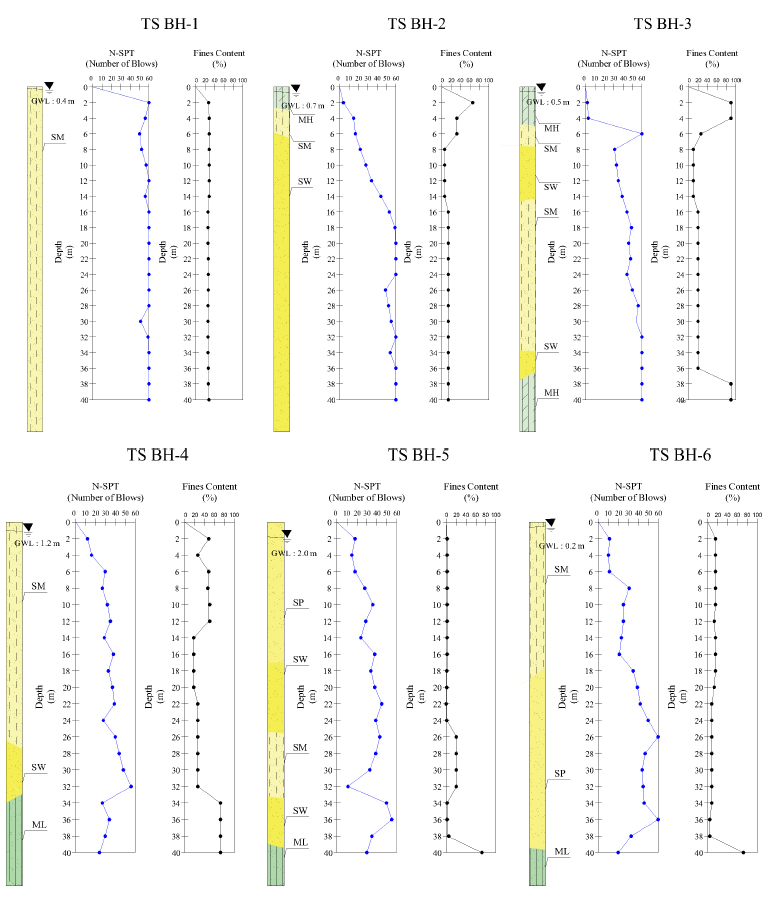
Soil boring log data and fine content (FC) value from the soil investigation survey of 6 borehole points.
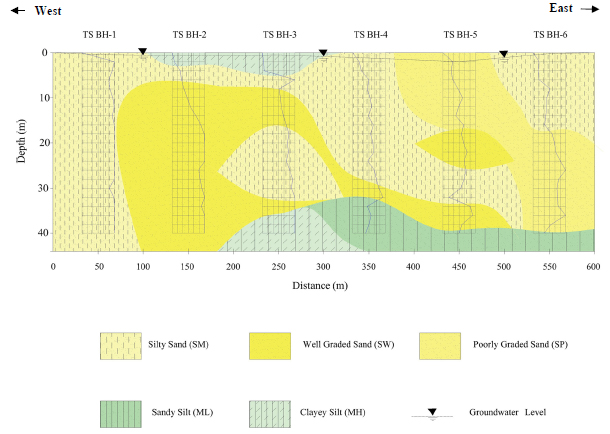
Soil stratigraphy based on soil investigation of 6 boreholes.
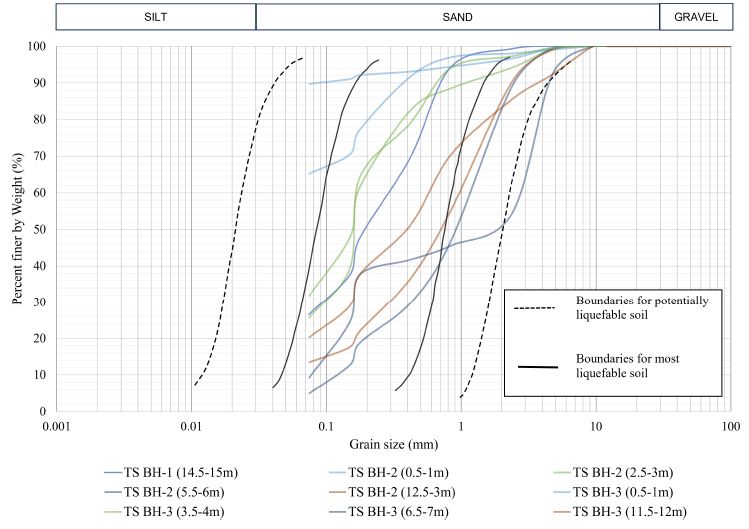
Grain size analysis based on soil investigation of 3 boreholes.
2.3. Earthquake Source Around the Research Area
The Pandansimo Bridge was constructed between active faults, namely the Banjarnegara - Luk Ulo, the Gadjah Mungkur dam north, and the Opak. Specifically, the Opak fault was the source of the 2006 earthquake, which caused more than 5,700 deaths and economic losses of over $3 billion [2]. Based on USGS earthquake data [19], within 100 years with a radius of 150 km, 84 incidents reached a minimum magnitude of 5 Mw. Based on the historical data, this location was highly susceptible to liquefaction, which occurred due to an earthquake with a minimum magnitude of 5 [20].
2.4. Earthquake Input Motion
The selection of ground motion can be determined by considering several factors, including the earthquake magnitude (M) and the distance from the source (R) [21]. The M-R parameters used are derived from [22] through 4 earthquake sources, namely megathrust, benioff, shallow crustal, and all sources with a probability of 7% in 75 years. According to the spectral target, eight pairs of ground motions with various parameters are used for amplitude scaling in the site-specific analysis. Table 1 is a summary of ground motion and the scaling factor that was obtained from a few events [23, 24].
| No. | RSN | Event | Station | M (Mw) | R (km) | D5-95 | Scaling Factor |
|---|---|---|---|---|---|---|---|
| 1. | 138 | Tabas, Iran | Boshrooyeh | 7.35 | 74.66 | 19.50 | 2.74 |
| 2. | 180 | Imperial valley-06 | El Centro Array #5 | 6.53 | 27.8 | 9.60 | 0.60 |
| 3. | 182 | Imperial valley-06 | El Centro Array #7 | 6.53 | 27.64 | 6.80 | 0.58 |
| 4. | 575 | Taiwan SMART1(45) | SMART1 I07 | 7.30 | 77.12 | 19.40 | 1.67 |
| 5. | 1640 | Odd, Iran | Tonekabun | 7.37 | 131.71 | 25.90 | 2.44 |
| 6. | 5985 | El Mayor-Cucapah, Mexico | El Centro Differential Array | 7.20 | 60.65 | 13.80 | 1.65 |
| 7. | 4032460 | Kushiro-oki | 47418 | 7.59 | 107.16 | 19.00 | 1.89 |
| 8. | 6001025 | South Peru | POCONCHILE RETEN DE CARABINEROS (ETNA) | 8.41 | 28.77 | 17.49 | 1.98 |
Response spectrum is required to evaluate the impact of an earthquake on a structure [25]. The target response spectrum uses medium soil (SD) to calculate the correlation of N-SPT values and shear wave velocity ( ) [3]. In this research, the values of PGA, Ss, and S1 were used to determine the response spectrum at the ground surface; refer to the website https://lini.binamarga
.pu.go.id/ developed by the Ministry of Public Works and Public Housing of Republic Indonesia. Other parameters include the values of amplification factors FPGA, Fa, and Fv. The target response spectrum at the research location is shown in Fig. (5), with As, SDS, and SD1 obtained from the calculation results of 0.450, 1.051, and 0.593, respectively.
According to the standard recommendation, the spectral acceleration obtained according to SSRA analysis should be at least two-thirds of the value of the spectral design acceleration for each period [3]. Fig. (6) shows the ground motion collection response and the target response spectrum.
Ground motion modification was conducted over the fundamental period range (Tf) between 0.5Tf to 2Tf [3], ranging from 1.21 to 4.82 seconds. The average response spectrum of all ground motion was equivalent or more than 90% in the specified range [26] to maintain representative ground motion characteristics with actual earthquake events, as shown in Fig. (7). Furthermore, the scale factor value recommended [27] was maximum of 5, the result of amplitude scaling from ground motion selected was between 0.6 to 2.8.
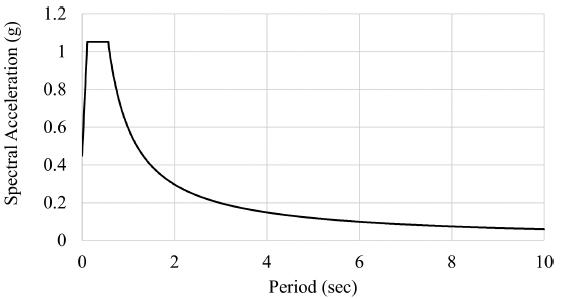
Spectrum target at the research area.
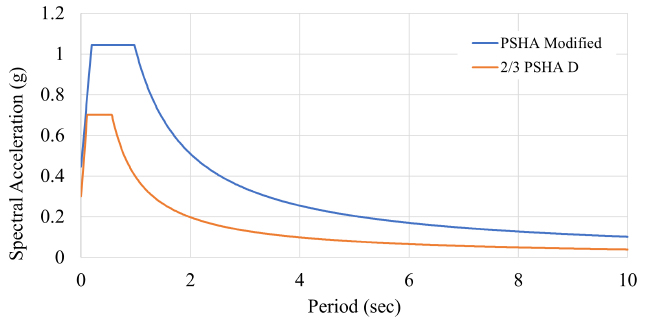
Comparison of response spectrum SSRA and response spectrum class D.
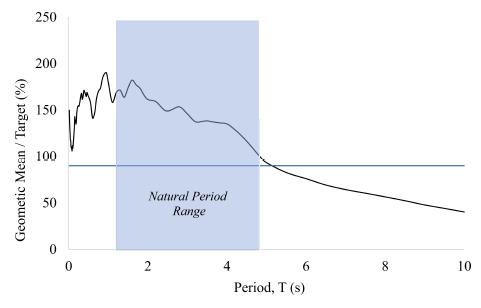
Average modified response spectrum.
| Depth (m) |
(H) (m) |
N-SPT | γb (kN/m3) | γsat (kN/m3) | σvc (kN/m2) | σ'vc (kN/m2) |
 (m/s) (m/s) |
CVs | φ (o) | τmax (kPa) | K 0 | fmax |
|---|---|---|---|---|---|---|---|---|---|---|---|---|
| 1 | 1 | 11 | 21.73 | 22.13 | 21.73 | 12.32 | 130.04 | 29.98 | 35.18 | 38.66 | 0.42 | 32.51 |
| 2 | 1 | 11 | 21.73 | 22.13 | 43.46 | 24.64 | 153.16 | 41.58 | 35.18 | 58.95 | 0.42 | 38.29 |
| 3 | 1 | 10 | 21.73 | 22.13 | 65.19 | 36.96 | 167.00 | 49.44 | 33.44 | 73.85 | 0.45 | 41.75 |
| 4 | 1 | 10 | 21.73 | 22.13 | 86.92 | 49.29 | 178.73 | 56.63 | 33.44 | 89.18 | 0.45 | 44.68 |
| 5 | 1 | 11 | 21.73 | 22.13 | 108.65 | 61.61 | 190.13 | 64.08 | 33.56 | 104.94 | 0.45 | 47.53 |
| 6 | 1 | 11 | 21.73 | 22.13 | 130.38 | 73.93 | 198.49 | 69.84 | 33.56 | 118.88 | 0.45 | 49.62 |
| 7 | 1 | 31 | 22.81 | 23.17 | 153.19 | 87.28 | 228.01 | 96.72 | 41.21 | 173.14 | 0.34 | 57.00 |
| 8 | 1 | 31 | 22.81 | 23.17 | 175.99 | 100.64 | 235.80 | 103.44 | 41.21 | 191.56 | 0.34 | 58.95 |
| 10 | 2 | 25 | 22.81 | 23.17 | 221.61 | 127.35 | 244.18 | 110.92 | 38.67 | 212.83 | 0.38 | 30.52 |
| 12 | 2 | 25 | 21.50 | 21.82 | 264.60 | 151.36 | 254.34 | 113.45 | 37.97 | 231.58 | 0.38 | 31.79 |
| 14 | 2 | 23 | 21.73 | 22.13 | 308.07 | 176.00 | 261.45 | 121.18 | 36.65 | 252.13 | 0.40 | 32.68 |
| 16 | 2 | 21 | 21.73 | 22.13 | 351.53 | 200.65 | 267.32 | 126.67 | 35.35 | 269.02 | 0.42 | 33.41 |
| 18 | 2 | 35 | 22.81 | 23.17 | 397.14 | 227.36 | 289.16 | 155.55 | 39.95 | 345.97 | 0.36 | 36.14 |
| 20 | 2 | 39 | 22.54 | 22.82 | 442.22 | 253.39 | 299.75 | 165.22 | 40.69 | 383.08 | 0.35 | 37.47 |
| 22 | 2 | 32 | 22.05 | 22.57 | 486.32 | 278.91 | 300.85 | 162.80 | 37.75 | 378.75 | 0.39 | 37.61 |
| 24 | 2 | 40 | 23.17 | 23.65 | 532.66 | 306.59 | 314.30 | 186.72 | 39.91 | 443.15 | 0.36 | 39.29 |
| 26 | 2 | 60 | 23.17 | 23.65 | 579.00 | 334.26 | 333.51 | 210.24 | 45.66 | 552.28 | 0.28 | 41.69 |
| 28 | 2 | 47 | 23.17 | 23.65 | 625.34 | 361.93 | 331.95 | 208.28 | 41.25 | 525.68 | 0.34 | 41.49 |
| 30 | 2 | 44 | 23.17 | 23.65 | 671.68 | 389.60 | 335.64 | 212.94 | 39.94 | 539.12 | 0.36 | 41.96 |
| 32 | 2 | 45 | 23.17 | 23.65 | 718.02 | 417.27 | 341.86 | 220.90 | 39.88 | 569.53 | 0.36 | 42.73 |
| 34 | 2 | 46 | 23.17 | 23.65 | 764.36 | 444.94 | 347.81 | 228.66 | 39.84 | 599.84 | 0.36 | 43.48 |
| 36 | 2 | 60 | 22.22 | 22.41 | 808.81 | 470.15 | 361.47 | 236.85 | 43.72 | 686.39 | 0.31 | 45.18 |
| 38 | 2 | 33 | 21.22 | 21.44 | 851.24 | 493.40 | 345.22 | 206.28 | 35.30 | 555.61 | 0.42 | 43.15 |
| 40 | 2 | 20 | 20.24 | 20.46 | 891.72 | 514.70 | 301.56 | 150.13 | 31.72 | 468.27 | 0.47 | 37.69 |
In the amplitude scaling method, the value of significant duration (D5-95) should be considered. The significant duration parameter is the time when the energy is lost within the range of 5-95% of the total earthquake acceleration energy calculated using [28]. This parameter can be used as a quantitative measure to determine the appropriateness of ground motion duration length [26].
2.5. SSRA Modeling
DEEPSOIL V7 software analyzes site response and models the amplification through the 1-D column. In this research, nonlinear total stress analysis is performed with a pressure-dependent hyperbolic stress-strain model [29] using the GQ/H Soil Model with Non-Masing Re/Unloading Behavior. The GQ/H method represents the nonlinear behavior of small strains and soil shear strengths [30]. When simulating soil behavior under large strains with the GQ/H model, the shear strength of each layer needs to be counted. Eq. (1) calculates the maximum value of shear strength. (τmax). where σ'vc is effective stress (kN/m2), φ is the soil friction angle (degrees), and CVs is developed at 0.1% shear strain for a linear elastic material with 80% of the maximum shear modulus that can be calculated with Eq. (2) using density (ρ) and shear wave velocity ( ) by using Eqs. (3-5) for some soil types proposed [31]. where N60 is the N-SPT value corrected to 60% efficiency, and σ'vc is effective stress (kN/m2). Additionally, the reference soil dynamic curves suggested by [31] are the plasticity index (PI) and soil pressure coefficient at idle conditions (K0) obtained in Eq. (6). where φ is the soil friction angle (degrees), OCR is the over-consolidation ratio where the value is 1 [30].
 |
(1) |
 |
(2) |
 |
(3) |
 |
(4) |
 |
(5) |
 |
(6) |
Layer thickness (H) must be considered in the nonlinear analysis, which will affect the maximum frequency (fmax) transmitted through the soil layer with a minimum value of 30 Hz for all layers [32] using Eq. (7). where  is the shear wave velocity of the layer (m/s), and H is the layer thickness (m). The parameter values for the soil profile of TS BH-6 inputted into DEEPSOIL V7 are presented in Table 2 with a groundwater level depth of 0.2 m.
 |
(7) |
2.6. Liquefaction Potential Analysis
The simplified procedure is a method used to evaluate liquefaction potential. In this process, CRR is compared with the value of CSR. CSR value used is based on the Eqs. (8-11) [33]. where amax is the maximum PGA (m/s2), σvc is the total stress (kN/m2), σ'vc is the effective stress (kN/m2), g is the acceleration of gravity (m/s2), rd is the coefficient of stress reduction, z is the depth (m), and M is the moment magnitude. The PGA can be determined using a ground motion predicting model that considers the research distance from the fault and the soil properties [34]. The maximum PGA values (amax) used in this research are obtained based on SSRA calculations for each soil layer.
 |
(8) |
 |
(9) |
 |
(10) |
 |
(11) |
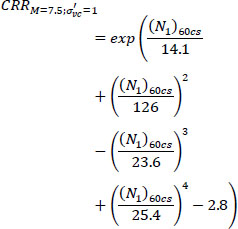
CRR is the ratio of cyclic resistance of soil to resist cyclic shear stress, and the value is determined [33], as expressed in Eqs. (12,13). where  is the CRR value at magnitude 7.5 Mw,
  is the CRR value, MSF is the magnitude scaling factor and Kσ is the overburden correction factor.
The results of the comparison of CRR with CSR are used to obtain the FS value is obtained using Eq. (14). When the FS value is less than 1, the location has liquefaction potential.
 |
(12) |
 |
(13) |
 |
(14) |
2.7. Liquefaction Potential Index (LPI)
The level of liquefaction potential can be calculated with LPI using Eqs. (15-19) developed by [35]. This method considers the level of soil layer damage (F) and the depth factor (w(z)). The depth factor considered in the LPI method is approximately 20 m below the surface.
 |
(15) |
 |
(16) |
 |
(17) |
 |
(18) |
 |
(19) |
In this research, LPI is determined [35], and categorized into many susceptibility levels, from very low to very high, as presented in Table 3.
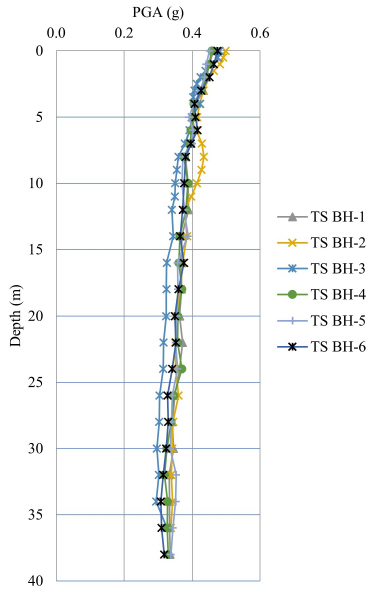
PGA per soil layer.
3. RESULTS AND DISCUSSION
3.1. Peak Ground Acceleration
SSRA calculation using DEEPSOIL V7 software obtained PGA values for each soil layer. The PGA value for each borehole shown in Fig. (8) was used to calculate the CSR value, which produced FS to determine the potential liquefaction layer. The PGA at the surface in TS BH-2 and TS BH-3 has the highest value of 0.49 and 0.48, respectively, compared to the other four borehole points because the soft soil dominated the upper soil layer with low N-SPT values, allowing amplification. Similarly, the soil at a location was softer, and the amplification tended to be more significant [36]. The earthquake acceleration at bedrock for all boreholes ranged from 0.33 g to 0.34 g, while the PGA value for each layer varied between 0.30 g and 0.49 g. The highest PGA value of 0.49 g was obtained in a soft soil clayey silt (MH) with a low N-SPT of 4. Meanwhile, the lowest value of 0.3 g was obtained in dense sand with a high N-SPT value of 60, showing the need to analyze liquefaction potential [37].
| LPI | Categories |
|---|---|
| 0 | Very low |
| 0 < LPI ≤ 5 | Low |
| 5 < LPI ≤ 15 | High |
| >15 | Very high |
3.2. Liquefaction Potential Analysis
Analysis of liquefaction potential at Pandansimo Bridge was performed using soil investigation data obtained in 2022 at six borehole points, namely TS BH-1, TS BH-2, TS BH-3, TS BH-4, TS BH-5, and TS BH-6. Based on the soil investigation report, the groundwater level (GWL) was at a depth of 0.2 m to 2 m, showing a very high liquefaction vulnerability [14]. The predominant soil types were found to be sandy soil, such as well-graded sand (SW), poorly graded sand (SP), and silty sand (SM). The fine content (FC) value for each borehole varied with values less than 15% at TS BH-2 in a depth of 7 m - 40 m, TS BH-3 at 7 m to 14 m, TS BH-4 at 1 m to 24 m, and TS BH-6 in a depth of 22 m to 38 m. Other than those borehole points and depths, the fine content value is more than 15%.
The earthquake data used for analysis was 6.3 Mw, which occurred on May 27, 2006, from the Opak fault at a distance of 8.87 km from the research location. The liquefaction potential analysis was carried out using the PGA value per depth obtained from the SSRA calculation to achieve the CSR value. Moreover, the results of analysis conducted at point TS BH-6 are shown in Table 4.
Based on the results, the FS value for point TS BH-6 ranged from 0.5 to 2.0. The liquefaction potential layer was found at a depth of 1 m to 6 m, dominated by silty sand (SM) with GWL at 0.2 m, with a low N-SPT in the range of 10 to 11 and CRR value in the range of 0.23 to 0.29 resulting in an FS value less than 1. At depths ranging from 7 m to 10 m, it does not have the potential for liquefaction due to a higher N-SPT value in the range of 25 to 31. Meanwhile, at 12 m to 16 m, it has the potential for liquefaction due to a lower fine content value compared to the overlaying layer, at 12.96%. There was no indication for depths over 16 m because the N-SPT value was over 30, causing a high CRR with minimal hazard [13].
|
Depth (m) |
N-SPT | PGA | FC | α(z) | β(z) | rd | MSF | Kσ | CSR |
CRR (M = 7.5) |
CRR | FS | Exp |
|---|---|---|---|---|---|---|---|---|---|---|---|---|---|
| 1 | 11 | 0.47 | 16.85 | -0.027 | 0.003 | 1.00 | 1.37 | 1.1 | 0.48 | 0.18 | 0.27 | 0.58 | L |
| 2 | 11 | 0.46 | 16.85 | -0.077 | 0.009 | 0.98 | 1.37 | 1.1 | 0.48 | 0.19 | 0.29 | 0.61 | L |
| 3 | 10 | 0.45 | 16.85 | -0.134 | 0.015 | 0.96 | 1.37 | 1.1 | 0.48 | 0.17 | 0.26 | 0.55 | L |
| 4 | 10 | 0.43 | 16.85 | -0.197 | 0.022 | 0.95 | 1.37 | 1.076 | 0.48 | 0.16 | 0.24 | 0.50 | L |
| 5 | 11 | 0.41 | 16.85 | -0.266 | 0.03 | 0.93 | 1.37 | 1.054 | 0.47 | 0.17 | 0.25 | 0.53 | L |
| 6 | 11 | 0.41 | 16.85 | -0.341 | 0.038 | 0.91 | 1.37 | 1.032 | 0.46 | 0.16 | 0.23 | 0.50 | L |
| 7 | 31 | 0.42 | 16.85 | -0.42 | 0.047 | 0.89 | 1.37 | 1.029 | 0.45 | 0.98 | 1.39 | 2.00 | NL |
| 8 | 31 | 0.40 | 16.85 | -0.504 | 0.057 | 0.86 | 1.37 | 0.994 | 0.44 | 0.76 | 1.04 | 2.00 | NL |
| 10 | 25 | 0.38 | 16.85 | -0.682 | 0.076 | 0.82 | 1.37 | 0.956 | 0.42 | 0.33 | 0.43 | 1.03 | NL |
| 12 | 25 | 0.38 | 12.96 | -0.869 | 0.097 | 0.77 | 1.37 | 0.935 | 0.40 | 0.26 | 0.33 | 0.83 | L |
| 14 | 23 | 0.37 | 12.96 | -1.061 | 0.118 | 0.73 | 1.37 | 0.918 | 0.37 | 0.23 | 0.29 | 0.77 | L |
| 16 | 21 | 0.37 | 12.96 | -1.251 | 0.138 | 0.68 | 1.37 | 0.909 | 0.35 | 0.20 | 0.24 | 0.69 | L |
| 18 | 35 | 0.38 | 12.96 | -1.434 | 0.158 | 0.64 | 1.37 | 0.835 | 0.33 | 0.46 | 0.53 | 1.60 | NL |
| 20 | 39 | 0.36 | 12.96 | -1.605 | 0.176 | 0.61 | 1.37 | 0.807 | 0.31 | 0.50 | 0.56 | 1.78 | NL |
| 22 | 32 | 0.35 | 8.1 | -1.759 | 0.191 | 0.18 | 1.37 | 0.858 | 0.09 | 0.22 | 0.25 | 2.00 | NL |
| 24 | 40 | 0.35 | 8.1 | -1.891 | 0.204 | 0.16 | 1.37 | 0.808 | 0.08 | 0.32 | 0.35 | 2.00 | NL |
| 26 | 60 | 0.34 | 8.1 | -1.998 | 0.214 | 0.14 | 1.37 | 0.642 | 0.07 | 2.00 | 1.76 | 2.00 | NL |
| 28 | 47 | 0.33 | 8.1 | -2.076 | 0.221 | 0.13 | 1.37 | 0.742 | 0.07 | 0.47 | 0.48 | 2.00 | NL |
| 30 | 44 | 0.33 | 8.1 | -2.123 | 0.224 | 0.13 | 1.37 | 0.767 | 0.06 | 0.32 | 0.34 | 2.00 | NL |
| 32 | 45 | 0.32 | 8.1 | -2.138 | 0.223 | 0.12 | 1.37 | 0.756 | 0.06 | 0.32 | 0.33 | 2.00 | NL |
| 34 | 46 | 0.32 | 8.1 | -2.12 | 0.219 | 0.13 | 1.37 | 0.747 | 0.06 | 0.31 | 0.32 | 2.00 | NL |
| 36 | 60 | 0.31 | 2.73 | -2.07 | 0.211 | 0.13 | 1.37 | 0.555 | 0.07 | 1.56 | 1.18 | 2.00 | NL |
| 38 | 33 | 0.31 | 2.73 | -1.99 | 0.199 | 0.14 | 1.37 | 0.821 | 0.07 | 0.16 | 0.18 | 2.00 | NL |
| 40 | 20 | 0.32 | 72.61 | -1.881 | 0.185 | 0.16 | 1.37 | 0.821 | 0.08 | 0.15 | 0.17 | N/A | N/A |
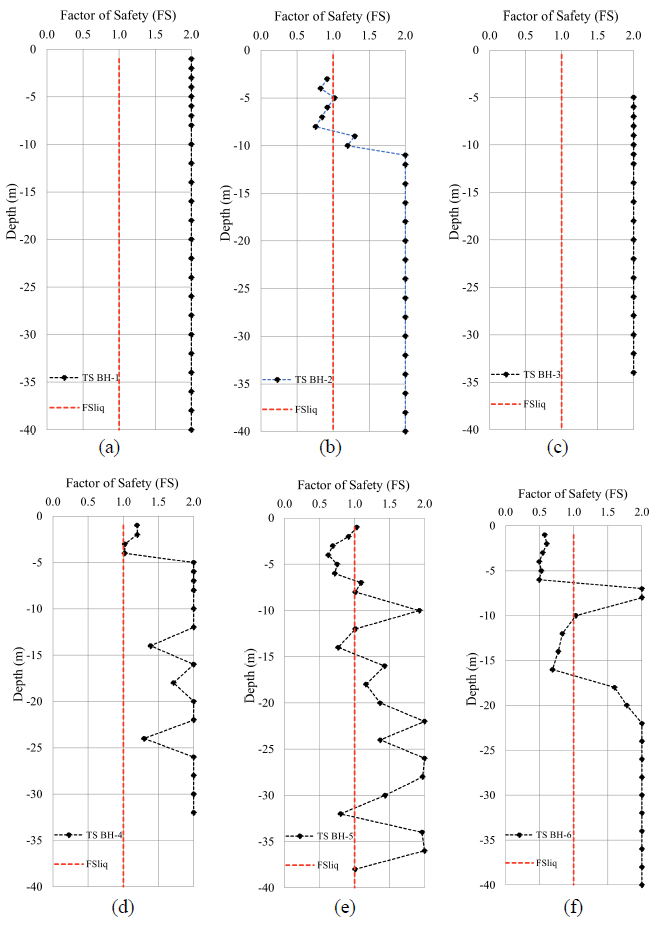
FS value of 6 borehole points (a) FS of TS BH-1 (b) FS of TS BH-2 (c) FS of TS BH-3 (d) FS of TS BH-4 (e) FS of TS BH-5 (f) FS of TS BH-6.
Layers with liquefaction potential showed varying depths due to differences in soil properties at each borehole point from the N-SPT value and the level of fine content. TS BH-1 and TS BH-3 showed high N-SPT values in the range of 31 to 60, making these points not susceptible to liquefaction. The condition at TS BH-2 differed significantly, indicating a low N-SPT value of 8 m, which showed high susceptibility at a depth of 3 m to 8 m with N-SPT value in the range of 15 to 22. However, there was no indication at 1 m to 2 m due to the formation of silty soil. TS BH-4 did not show potential due to the high fine content value in the range of 18% to 48% compared to TS BH-5 and TS BH-6. Moreover, the summarized FS values obtained for all borehole points are presented in Fig. (9).
The LPI value was determined for each layer using FS and calculated with Eq. (15) to analyze the potential of liquefaction based on the categories of vulnerability. The recapitulation of the LPI results and the categories of vulnerability is shown in Table 5.
Based on the LPI category, 3 points are in the very low category, and other borehole points have very high categories. This is consistent with the FS, where the very high category is found in TS BH-6, which has the most liquefaction potential layer. Meanwhile, other borehole points in the very low category, namely TS BH-1, TS BH-3, and TS BH-4, do not have liquefaction potential.
| S.No. | Borehole | LPI | Categories of vulnerability |
|---|---|---|---|
| 1 | TS BH-.5 | 0.00 | Very low |
| 2 | TS BH-.9 | 1.49 | Low |
| 3 | TS BH-.13 | 0.00 | Very low |
| 4 | TS BH-17 | 0.00 | Very low |
| 5 | TS BH-21 | 6.71 | High |
| 6 | TS BH-25 | 25.69 | Very high |
The liquefaction potential analysis uses the scenario of the 2006 Yogyakarta earthquake of 6.3 Mw. If the magnitude of the earthquake is greater, the layers that liquefy will be greater as well. This will result in a decrease in the ultimate bearing capacity of the foundation [38].
CONCLUSION
The Pandansimo Bridge is located near the active Opak fault, with sandy soils and a shallow groundwater table, making the area susceptible to liquefaction hazards. The PGA value between 0.3 g and 0.49 g for each soil layer was obtained using the SSRA method, based on the 2006 Yogyakarta earthquake scenario of 6.3 Mw. Liquefaction calculation was carried out on the main span of Pandansimo Bridge with six borehole points, namely TS BH-1, TS BH-2, TS BH-3, TS BH-4, TS BH-5, TS BH-6. Liquefaction potential was found at TS BH-2 in a depth of 3 m to 8 m, TS BH-5 in 2 m to 6 m and 12 m to 14 m, as well as TS BH-6 in between 1 m to 6 m and 12 m to 16 m. For the other points, there was no liquefaction potential. The result of the analysis based on the LPI method shows a varying category from very low to very high. The analysis using the LPI method showed that borehole points with very low categories did not have liquefaction potential. In contrast, three boreholes with low, high, and very high categories showed indications of liquefaction in some layers.
The results of this study provide valuable information on the potential for earthquake-induced liquefaction in the coastal area of Yogyakarta that can be used as a reference for mitigation planning to reduce the impact on building damage during earthquakes.
This research can be applied to bridges with similar geological conditions, such as quaternary deposits with thick sand deposits, predominantly sandy soils, shallow groundwater levels, and locations close to the earthquake source, with a distance of less than 10 km. With similar risks, research can be developed using numerical approaches to assess liquefaction potential, such as pore water pressure ratio and calculation of bearing capacity foundation when liquefaction occurs.
Liquefaction potential analysis can help prioritize bridge reinforcement for mitigation if the bridge has already been built. Regular monitoring of soil conditions and bridge structure is necessary if liquefaction potential is detected. However, if the bridge has yet to be built, the analysis can influence the initial design to make it more resistant to liquefaction. If the potential is high and difficult to resolve, relocating the bridge to a more stable location may be an efficient alternative, compared to spending high costs for stabilization in liquefaction-prone areas.
AUTHORS' CONTRIBUTION
It is hereby acknowledged that all authors have accepted responsibility for the manuscript's content and consented to its submission. They have meticulously reviewed all results and unanimously approved the final version of the manuscript.
LIST OF ABBREVIATIONS
| FC | = Fine Content |
| SSRA | = Site-Specific Response Analysis |
| PGA | = Peak Ground Acceleration |
| CRR | = Cyclic Resistance Ratio |
| CSR | = Cyclic Stress Ratio |
| FS | = Safety Factor |
| LPI | = Liquefaction Potential Index |
| MSF | = Magnitude Scaling factor |
| GWL | = Groundwater Level |
AVAILABILITY OF DATA AND MATERIALS
The data supporting the findings of the article has been uploaded to Google Drive and can be accessed via the following link: https://drive.google.com/drive/folders/1dFGlVJmArn6Ymh1d0AYYrr6vTG2rq-bq?usp=sharing
FUNDING
This work was financially supported by Ministry of Public Works and Housing of Indonesia, Indonesia (grant number: 21310/UN1/FTK/DTSL/HK.08.00/2023).
ACKNOWLEDGEMENTS
We would like to express our gratitude to the National Road Implementation Agency (BBPJN) of Central Java – Special Region of Yogyakarta, especially the Unit Work of National Road Implementation (PJN) Special Region of Yogyakarta Province, for providing data and technical support for this research.


