All published articles of this journal are available on ScienceDirect.

The Impact of Intelligent Construction Technology on the Advancement of Prefabricated Buildings
 iD
Muhammad Isha Ismail3
iD
Noor Safwan Muhamad3
iD
Muhammad Azrief Azahar4
iD
Muhammad Noor Hisyam Jusoh1
iD
iD
Muhammad Isha Ismail3
iD
Noor Safwan Muhamad3
iD
Muhammad Azrief Azahar4
iD
Muhammad Noor Hisyam Jusoh1
iD
Authors Info & Affiliations
Abstract
Introduction
Prefabricated buildings have emerged as an important strategy for improving productivity, sustainability, and quality in the construction industry. Despite their recognized advantages, large-scale adoption remains constrained by technological, organizational, and institutional barriers. This study aims to investigate how intelligent construction technologies, including Building Information Modeling (BIM), the Internet of Things (IoT), automation, and Artificial Intelligence (AI), contribute to the advancement of prefabricated buildings.
Methods
A sequential mixed-method research design was employed. Semi-structured interviews were conducted with eight experts from academia, industry, and government to refine the conceptual framework and questionnaire items. A pilot study involving 100 respondents was then undertaken to assess the reliability and validity of the measurement instrument. Subsequently, 271 valid responses from construction professionals in China were analyzed using IBM SPSS Statistics and IBM SPSS AMOS through exploratory factor analysis, confirmatory factor analysis, correlation analysis, and multiple regression. The study was grounded in an integrated theoretical framework combining the Technology–Organization–Environment Framework, Diffusion of Innovations theory, and Institutional Theory.
Results
The findings indicate that awareness and perception, perceived benefits, adoption rates of intelligent construction technologies, and perceived challenges all have significant positive effects on the promotion of prefabricated buildings. The regression model explained 38.7% of the variance in promotion outcomes (Adjusted R2 = 0.387), with the adoption rate of intelligent construction technologies emerging as the strongest predictor based on standardized beta coefficients.
Discussion
The results demonstrate that intelligent construction technologies act as system-level enablers that enhance implementation capability, interdisciplinary collaboration, and institutional alignment. The positive effect of perceived challenges suggests that stakeholders who recognize barriers are more likely to undertake strategic planning, capacity building, and organizational adaptation. These findings provide a more nuanced understanding of how technological and institutional factors jointly influence the advancement of prefabricated buildings.
Conclusion
This study offers both theoretical and practical contributions by integrating three complementary theories into a unified explanatory model and by reconceptualizing perceived challenges as adaptive drivers rather than purely inhibiting factors. The findings provide empirical evidence from the Chinese construction industry and offer actionable insights for policymakers and industry practitioners seeking to accelerate the digital and sustainable transformation of prefabricated construction.
1. INTRODUCTION
Prefabricated buildings are increasingly recognized as a sustainable and industrialized approach to construction. By shifting component production to factory-controlled environments and assembling standardized modules on site, prefabrication improves quality, reduces waste, shortens construction time, and enhances occupational safety. Despite these advantages, widespread adoption remains limited due to high initial investment, fragmented supply chains, technical integration difficulties, and insufficient organizational capabilities.
Prefabricated buildings represent an industrialized construction approach characterized by standardized design, factory-based production, and on-site assembly [1]. With the advancement of digital technologies, such as Building Information Modeling (BIM), the Internet of Things (IoT), automation, and artificial intelligence, prefabricated construction has gained new opportunities for efficiency enhancement and quality control. Intelligent construction technologies enable information integration across the entire building life cycle, addressing long-standing challenges in traditional construction, including fragmented workflows, poor coordination, and resource inefficiency [2]. Their combined application supports real-time decision-making, improved coordination, and data-driven optimization.
Despite rapid policy-driven development, the construction industry, particularly in large-scale markets, such as China, continues to face structural problems including high labor intensity, low productivity, quality inconsistency, and environmental pressure [3, 4]. These challenges highlight the need to move beyond conventional prefabrication toward intelligent construction systems capable of supporting industrialized, data-driven, and sustainable development. However, the mechanisms through which intelligent construction technologies promote prefabricated buildings remain insufficiently theorized and empirically validated, motivating the present study [5]. This study addresses this gap by developing and validating an integrated theoretical framework.
2. LITERATURE REVIEW AND THEORETICAL FRAMEWORK
2.1. Intelligent Construction versus Conventional Digital Construction
Digital technology is the core technical means of social development. The application of digital technology is mainly relies on computer technology to analyze and process various types of information, enabling calculations through numbers to achieve efficient and accurate analysis and calculation [6]. Converting multi-source information into numbers and establishing a digital model is the basic process of applying digital technology across multiple industries. Intelligent construction refers to the process of virtual construction in the virtual world with the help of computers [3]. While many studies report that Building Information Modeling (BIM), automation, and related intelligent construction technologies improve coordination, reduce errors, and enhance project performance, other studies document implementation failures arising from organizational resistance, insufficient training, interoperability problems, and inadequate leadership support. These contrasting findings suggest that technological capability alone does not guarantee successful adoption. Instead, implementation outcomes depend on the interaction of technological readiness, organizational capacity, and institutional conditions. Factory processing, precision measurement and control, mechanized installation, and information management are the main features of intelligent construction; therefore, intelligent construction requires an intensive management model to support it [7]. To support this transformation, modular construction methods need to evolve to address diverse regional requirements and constraints, including regulatory frameworks, economic conditions, market demands, and building typologies [8]. The integration of digital technologies across the construction lifecycle forms a closed-loop intelligent construction ecosystem, as illustrated in Fig. (1).
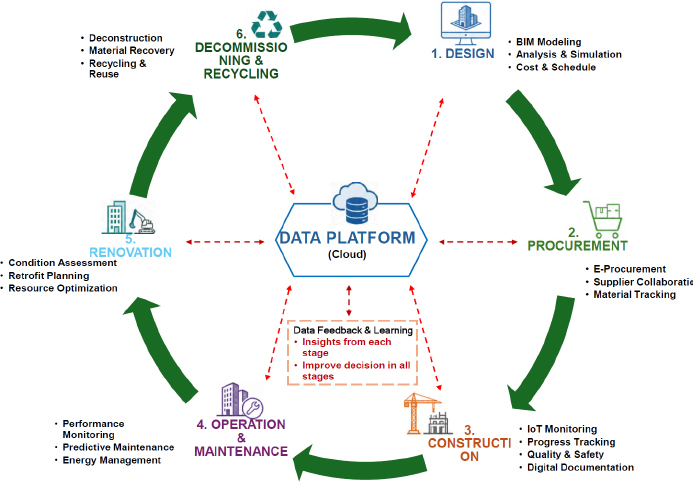
Landscape of the closed-loop smart construction.
The prefabricated building adopts a standardized design, and the building components are processed by the factory, transported to the construction site, and assembled by hoisting to form a whole [9]. The entire construction process is also known as building blocks, which are generally used for standard residences, office buildings, and large industrial plants [2]. The prefabricated building advocates the integrated construction of prefabrication, installation, and decoration. Its main advantages and characteristics are low work intensity, fast assembly speed, and environmental protection. The prefabricated building is supported by information technology and adopts modular design, standardized production, and lean assembly [10]. Different from traditional construction methods, prefabricated buildings have the characteristics of collaboration, integration, refinement, and dry construction in terms of design, construction, decoration, and management. According to different building materials, prefabricated buildings are mainly divided into three types of construction forms, namely prefabricated concrete, steel, and wooden structures. Each of the three types has its own advantages and forms a system. At present, prefabricated buildings are still in the promotion period [11]. Due to technical difficulties, high costs, and difficulties in ensuring rigidity and quality, prefabricated buildings have not yet been accepted by most small and medium-sized contractors. Other influential works are included in Table 1.
| Author/Refs | Research title | Remarks |
|---|---|---|
| Xia et al [12] | A comprehensive risk-assessment method for prefabricated buildings using EPC: A case study from China | Changes in government policies, a lack of a complete supply chain, and difficulty in timely communication among relevant personnel have led to low investor enthusiasm for prefabricated buildings. |
| Li et al [13] | SWOT analysis and Internet of Things-enabled platform for prefabrication housing production in Hong Kong | Industry stakeholders underestimated the potential savings in raw material consumption when using prefabricated technology. |
| Thurairajah et al [14] | Unexpected Challenges in the Modular Construction Implementation: Are UK Contractors Ready? | Through the analysis of two case studies in the UK, it is concluded that project delays, skill gaps, and reduced design flexibility pose significant challenges for the promotion of prefabricated buildings. |
| Wang [15] | Comparative analysis of modular construction practices in mainland China, Hong Kong and Singapore Research on the Barriers and Strategies to Promote Prefabricated Buildings in China |
The limitations on the development of prefabricated buildings include limited site conditions, outdated technology, and inefficient assembly management of prefabricated components. Meanwhile, joint research has found that technological factors account for the largest proportion of obstacles to the development of prefabricated buildings. |
| Mohammad et al [16] | The potential application of IBS modular system in the construction of housing scheme in Malaysia | The high initial cost and lack of technical expertise are the main obstacles to implementing modular systems in Malaysia. |
| Yuan et al [17] | Cause analysis of hindering on-site lean construction for prefabricated buildings and corresponding organizational capability evaluation | The lack of professional management ability of management personnel is the most critical obstacle to assembly-based promotion. |
| Zhang and Li [18] | Intelligent Construction Technology Adoption Driving Strategy in China: A Tripartite Evolutionary Game Analysis | The results indicate that the conditions under which each evolutionary stable strategy (ESS) emerges are primarily determined by the cost–benefit relationships among the stakeholders. In addition, owners are found to be more responsive to government subsidies and penalties than general contractors. Therefore, the government should implement a dynamic reward-and-penalty mechanism based on the model results to guide stakeholder behavior effectively. |
| Skibniewski et al [19] | The Present and Future of Smart Construction Technologies | Significant challenges remain in the transfer of smart construction technologies, and these issues warrant further research and development. Given the highly competitive nature of the construction industry, successful technology transfer depends on the availability of reliable and cost-effective solutions. |
These findings show that although the advantages of prefabricated buildings are recognized, recurring financial, technical, managerial, and policy-related barriers continue to impede their wider implementation. More importantly, most studies focus on isolated regional or sectoral issues without fully addressing how intelligent construction technologies, such as BIM, IoT, automation, and artificial intelligence, can systematically overcome these challenges, creating a clear gap for research on their role in optimizing prefabricated construction processes and promoting large-scale adoption.
2.2. Theoretical Framework Development
This study distinguishes intelligent construction from conventional digital construction by emphasizing lifecycle integration, cyber-physical connectivity, and data-driven decision-making. While conventional digital tools are often applied in isolated stages, intelligent construction combines BIM, IoT, automation, and artificial intelligence into a closed-loop ecosystem.
The theoretical foundation integrates:
(1) Technology–Organization–Environment (TOE) Framework;
(2) Diffusion of Innovations (DOI) Theory; and
(3) Institutional Theory.
Awareness and perception represent organizational cognition and innovation attributes. Perceived benefits capture relative advantage. Adoption rates reflect technological readiness and implementation capability. Perceived challenges represent institutional and organizational pressures that may stimulate adaptive responses. The dependent variable is the Promotion Path of Prefabricated Buildings (PPPB).
2.3. Research Gap
Existing studies largely focus on isolated barriers, regional case studies, or single technologies [20]. Limited research has empirically investigated how multiple dimensions of intelligent construction jointly influence the advancement of prefabricated buildings through technological, organizational, and institutional mechanisms. This study addresses this gap by developing and testing an integrated theoretical model. Moreover, comparative theoretical integration remains underdeveloped. This study addresses these gaps by proposing and empirically validating a theoretically grounded promotion model [21]. There are no relevant cases or practices, and there is a lack of verification of the impact of intelligent technology on the efficiency and quality of prefabricated buildings. In discussing the progress of previous research on the combination of building informatization and industrialization [22]. It does not combine successful application cases of Internet technology in the construction industry, especially research on BIM, the Internet of Things, big data, and other technologies in the field of prefabricated buildings [23]. As for the demand for personalized building customization, there are very few previous studies on whether the demand for personalized building customization under the background of new building industrialization is involved. Most importantly, previous studies rarely pointed out the disconnection between architecture itself and construction, especially the alienation of architecture into the pursuit of form, while ignoring the actual feasibility and efficiency in the construction process. is rarely mentioned.
Based on the current status of related research in China and abroad, it can be found that research mainly focuses on the application of intelligent construction to engineering project construction, or on the adoption of intelligent construction based on information means. There are very few studies on the in-depth intelligent construction system and system rationality evaluation of the assembly life cycle. Based on the above research conclusions, this study aims to conduct in-depth research and exploration on the intelligent construction management of prefabricated buildings by combining the current development status of intelligent construction technology and the particularity of the construction process of prefabricated buildings.
3. RESEARCH METHODOLOGY
A mixed-method research design was adopted, integrating qualitative expert interviews and quantitative survey analysis. The study was grounded in the Technology-Organization-Environment (TOE) framework, Diffusion of Innovations (DOI) theory, and Institutional Theory. Semi-structured interviews with industry experts were conducted to inform questionnaire development, followed by a survey of 271 construction professionals. Data were analyzed using SPSS and AMOS through exploratory factor analysis, confirmatory factor analysis, correlation analysis, and multiple regression modeling.
3.1. Research Design
The research design aspect of this study incorporates both qualitative and quantitative approaches, with the aim of ensuring that a comprehensive analysis of the application, development, and promotion of new prefabricated buildings from the perspective of intelligent construction is provided. In this manner, the research design method and approach allow for a holistic and complete understanding of the data gathered and the insights generated from it. Figure 2 shows the research framework to be followed in the study.
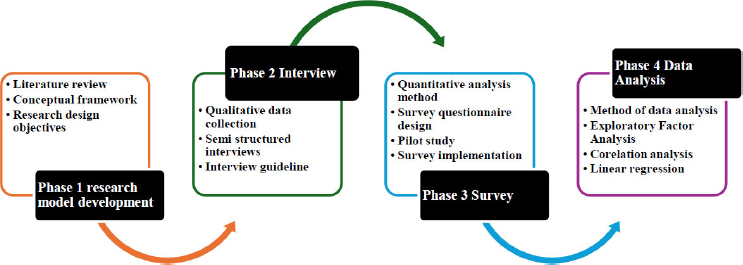
Research development flow.
3.2. Qualitative and Quantitative Analysis Methods
3.2.1. Qualitative Phase
Eight experts from academia, industry, and government participated in semi-structured interviews. Purposeful sampling was used to ensure representation from key stakeholder groups. Interview data were analyzed thematically and used to refine questionnaire items and validate the conceptual model. The interviewees were asked about their specific experiences and examples or cases where they had or had not used intelligent technologies with prefabricated buildings. They were also asked to provide detailed descriptions of successful projects they had taken part in that involved intelligent technologies and the kinds of technologies they had used. The interviewees were asked for insights they might have into the development process and the possible integration of intelligent construction techniques and methods within the prefabricated buildings industry. They were also asked about some of the challenges and barriers they faced, and the solutions they suggested and implemented during their intelligent construction projects. Finally, the interviewees were asked about any recommendations they had suggested for overcoming the barriers and promoting wider adoption of technologies.
3.2.2. Quantitative Analysis Method
The quantitative analysis method refers to setting up mathematical models based on data and analyzing the indicators and values of the researched objects. It is mainly used to study quantitative characteristics, connections, and changes of research objects.
3.2.3. Survey Questionnaire Design
Before designing a questionnaire, it is crucial to identify the independent and dependent variables, which serve as essential components in analyzing the growth and advancement of smart prefabricated buildings. A questionnaire, described as a structured tool for gathering responses, typically includes a series of questions that respondents answer either by selecting predefined options or providing written replies [24]. To achieve the study's objectives effectively, the questionnaire must be thoughtfully crafted and directly relevant to the research goals.
3.2.4. Pilot Study
A pilot study serves as an initial investigation aimed at evaluating the feasibility and validity of a questionnaire's design [25]. For this study, A pilot survey involving 100 respondents was conducted to assess item clarity, reliability, and construct validity. Two problematic items (AP4 and AR3) were removed based on low corrected item-total correlations and weak factor loadings shown in Table 2. The following aspects were examined:
- Identification of unnecessary questions to be removed in the main study.
- Evaluation of whether responses align with the required information.
- Determination of whether the questions offer a sufficient range of answers.
- Examination of whether the questionnaire needed to be shortened or revised.
- Based on these findings, the feedback from construction professionals was incorporated, and minor adjustments were made to refine the final questionnaire.
| Factors | Item | CITC | CAID | Cronbach's Alpha |
|---|---|---|---|---|
| Awareness and perception | AP1 | 0.59 | 0.512 | 0.665 |
| AP2 | 0.55 | 0.528 | ||
| AP3 | 0.61 | 0.491 | ||
| AP4 | 0.156 | 0.817 | ||
| Benefits | B1 | 0.762 | 0.91 | 0.921 |
| B2 | 0.819 | 0.898 | ||
| B3 | 0.811 | 0.9 | ||
| B4 | 0.783 | 0.906 | ||
| B5 | 0.803 | 0.902 | ||
| Adoption rates | AR1 | 0.729 | 0.718 | 0.792 |
| AR2 | 0.762 | 0.704 | ||
| AR3 | -0.079 | 0.914 | ||
| AR4 | 0.708 | 0.722 | ||
| AR5 | 0.752 | 0.712 | ||
| AR6 | 0.703 | 0.723 | ||
| Perceived challenges | PC1 | 0.774 | 0.89 | 0.910 |
| PC2 | 0.776 | 0.89 | ||
| PC3 | 0.799 | 0.885 | ||
| PC4 | 0.72 | 0.902 | ||
| PC5 | 0.797 | 0.886 | ||
| Promotion path of prefabricated buildings | PPPB1 | 0.761 | 0.831 | 0.877 |
| PPPB2 | 0.719 | 0.848 | ||
| PPPB3 | 0.758 | 0.833 | ||
| PPPB4 | 0.702 | 0.855 | ||
| Total factor reliability | 0.927 | |||
3.2.5. Main Survey
The finalized questionnaire consisted of 22 items measured using a five-point Likert scale. A total of 271 valid responses were obtained through professional networks, industry conferences, and the WJX.cn online platform. Some of the sections covered by the survey include the following:
- The demographic information of the respondents, for example, job role, years of experience, region, and training expertise.
- The awareness and perception of the respondent with respect to intelligent prefabricated buildings.
- The existing current use and implementation methods and strategies of intelligent technologies in their respective projects or areas of expertise.
- The benefits and challenges as perceived by the respondents in association with the technologies.
- Their suggestions for new strategies that might help promote the adoption of prefabricated buildings that are done using intelligent construction methods.
3.2.6. Data Analysis
The data collected from the questionnaire were statistically analyzed using the Statistical Package for Social Sciences (SPSS) and the Analysis of Moment Structures (AMOS), which are widely used statistical analysis software by scholars. The analytical procedures included reliability analysis, exploratory factor analysis, confirmatory factor analysis, correlation analysis, and multiple linear regression.
4. RESULTS AND DISCUSSION
4.1. Interview Analysis
Semi-structured interviews were conducted with eight experts from academia, industry, and government agencies. The interviews were used to refine the conceptual framework, validate the questionnaire items, and ensure the practical relevance of the constructs. Upon thematic analysis of the interviews, the following key themes were revealed.
4.1.1. Technological Integration
Technological integration plays a crucial role in improving the efficiency and performance of prefabricated construction.
(1) The industry experts highlighted that it was very important to integrate BIM, IoT, and automation into prefabricated construction to achieve significant improvements in efficiency and quality. By leveraging these technologies, companies can streamline their design and construction processes, reduce errors, and further enhance collaboration among project stakeholders. This will lead to cost savings and improved project completion timeliness.
(2) It was also noted that successful projects often involved a completely holistic approach. This is to say that they involved a combination of multiple intelligent technologies to optimize the entire construction process. This can include the use of artificial intelligence that can aid in predictive modeling, drones for site surveys and topography, and IoT sensors for real-time monitoring of the work.
(3) One example of a successful project shared by interviewees was a residential complex built using modular construction, and another was a commercial building built with 3D-printed components. This use of modular construction and 3D-printed components showcased the potential for future advancements and adoption of prefabricated buildings from the perspective of intelligent construction.
(4) These projects are a testament to the potential of intelligent technologies to deliver high-quality, cost-effective, and sustainable buildings.
4.1.2. Challenges and Solutions
The adoption of intelligent technologies in prefabricated construction presents several challenges that require effective solutions.
(1) The most common challenge the experts identified was the high initial investment necessary for the adoption of prefabricated buildings from the perspective of intelligent construction. This came up before other challenges, like the necessary skilled labor to operate the technologies.
(2) The solutions proposed included a phased implementation strategy for the technologies, focusing first on high-impact areas and then investing in training programs that would build the capacity of a skilled workforce to undertake these projects in construction.
4.1.3. Strategic Recommendations
The findings highlight key strategic recommendations for promoting intelligent prefabricated construction.
(1) A major recommendation from experts was to increase collaboration between industry stakeholders to develop standardized practices and share knowledge. In so doing, this will help streamline processes, improve efficiency, and ultimately benefit the entire construction industry. Working together will also help stakeholders address common challenges and issues and better find innovative solutions.
(2) It was deemed critical and necessary to have government support in the form of incentives and policy frameworks towards prefabricated buildings from the perspective of intelligent construction. These measures will help drive innovation and investment in the industry from both the private and public sectors.
(3) Another strategic recommendation was continuous innovation and research to help overcome technical challenges and support advancements in the field. This emphasis on innovation and research underscores the dynamic nature of the construction industry, where ongoing solutions are needed to expand industry capabilities and drive continuous progress.
4.2. Data Analysis of Pilot Study
4.2.1. Reliability Analysis
The data from the pilot study was analyzed using SPSS 24.0 to identify and eliminate low-quality items, thereby enhancing the scale's discrimination and ensuring the internal consistency of its items. The results are shown in Table 2.
A reliability analysis was conducted on the measurement items associated with five variables: awareness and perception, benefits, technology adoption rate, perceived challenges, and the promotion path of prefabricated buildings. The results indicate that three variables, benefits, perceived challenges, and promotion path, demonstrate high reliability, with Cronbach's alpha coefficients exceeding 0.8. However, two variables, awareness and perception (Cronbach's α = 0.665) and technology adoption rate (Cronbach's α = 0.792), exhibit issues. Specifically, the Corrected Item-Total Correlation (CITC) value for one item is significantly below the standard threshold (CITC = 0.5).
Further analysis of the “Cronbach's Alpha if Item Deleted” values reveals that removing the fourth item (AP4) from the Awareness and Perception factor would increase the Cronbach's alpha coefficient for this factor from 0.665 to 0.817. Similarly, deleting the third item (AR3) from the Technology Adoption Rate factor would elevate Cronbach’s alpha coefficient from 0.792 to 0.914. The study must integrate these findings with the results of the validity analysis to determine whether these two items should be removed to enhance the overall quality and internal consistency of the questionnaire.
4.2.2. Validity Analysis
Before conducting the validity test, this study first used SPSS24.0 to conduct KMO and Bartlett's sphericity test on the five variables in the data set. The data analysis results are shown in Table 3.
| Kaiser-Meyer-Olkin Measure of Sampling Adequacy | 0.899 | |
| Bartlett's test of sphericity | Approx. Chi-Square | 1635.044 |
| df | 276 | |
| Sig. | <0.001 | |
The overall Kaiser-Meyer-Olkin (KMO) value for the dataset is 0.899, which exceeds the acceptable threshold of 0.7, indicating sampling adequacy for factor analysis. Additionally, Bartlett's test of sphericity yielded an approximate chi-square value of 1635.044, which is statistically significant at the 0.000 level. These results confirm that the dataset is suitable for factor analysis.
As shown in the Scree Plot in Fig. (3), among the 24 items analyzed, five items have eigenvalues greater than 1, with their cumulative variance explaining more than 70.67% of the total variance. This suggests that the dataset is appropriate for factor analysis and that all items can be grouped into five factors, aligning with the theoretical expectations of this study.
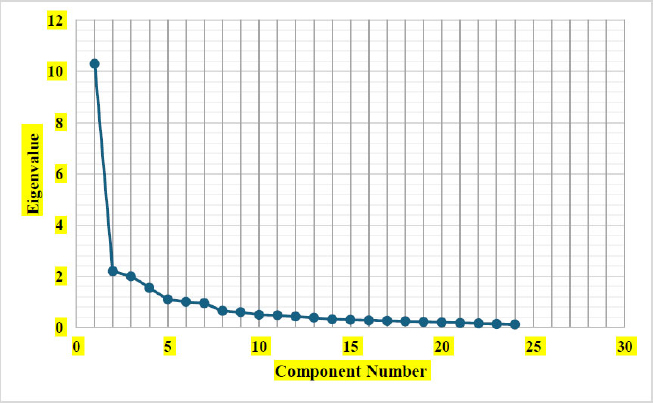
Scree Plot before questionnaire revision.
Consequently, a combination of exploratory factor analysis (EFA) and confirmatory factor analysis (CFA) was employed to assess the validity of the measurement model. The rotated component matrix is presented in Table 4.
| Item | Factor 1 | Factor 2 | Factor 3 | Factor 4 | Factor5 | Extraction |
|---|---|---|---|---|---|---|
| AP1 | - | - | - | - | 0.586 | 0.676 |
| AP2 | - | - | - | - | 0.509 | 0.567 |
| AP3 | - | - | - | - | 0.514 | 0.700 |
| AP4 | - | - | - | - | - | 0.321 |
| B1 | 0.763 | - | - | - | - | 0.715 |
| B2 | 0.824 | - | - | - | - | 0.788 |
| B3 | 0.818 | - | - | - | - | 0.798 |
| B4 | 0.843 | - | - | - | - | 0.767 |
| B5 | 0.802 | - | - | - | - | 0.793 |
| AR1 | - | - | 0.789 | - | - | 0.78 |
| AR2 | - | - | 0.731 | - | - | 0.749 |
| AR3 | - | - | - | - | 0.504 | 0.346 |
| AR4 | - | - | 0.726 | - | - | 0.703 |
| AR5 | - | - | 0.724 | - | - | 0.767 |
| AR6 | - | - | 0.797 | - | - | 0.783 |
| PC1 | - | 0.819 | - | - | - | 0.759 |
| PC2 | - | 0.761 | - | - | - | 0.759 |
| PC3 | - | 0.771 | - | - | - | 0.773 |
| PC4 | - | 0.749 | - | - | - | 0.666 |
| PC5 | - | 0.741 | - | - | - | 0.769 |
| PPPB1 | - | - | - | 0.795 | - | 0.760 |
| PPPB2 | - | - | - | 0.803 | - | 0.746 |
| PPPB3 | - | - | - | 0.797 | - | 0.764 |
| PPPB4 | - | - | - | 0.799 | - | 0.712 |
| Cumulative % | 70.67 | |||||
In the exploratory factor analysis, principal component analysis was employed to extract factors from the questionnaire scale. The results identified five components with eigenvalues greater than 1, with the largest principal component accounting for 44.531% of the variance. Collectively, the 5 principal components explained 70.67% of the total variance.
As shown in the results, while some cross-loading was observed among the measurement items for each variable, the rotated principal components generally aligned with the predefined variables, except for the fourth item of factor 5 (AP4) and the third item of factor 3 (AR3). This finding corroborates the earlier reliability analysis, which recommended the removal of these two items. Overall, the results suggest that the scale under evaluation demonstrates strong reliability and validity.
4.2.3. Results After Questionnaire Revised
To verify the quality and internal consistency of the questionnaire after review, this study collected data from 100 respondents and used SPSS 24.00 to conduct reliability and validity analysis. The results of the reliability analysis are shown in Table 5.
| Cluster Factors | Item | Corrected Item-Total Correlation | Cronbach's Alpha if Item Deleted | Cronbach's Alpha |
|---|---|---|---|---|
| Awareness and perception | AP1 | 0.659 | 0.761 | 0.817 |
| AP2 | 0.642 | 0.780 | ||
| AP3 | 0.713 | 0.704 | ||
| Adoption rates | AR1 | 0.796 | 0.892 | 0.914 |
| AR2 | 0.791 | 0.894 | ||
| AR4 | 0.740 | 0.903 | ||
| AR5 | 0.791 | 0.893 | ||
| AR6 | 0.790 | 0.893 | ||
| Total factor reliability | 0.944 | |||
After removing the items with significant abnormalities identified in the previous analysis, the reliability of the dataset improved significantly, meeting all required indicators. Specifically, the Cronbach's alpha coefficient for the “Awareness and Perception” factor increased from 0.665 to 0.817, while the coefficient for the “Adoption Rates” factor rose from 0.792 to 0.914. Notably, the overall reliability of the questionnaire also improved, with Cronbach’s alpha increasing from 0.927 to 0.944. These results further confirm that the questionnaire demonstrates excellent reliability.
The data analysis results, as presented in Table 6, indicate that the KMO coefficient increased from 0.899 to 0.909 and remained statistically significant at the 0.000 level. These findings confirm that the revised questionnaire remains highly suitable for factor analysis and exhibits improved internal consistency. Additionally, the rotated component matrix demonstrates a clear delineation of factors, as illustrated in Table 7.
| Kaiser-Meyer-Olkin measure of sampling adequacy | 0.909 | |
| Bartlett's test of sphericity |
Approx. chi-square | 1597.778 |
| df | 231 | |
| Sig. | <0.001 | |
| Item | Factor 1 | Factor 2 | Factor 3 | Factor 4 | Factor 5 | Extraction |
|---|---|---|---|---|---|---|
| AP1 | - | - | - | - | 0.784 | 0.779 |
| - | - | - | - | - | - | |
| AP2 | - | - | - | - | 0.63 | 0.633 |
| AP3 | - | - | - | - | 0.724 | 0.754 |
| B1 | 0.727 | - | - | - | - | 0.716 |
| B2 | 0.815 | - | - | - | - | 0.797 |
| B3 | 0.844 | - | - | - | - | 0.826 |
| B4 | 0.801 | - | - | - | - | 0.761 |
| B5 | 0.799 | - | - | - | - | 0.788 |
| AR1 | - | - | 0.789 | - | - | 0.778 |
| AR2 | - | - | 0.739 | - | - | 0.754 |
| AR4 | - | - | 0.726 | - | - | 0.701 |
| AR5 | - | - | 0.734 | - | - | 0.77 |
| AR6 | - | - | 0.796 | - | - | 0.784 |
| PC1 | - | 0.811 | - | - | - | 0.769 |
| PC2 | - | 0.774 | - | - | - | 0.755 |
| PC3 | - | 0.752 | - | - | - | 0.771 |
| PC4 | - | 0.764 | - | - | - | 0.696 |
| PC5 | - | 0.792 | - | - | - | 0.806 |
| PPPB1 | - | - | - | 0.781 | - | 0.762 |
| PPPB2 | - | - | - | 0.797 | - | 0.749 |
| PPPB3 | - | - | - | 0.789 | - | 0.765 |
| PPPB4 | - | - | - | 0.812 | - | 0.743 |
| Cumulative % | 75.721 | |||||
The revised questionnaire demonstrates a clear factor structure in the rotated component matrix, with all items exhibiting factor loading coefficients above 0.5. This indicates a strong correlation among items within the same factor and high discrimination between different factors. Furthermore, the cumulative variance explained by the principal components increased from 70.67% to 75.721%, suggesting that the five principal components account for 75.721% of the total variance. These results confirm that the factor structure of the questionnaire is both reasonable and of high quality.
4.3. Final Data Analysis
Based on the pilot survey results, the Likert scale questionnaire was reviewed, and 271 respondents were invited to complete the questionnaire. The respondents constituted experts, scholars, enterprises, engineers, relevant government departments, and regulatory agencies. The questionnaire was divided into two parts. The first part included questions designed to understand the respondents’ basic information, such as work experience, educational background, professional type, and job title. The second part of the questionnaire was on the intelligent construction research status of prefabricated buildings based on BIM. Respondents used the 5-point scale method, due to its practicality, to compare the importance of each criterion.
4.3.1. Descriptive Statistics
The basic information specific to the respondents is shown in Table 8. It is important to know that the experts have more than 4 years’ experience in their fields, hence improving the accuracy of the results.
| Characteristic | Variable | Frequency | Percent |
|---|---|---|---|
| Work content | Research institution | 46 | 17% |
| University | 39 | 14.4% | |
| Government department | 48 | 17.7% | |
| Regulatory agency | 25 | 9.2% | |
| Construction unit | 46 | 17% | |
| Supply manufacturer | 34 | 12.5% | |
| Design unit | 33 | 12.2% | |
| Educational background | Less than bachelor degree | 85 | 31.4% |
| Undergraduate degree | 134 | 49.4% | |
| Postgraduate degree | 34 | 12.5% | |
| Doctoral degree and higher | 18 | 6.6% | |
| Work experience | < 1 year | 52 | 19.2% |
| 1-4 years | 118 | 43.5% | |
| 4-10 years | 78 | 28.8% | |
| >10 years | 23 | 8.5% | |
| Professional | Architect | 43 | 15.9% |
| Quantity surveyor | 46 | 17% | |
| Civil engineer | 29 | 10.7% | |
| Electrical engineer | 49 | 18.1% | |
| Mechanical engineer | 51 | 18.8% | |
| Construction management | 28 | 10.3% | |
| Project management | 25 | 9.2% |
The survey results presented in Table 8 provide valuable insights into the demographic profile of respondents involved in the research on smart building and prefabricated construction practices. The study surveyed 271 participants from various organizations within the construction industry. Of these, 17% were affiliated with research institutions, 14.4% with universities, 17.7% with government departments, 17% with construction firms, 12.5% with supply manufacturers, and 12.2% with design firms. Regulatory bodies were the least represented, comprising 9.2% of the sample. This diverse distribution of participants across multiple sectors was intentionally designed to minimize sample bias and enhance the reliability of the findings, thereby facilitating a comprehensive understanding of trends in the adoption and development of smart construction practices within the context of prefabricated buildings.
The educational background of the respondents indicates a predominantly high level of academic attainment, with 68.6% having completed undergraduate or higher education. Among these, 49.4% hold an undergraduate degree, 12.5% possess a master's degree, and 6.6% have attained a doctoral or equivalent level of education. Conversely, 31.4% of respondents reported an education level below undergraduate. The high proportion of respondents with advanced education suggests that the study draws on insights from highly qualified professionals, thereby enhancing the credibility of the research findings. However, it is important to acknowledge that this educational profile may introduce a potential bias, favoring academic or theoretical perspectives over practical viewpoints.
A notable aspect of the respondent profile is their extensive experience with smart construction practices. Most of the participants have at least one year of experience in this field, with 28.8% reporting 4-10 years of experience and 8.5% having over 10 years. This high level of expertise, particularly in Building Information Modeling (BIM), represents a significant strength of the study, as it ensures that the data collected reflects insights grounded in practical, real-world applications. The respondents' depth of experience provides a robust foundation for analyzing the challenges, benefits, and potential advancements associated with adopting smart construction technologies in prefabricated building projects.
It is important to recognize that the composition of this sample presents both advantages and limitations. The high levels of education and work experience in smart construction among participants may limit the generalizability of the findings across the broader construction industry, thereby introducing a potential bias. This bias arises from the exclusive focus on the concept and application of smart construction technology. Future research should consider employing a more diverse sample in terms of age, accumulated experience, and educational background to obtain a more comprehensive understanding of the industry. Nonetheless, the current sample appears adequate for a qualitative study aimed at gathering respondents' perspectives and analyzing their qualitative attributes, particularly in relation to the present status and prospective developments of smart construction within the context of prefabricated buildings.
As shown in Table 9, the confirmatory factor analysis (CFA) results demonstrate a good fit between the proposed measurement model and the observed data. The CMIN/DF ratio was 1.039, which is below the recommended threshold of 3.0. The values of GFI (0.937), CFI (0.998), and NFI (0.942) exceeded the recommended threshold of 0.90, indicating satisfactory to excellent model fit. In addition, the RMSEA (0.012) and RMR (0.042) values were below the recommended thresholds of 0.08 and 0.05, respectively. Overall, all are good of fit indicates satisfied the recommended criteria, confirming that the measurement model demonstrates an acceptable and robust fit and is suitable for subsequent analysis.
| Index | CMIN | DF | CMIN/DF | GFI | RMSEA | RMR | CFI | NFI |
|---|---|---|---|---|---|---|---|---|
| Criterion | - | - | <3 | >0.9 | <0.08 | <0.05 | >0.9 | >0.9 |
| Model | 206.74 | 199 | 1.039 | 0.937 | 0.012 | 0.042 | 0.998 | 0.942 |
4.3.2. Confirmatory Factor Analysis (CFA)
Confirmatory factor analysis primarily evaluates structural validity by assessing the model fit, which reflects the overall adequacy of the proposed model. Convergent validity of the scale is determined by examining the factor loading coefficients, composite reliability (CR) values, and average variance extracted (AVE) values. Discriminant validity is assessed by comparing the arithmetic square root of the AVE value with the correlations among the constructs.
The theoretical model developed in this study identifies the promotion path of prefabricated buildings (PPPB) as the dependent variable, while awareness and perception (AP), benefits (B), adoption rates (AR), and perceived challenges (PC) are designated as independent variables. Specifically, awareness and perception (AP) comprises three measurement items, while benefits (B), perceived challenges (PC), and technology adoption rate (AR) each include five measurement items. The promotion path of prefabricated buildings (PPPB) is measured through four items, resulting in a total of 22 observable variables. To perform confirmatory factor analysis on the scale, AMOS software was utilized to construct the confirmatory factor analysis model, as illustrated in Fig. (4), and the corresponding calculation results were generated.
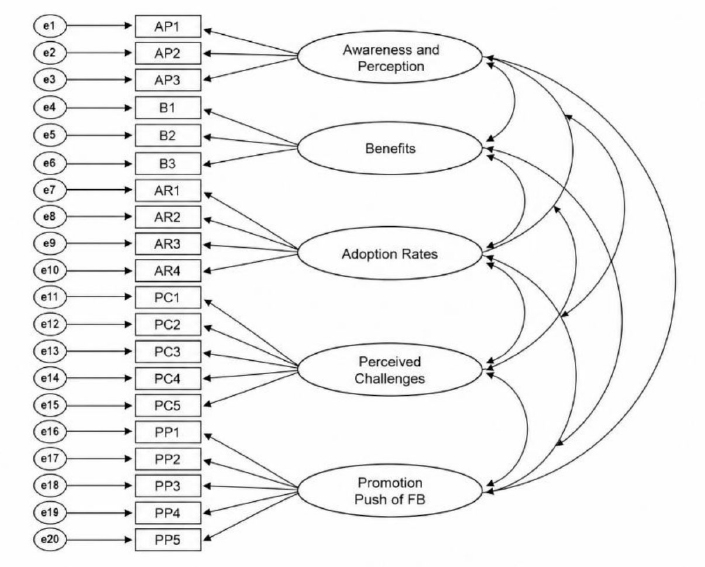
The model of confirmatory factor analysis.
Reliability and validity results confirmed strong psychometric properties. All constructs achieved Cronbach's alpha values above 0.80 after revision. Composite reliability values exceeded 0.70 and average variance extracted exceeded 0.50. The confirmatory factor analysis demonstrated excellent model fit (CMIN/DF = 1.039, RMSEA = 0.012, CFI = 0.998, GFI = 0.937).
Following the verification of the structural validity through the fit index test, the factor loading coefficients, composite reliability (CR), and average variance extracted (AVE) values were analyzed to assess the convergent validity of the scale. The results of the factor loading coefficient and CR value test are presented in Table 10. All factor loading coefficients exceed 0.5, meeting the standard, indicating that each item demonstrates a strong capacity to explain its respective variable. The composite reliability (CR) is greater than 0.7, meeting the standard and reflecting a high level of internal consistency within the scale. Additionally, the average variance extracted (AVE) value is above 0.5, meeting the required threshold and confirming that all items within a given variable effectively explain the construct. These results confirm that the convergent validity of the scale in this study is excellent.
| Route | Estimate | S.E. | C.R. | P | CR | AVE | ||
|---|---|---|---|---|---|---|---|---|
| AP3 | <--- | Awareness and perception | 0.759 | - | - | - | 0.83 | 0.62 |
| AP2 | <--- | Awareness and perception | 0.801 | 0.085 | 12.138 | *** | ||
| AP1 | <--- | Awareness and perception | 0.807 | 0.084 | 12.193 | *** | ||
| B5 | <--- | Benefits | 0.786 | - | - | - | 0.89 | 0.61 |
| B4 | <--- | Benefits | 0.755 | 0.07 | 12.953 | *** | ||
| B3 | <--- | Benefits | 0.794 | 0.07 | 13.735 | *** | ||
| B2 | <--- | Benefits | 0.787 | 0.07 | 13.602 | *** | ||
| B1 | <--- | Benefits | 0.798 | 0.072 | 13.825 | *** | ||
| AR5 | <--- | Adoption rates | 0.809 | - | - | - | 0.9 | 0.64 |
| AR4 | <--- | Adoption rates | 0.786 | 0.067 | 14.205 | *** | ||
| AR3 | <--- | Adoption rates | 0.826 | 0.067 | 15.16 | *** | ||
| AR2 | <--- | Adoption rates | 0.799 | 0.064 | 14.514 | *** | ||
| AR1 | <--- | Adoption rates | 0.776 | 0.066 | 13.964 | *** | ||
| PC5 | <--- | Perceived challenges | 0.755 | - | - | - | 0.89 | 0.62 |
| PC4 | <--- | Perceived challenges | 0.774 | 0.081 | 12.745 | *** | ||
| PC3 | <--- | Perceived challenges | 0.816 | 0.079 | 13.483 | *** | ||
| PC2 | <--- | Perceived challenges | 0.8 | 0.079 | 13.2 | *** | ||
| PC1 | <--- | Perceived challenges | 0.79 | 0.078 | 13.033 | *** | ||
| PPPB4 | <--- | Promotion path of prefabricated buildings | 0.783 | - | - | - | 0.87 | 0.62 |
| PPPB3 | <--- | Promotion path of prefabricated buildings | 0.799 | 0.078 | 13.485 | *** | ||
| PPPB2 | <--- | Promotion path of prefabricated buildings | 0.778 | 0.077 | 13.095 | *** | ||
| PPPB1 | <--- | Promotion path of prefabricated buildings | 0.802 | 0.08 | 13.538 | *** | ||
The preceding analysis demonstrated that the model fit met the required standards, with the overall model fit being high, and that both the structural validity and convergent validity of the measurement scale were satisfactory. Furthermore, it is essential to test the discriminant validity of the scale to ensure its robustness.
As presented in Table 11, the diagonal values represent the square roots of the average variance extracted (AVE), while the off-diagonal values represent the correlation coefficients between the variables. The results indicate that the square root of the AVE for each variable exceeds the correlation coefficients between that variable and the others, suggesting that the within-construct correlation is stronger than its correlation with other variables. This finding demonstrates that the scale exhibits strong discriminant validity. Moreover, the results reveal significant positive correlations between the variables, with no evidence of multicollinearity issues.
| AP | B | AR | PC | PPPB | |
|---|---|---|---|---|---|
| AP | 0.787 | - | - | - | - |
| B | 0.473 | 0.781 | - | - | - |
| AR | 0.415 | 0.490 | 0.800 | - | - |
| PC | 0.432 | 0.500 | 0.463 | 0.787 | - |
| PPPB | 0.545 | 0.520 | 0.543 | 0.539 | 0.620 |
| AVE | 0.620 | 0.610 | 0.640 | 0.620 | -- |
Note: ** The numbers on the diagonal line are the square root of AVE (**p<0.001).
4.3.3. Correlation Analysis
Correlation analysis is a statistical method employed to examine the relationships between two or more variables. It allows for the exploration of the strength and direction of the associations between variables. In this study, SPSS version 24 was utilized to compute and examine the correlations among the various variables, as well as to assess the strength and direction of these relationships. The absolute value of the correlation coefficient indicates the strength of the association, with values closer to 1 signifying a stronger correlation. This study adopts the following thresholds for interpretation: a correlation coefficient below 0.3 indicates a weak or negligible correlation; a coefficient between 0.3 and 0.6 suggests a moderate correlation; and a coefficient above 0.6 indicates a strong correlation. A positive correlation coefficient reflects a direct relationship between the variables, while a negative coefficient indicates an inverse relationship. The results of the correlation analysis are presented in Table 12.
| AP | B | AR | PC | PPPB | |
|---|---|---|---|---|---|
| AP | 1 | - | - | - | - |
| B | 0.410** | 1 | - | - | - |
| AR | 0.357** | 0.437** | 1 | - | - |
| PC | 0.371** | 0.450** | 0.415** | 1 | - |
| PPPB | 0.461** | 0.454** | 0.479** | 0.474** | 1 |
Note: ** Correlation is significant at the 0.01 level (2-tailed).
The correlation analysis results indicate that significant relationships exist between awareness and perception (AP), benefits (B), adoption rate of smart technology (AR), perceived challenges (PC), and the promotion path of prefabricated buildings (PPPB). Notably, the Pearson correlation coefficient between the promotion path of prefabricated buildings (PPPB) and the adoption rate of smart technology (AR) is the highest at 0.479, with a significance level of 0.01, suggesting a moderate positive correlation between these two variables. The correlation coefficients between the promotion path of prefabricated buildings (PPPB) and awareness and perception (AP), benefits (B), and perceived challenges (PC) are 0.461, 0.454, and 0.474, respectively, all of which are statistically significant at the 0.01 level. These results indicate that each of these variables is positively correlated with the promotion path of prefabricated buildings, with similar strengths of association.
4.3.4. Linear Regression
Multiple regression analysis is a statistical technique used to examine the relationship between a dependent variable and multiple independent variables. The fundamental concept behind this method is that, while a strict, deterministic functional relationship between the independent and dependent variables may not exist, it is possible to identify the mathematical model that best represents the nature of their relationship. The specific form of the model is presented as follows (Eq. 1):
Y = β0 + β1X1 + β2X2 + … + βnXn + ϵ (1)
Where:
β0: Intercept (value of Y when X is zero)
β1,β2,…,βn: Coefficients for each independent variable
ϵ: Error terms, representing random noise or variation not captured by the model.
In multiple linear regression, the objective is to determine the optimal coefficient estimates that minimize the discrepancy between the observed values and the predicted values generated by the model. The most widely used approach for achieving this is the least squares method, which identifies the optimal coefficient estimates by minimizing the sum of the squared residuals. This procedure can be carried out using SPSS version 24.0.
The results of the linear regression analysis are presented in Table 13. The regression model explains 38.7% of the variance in the promotion path of prefabricated buildings (Adjusted R2 = 0.387). This level of explanatory power is moderate and indicates that the four constructs capture important determinants of adoption, while also suggesting that additional contextual variables may influence implementation outcomes. Among the predictors, the adoption rate of intelligent construction technologies exhibited the largest standardized β coefficient, indicating that implementation capability is the strongest predictor within the current model. The standard error is 3.238, representing the average deviation between the predicted and actual values. The F statistic is 43.543, the Durbin-Watson statistic is 1.852, and the p-value is < 0.001, all of which indicate that the model is statistically significant, suggesting that at least one independent variable has a significant impact on the dependent variable. These findings demonstrate that the four selected factors play a critical role in the promotion path of smart prefabricated buildings (PPPB).
| Model | R | R Square | Adjusted R2 | Std. Error of the Estimate | Durbin-Watson | F | Sig. |
|---|---|---|---|---|---|---|---|
| 1 | 0.629a | 0.396 | 0.387 | 3.238 | 1.852 | 43.534 | 0 |
Note:aPredictors: (Constant), PC, AP, AR, B.
The ANOVA shown in Table 14 presents the results of the analysis of variance, which is used to assess the overall significance of the regression model. The sum of squares for the regression is 1826.236, with 4 degrees of freedom, indicating the total variation explained by the four independent variables included in the model. The sum of squares for the residuals is 2789.646, with 266 degrees of freedom, representing the unexplained variation in the model. The total sum of squares is 4615.882, which represents both the explained and unexplained variation. The F statistic is 43.534, and the p-value is 0.000, both of which indicate that the model is statistically significant. This suggests that the combined effect of all independent variables significantly impacts the promotion path of smart prefabricated buildings (PPPB), and the model demonstrates a good fit to the data.
| Model | Sum of Squares | df | Mean Square | F | Sig. | |
|---|---|---|---|---|---|---|
| 1 | Regression | 1826.236 | 4 | 456.559 | 43.534 | 0.000b |
| Residual | 2789.646 | 266 | 10.487 | - | - | |
| Total | 4615.882 | 270 | - | - | - |
Note: a Dependent Variable: PPPB
b Predictors: (Constant), PC, AP, AR, B
Table 15 presents the regression coefficients. The constant term represents the baseline value of the promotion path of smart prefabricated buildings (PPPB) when all independent variables are zero. Correlation analysis showed significant positive relationships among all constructs. Multiple regression results indicated that awareness and perception (β = 0.231, p < 0.001), perceived benefits (β = 0.157, p = 0.007), adoption rates (β = 0.237, p < 0.001), and perceived challenges (β = 0.220, p < 0.001) significantly influenced PPPB. The model explained 38.7% of the variance (Adjusted R2 = 0.387).
| Model | Unstandardized Coefficients | Standardized Coefficients | t | Sig. | Collinearity Statistics | |||
|---|---|---|---|---|---|---|---|---|
| B* | Std. Error | β | Tolerance | VIF | ||||
| 1 | (Constant) | 1.457 | 0.928 | - | 1.57 | 0.118 | - | - |
| AP | 0.319 | 0.075 | 0.231 | 4.24 | 0 | 0.767 | 1.304 | |
| B | 0.134 | 0.049 | 0.157 | 2.722 | 0.007 | 0.681 | 1.468 | |
| AR | 0.198 | 0.047 | 0.237 | 4.246 | 0 | 0.729 | 1.372 | |
| PC | 0.186 | 0.048 | 0.22 | 3.895 | 0 | 0.714 | 1.4 | |
Note:*Dependent Variable: PPPB
In this table, all VIF values were below the commonly accepted thresholds (VIF < 10 and preferably < 5), indicating that multicollinearity is not a significant concern and that the regression coefficients can be interpreted with confidence. It is generally accepted that VIF values greater than 30 may signal substantial collinearity concerns.
The results demonstrate that intelligent construction technologies function as system-level enablers rather than isolated digital tools. Interestingly, perceived challenges positively influence adoption, suggesting that recognizing barriers promotes organizational learning, strategic adaptation, and institutional support. The findings highlight the importance of shifting the industry focus from technology awareness toward implementation capability and collaborative governance.
5. LIMITATIONS OF THE STUDY
Although the model explains a meaningful proportion of variance, approximately 61.3% of the variance in the dependent variable remains unexplained. This suggests that other determinants, such as policy incentives, leadership commitment, organizational culture, supply chain maturity, and interaction effects among constructs, may also influence the promotion of prefabricated buildings. The distribution of respondents across organizational categories was uneven, with regulators accounting for only 9% of the sample. In addition, the analyses were conducted using unweighted data. Consequently, some stakeholder perspectives may be underrepresented, and the findings should be interpreted with appropriate caution. The empirical data were primarily collected from construction professionals within China, which may limit the generalizability of the findings to regions with different institutional environments, regulatory frameworks, and levels of technological maturity. Future studies should conduct cross-country comparative analyses to validate the applicability of the proposed framework in diverse socio-economic contexts. The study relies on self-reported questionnaire data, which may introduce response bias, including subjective perception bias and social desirability effects. Although reliability and validity tests confirmed measurement robustness, objective project performance data could further strengthen future analyses. The cross-sectional research design captures relationships at a single point in time and does not fully reflect dynamic changes in technology adoption processes. Longitudinal studies are recommended to examine how intelligent construction adoption evolves throughout project lifecycles. This research integrates multiple theoretical perspectives; additional variables, such as organizational culture, economic incentives, and technological readiness levels, may further enrich the explanatory power of future models.
CONCLUSION
This study provides empirical evidence from the Chinese construction industry and offers insights that may inform other contexts with similar industrial and institutional characteristics. However, the transferability of these findings to other countries should be assessed with consideration of differences in regulatory frameworks, technological maturity, and organizational practices. The proposed framework offers theoretical contributions and practical guidance for policymakers and industry stakeholders seeking to promote sustainable and digital transformation in the construction sector.
This research concludes that the current and future trends in smart assembly are positive. Stakeholders are increasingly recognizing the benefits of smart prefabricated buildings, and despite the challenges posed by high costs and technological complexity, long-term cost savings and efficiency gains are expected to drive up industry adoption.
Prefabricated buildings are increasingly linked to digital technologies as the construction industry industrializes. Prefabricated buildings combine BIM, IoT, and automation technologies to significantly improve efficiency, quality, and sustainability; reduce costs; and optimize future maintenance and performance.
Despite their recognized benefits, the widespread adoption of prefabricated buildings from an intelligent construction perspective faces several significant barriers, including high implementation costs, difficulties in technology integration, inadequate workforce training, cultural resistance to change, and a lack of standardization.
Intelligent construction of prefabricated buildings brings many benefits, such as cost reduction, improved construction quality, shorter construction period, and increased efficiency in all departments. etc. It also faces barriers such as high cost, complexity of technology integration, insufficient workforce training, cultural resistance, and lack of standardization, which impede its widespread adoption.
AUTHORS’ CONTRIBUTIONS
The authors confirm their contributions to the paper as follows: K.J.: Writing - Original Draft Preparation; D.S.: Data Analysis or Interpretation; M.I.I.: Writing - Reviewing and Editing; N.S.M.: Writing - Reviewing and Editing; M.A.A.: Writing - Reviewing and Editing; M.N.H.J.: Reviewed the results and approved the final version of the manuscript. All authors reviewed the results and approved the final version of the manuscript.
LIST OF ABBREVIATIONS
| AP | = Awareness and Perception |
| AMOS | = Analysis of Moment Structures |
| AR | = Adoption Rates of Intelligent Technologies |
| AVE | = Average Variance Extracted |
| B | = Perceived Benefits |
| BIM | = Building Information Modeling |
| CAID | = Cronbach’s Alpha if Item Deleted |
| CFA | = Confirmatory Factor Analysis |
| CFI | = Comparative Fit Index |
| CITC | = Corrected Item–Total Correlation |
| CR | = Composite Reliability |
| DOI | = Diffusion of Innovations |
| EFA | = Exploratory Factor Analysis |
| GFI | = Goodness-of-Fit Index |
| IoT | = Internet of Things |
| KMO | = Kaiser–Meyer–Olkin Measure of Sampling Adequacy |
| NFI | = Normed Fit Index |
| PC | = Perceived Challenges |
| PPPB | = Promotion Path of Prefabricated Buildings |
| RMSEA | = Root Mean Square Error of Approximation |
| RMR | = Root Mean Square Residual |
| SEM | = Structural Equation Modeling |
| SPSS | = Statistical Package for the Social Sciences |
| TOE | = Technology–Organization–Environment Framework |
ETHICAL STATEMENT
No personally identifiable information was collected, and all data were anonymized prior to analysis. Ethical approval was not required for this study because no human participants were directly involved, no identifiable personal data were collected, and the study used anonymized data only.
CONSENT FOR PUBLICATION
Informed consent was obtained from all participants before their involvement in the study. Participants were assured that their responses would be used solely for academic research purposes and that participation could be withdrawn at any stage without consequence.
AVAILABILITY OF DATA AND MATERIALS
The data supporting the findings of this study are available from the corresponding author [D.S], upon reasonable request. As the data are not deposited in a public repository, no repository name, URL, or reference number is applicable.
FUNDING
This study was funded by Ministry of Higher Education Malaysia (MOHE), Funder ID: Fundamental Research Grant Scheme (FRGS), Awards/Grant number: FRGS/1/ 2023/TK01/UCSI/03/1.
ACKNOWLEDGEMENTS
The authors would like to thank the Ministry of Higher Education Malaysia (MOHE) for funding this research under the FRGS/1/2023/TK01/UCSI/03/1 grant. This support has been instrumental in facilitating the successful completion of this study. The authors also wish to acknowledge the staff of the Civil Engineering Department, Faculty of Engineering, Technology and Built Environment, UCSI University, Kuala Lumpur, for their valuable assistance and support throughout the research. Furthermore, the authors extend their appreciation to the Centre of Excellence for Research, Value, Innovation and Entrepreneurship (CERVIE) for its continuous support and contribution to this work.