All published articles of this journal are available on ScienceDirect.

The Relationship Between Green Building and Regional Economy: A Case Study in Guangdong, China
Abstract
Developing Green Building (GB) is one of the most effective measures to save energy and reduce carbon emissions in the world. To promote the development of green building, it is necessary to analyze driving factors and contribution through the analysis for relationship between regional economy and green building. Therefore, based on the system dynamic(SD) theory, this paper constructs the structure model of the stock flow diagram, including the regional economic subsystem, social subsystem, government support subsystem and green building subsystem. Among the model, Guangdong province, as the most prosperous province of economic development with the largest numbers of certified green buildings in China, has been chosen to show the influence level of their relationship. Through simulation, results can be easily shown that development of GB can make contributions to the field of local economy, however, also be limited by the regional condition, including policy incentive, regional economic, technological, etc. We can also find that direct contribution to the GDP the Green Building made can reach about 2.47 ‰, and 9.23 ‰ indirectly. If the current level of regional production is stable, it can be found that each additional 10,000 square meters of green area building may produce about ¥018.2 million for economy. On the contrary, that the regional economy investment in fixed assets increased by ¥1 million can stimulate 0.001648 million square meter demand of GB. Additionally, employment opportunities directly or indirectly have also been considered.
1. INTRODUCTION
As an important implementation of the sustainable development of the construction industry [1], Green building (GB) has increasingly aroused people’s attention. In response to the world's energy conservation and environmental protection work, the Chinese government has actively participated in taking practical action to promote the development of green building [2]. The concept of GB in China is derived from “Energy-Saving and Land-Saving Residential Building” launched by the central government in 2004. It is defined in Chinese as national evaluation standard for GB, including energy-saving, land-saving, water-saving and material-saving, environment-benign and pollution-reducing, summarized as “Four-saving and One-benign” [3].
Both ‘Several Opinions on further strengthening the urban planning and construction management’, issued on February 21, 2016 by the CPC Central Committee and the State Council and the NPC & CPPCC (National People's Congress and Chinese People's Political Consultative Conference) of the government work report on March 5, 2016, for example, are given high priority on GB development. Through the convening of these important meetings and related policies issued, GB in China has been given an important place in the process of construction industry.
1.1. The Current Situation of GB Development
In China, building energy consumption accounts for 46.7% of the total society energy consumption, and 60% of the carbon emission in cities comes from maintaining buildings’ function [4]. Li, et al. [2] showed the number of GB development from 2008 to 2012, and did a contrast analysis between national projects and local projects. However, great changes have occurred in the green building in the last four years.
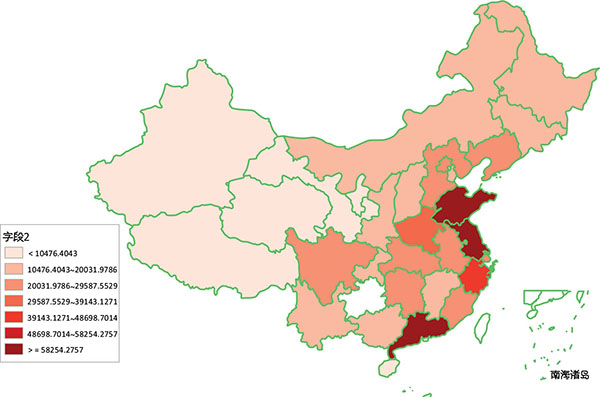
Based on the information statistics issued by ministry of housing and urban construction, the total number of certificated green building has jumped to 3285 (Due June, 2016). In China, the mainly used GB evaluation standards are LEED rating system issued by USGBC (U.S. Green Building Council) and Three-Star rating system issued by Chinese government [5]. In the light of SPSS software application, it is found that from these perspectives we can easily understand the current situation of GB in China, like the proportion of star rating number (Fig. 1), the project type (Fig. 2) and identifying category (Fig. 3), change in the annual growth (Fig. 4) and space distribution of GB in China (Fig. 5).
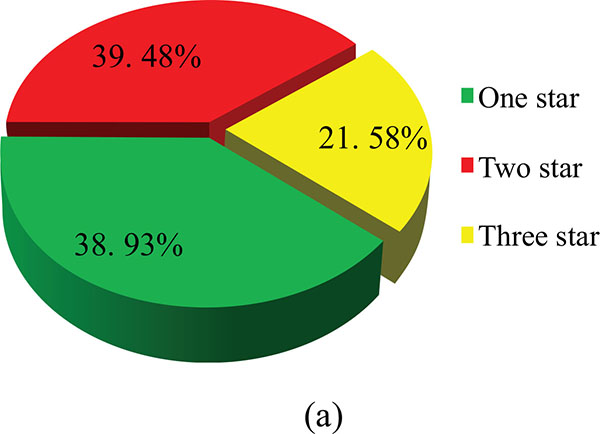
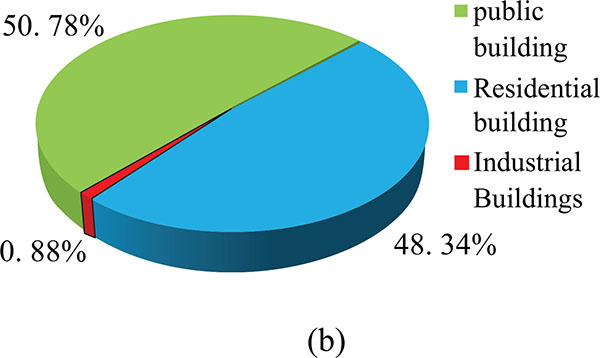
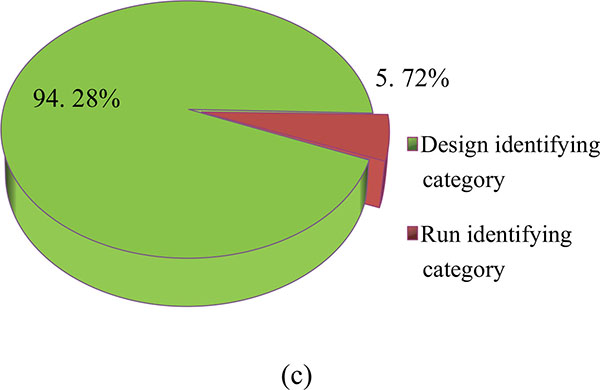
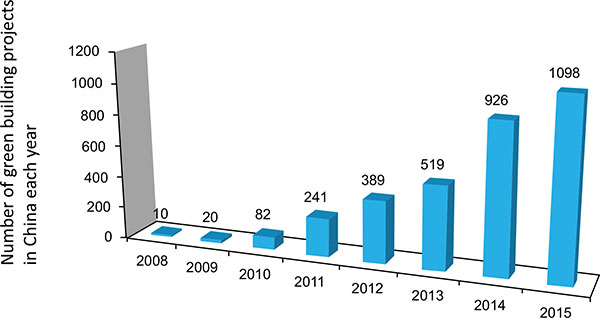
From Fig. (1) to (3), it can be concluded that the number of Two-Star projects accounted for the most (39.48%) among the green building rating system project. Moreover, in line with the data analysis, the number of public building accounted for about 50.78% of the whole number. A relatively clear thing is that there is a long way to the development of China's industrial architecture through comparing the proportion of industrial building. Chinese Three-Star Evaluation System includes design stage labels and operation stage labels. The ratios of green building number in design stage (94.28%) occupy the vast majority, it can easily explain that most GB are certificated projects in design stage [6]. We find that most of these GBs cannot achieve green standard in the operation stage after investigation because of the lack of mature technology and skilled worker. The number of Three-Star rating system projects every year is shown in Fig. (4). The rising trend of GB is more and more obvious. The annual number of GB development has increasingly changed, especially in the year 2014 or 2015 the quantity amounted to 1000, approximately. From regional distribution of green building, obtained by the TABLEAU software, Fig. (5) shows the results that the overall green building assessment labeling program mainly concentrated in the eastern coastal areas in China, like Guangdong, Shandong, Jiangsu province and so forth, especially in Guangdong province, accounted for about 12.15% of the national green building rating projects. Therefore, we need to know why there is such an unbalanced development of regional distribution related to GB.

1.2. Current Situation to the Development of Regional Economy
According to the national bureau of statistics data from 2008 to 2014, the gross domestic production (GDP) of various provinces in China can be found on the whole stable rank, only shown the national regional economic distribution in 2014, as shown in Fig. (6). From Fig. (3), it is obvious that the provinces such as Guangdong, Jiangsu and Shandong always rank the top, particularly, the GDP of Guangdong province [7]. At the same time, in order to promote local green building development, the government of Guangdong province has done a lot of work positively, such as the policy support, the support of special technology research and development, industry Standards [8].
In the recent years, many regulations have been issued by the local government of Guangdong province to carry out, including “issued the key work division plan by the CPC Guangdong provincial party committee of the people's government of Guangdong province about the opinions of raising the level of urbanization in province”, “about building energy conservation priorities for 2013 issued by the Guangdong notice”, “the civil building energy saving in Guangdong province regulations” and so on. These policies support and the relevant laws and regulations provide respectively ¥130 million, ¥93.5 million and ¥88 million for the key areas of building energy conservation and green building development work, the province's major science and technology projects, energy saving special in 2013 to 2015.
1.3. Literature Review
From the review of an existing set of research knowledge related to GB, it is found that common research themes and methodology mainly focus on definition and scope of GB, quantification of benefits of GB compared to conventional architecture and various approaches to achieve GB [9]. Especially, in certain aspects, plenty of academic research has referred to some instructions, such as policy [10], market outlook, technical research and development [11], risk management [12, 13], GB assessment [14], Energy Consumption [15] and so on.
Qian and Chan put forward an important measure of economic incentives to promote building energy efficiency by comparative analysis of China and the Government of developed countries in green buildings after investigation [16]. Liu also proposed to the reasonable use of positive incentives and perverse incentives policy after the analysis of the current situation on the development of Beijing green building [10]. On account of government support for green building incentives systematically, Olubunmi et al. [17] reputed that green building incentives are divided into internal and external incentives.
Here are some researches of green building policy at present, but the process of implement should be thoroughly considered. Yang used system dynamics model for green residential market simulation, and make recommendations related to the green residential market development based on the definition of GB [18]. Kim and Cho predicted through interviews and other research methods on three different areas of the green building market, and believed that green building will grow rapidly in the next decade, which results in changes in the industry related business [19]. Dermisi analyzed the impact of the US Green Building Standard LEED ratings for office asset valuation and market value [20].
Also, many scholars mentioned the obstacles in the development of green building. Lam, et al. [21] analyzed green building construction process factors, and summed up five aspects; Xuan analyzed the factors in the whole life of the green building by questionnaire [12]. Overcoming these factors is of great significance to promote the development of green building.
In order to promote the development of green building, the evaluation study shows a more prominent value. Carter and Keeler used cost-benefit analysis model to evaluate the net present value of green buildings [22]. Dwaikat and Ali raised the earned value Management Approach which is used to measure the actual Energy Cost Performance of Green Buildings [23]. According to use a set of fuzzy theory, Xu et al. [24] set up key performance indicators (KPI) of the sustainability for GB, and put forward the eight key indicators which consist of the stakeholder satisfaction, profitability of the project, energy consumption, etc. Additionally, they pointed out the impact of transaction costs on the development for green building real estate developers, but without considering full life cycle. Hence, Cao Shen used a full life cycle cost-effectiveness of green building in a residential area of water-saving to measure cost-benefit [14]. Meanwhile, Qin, et al. [13] did numerous works on risk perceptions of the life-cycle of green buildings in China, through a questionnaire analyzing probability and the degree of influence of various risk factors.
In summary, there have been extensive researches on various aspects of GB in different context. Yet there is lack of analysis for relationship between green building and regional economy quantitatively. Such comprehensive analysis plays a critical role not only in the process of gaining GB growth obstacles, but also contributing to calculate outputs about quantitative analysis of society and economy benefits generated by GB. Therefore, this research aims at introducing GB situation in China objectively in a bid to strain the main points to penetrate into analyzing economic and social benefits quantitatively related to GB from unbalanced development, such as providing regional employment opportunities directly or indirectly (through other industries linked to the construction industry) and contributing toward the national economy [9]. In this paper, Guangdong province, one of the most prosperous economies-- with the largest number of green buildings in China, is selected as a case support of SD model built.
2. METHODOLOGY AND DATA
2.1. Research Method
Through contrast between the space distribution to GB development and regional economy of various provinces, we can be sure that there has certain internal relation between the regional economic and the green building development scale. Thus, this paper will apply the new methodology based on the theory of system dynamics, to keep on further research on the relationship and explore the rule. Currently, on interaction between infrastructure building and socio-economic role of regional, a large number of scholars have done a useful exploration. Usually, using theory methodologies, like gray correlation analysis [25], production function method, input-output method [26], cost-benefit analysis [1], fuzzy evaluation theory [27]and AHP methods [28], research works will always ignore the mutual influence between the two considerations and we easily find it difficult to master the accuracy of evaluation because of strong subjectivity.
SD (System Dynamics) is created by Jay Wright Forrester in 1956 [29]. It is a subject which studies the feedback structure and behavior of the system [30], dealing with related issues through quantitative and qualitative methods or the way of systematic synthesis reasoning [24]. Some basic theory and modeling method of system dynamics is left here, but can be found in the literature [31]. This paper based on SD model, aims at exploring the interaction between green building and regional economy, which is a typical complex social system. Therefore, some reasons as followed can account for applicability of SD model.
- The cause and effect and of Structure flow diagram system dynamics can directly reflect the direct or indirect connection the relationship, and causality and feedback between green building and regional economy [29].
- The application of System Dynamics, based on the causal relationship between the elements and the corresponding feedback structure, can avoid the problem that real data collection is not complete to some extent [32].
- The system dynamics can be applied to solve the problem of long term and complex system, which could contribute to the development of the interaction between the two variables, and the analysis of its process structure is clear and definite [33].
- The system dynamics can simulate the function of the two variables with the help of the computer, and observe the application development of each variable.
2.1.1. Step 1: Identify System Boundaries and Dynamic Hypothesis
Based on operational reality of system modeling, only the mutual influence between green architecture and the regional economic relations are studied in this paper, eliminating nonessential factors [34]. The task of application system dynamics modeling at first is to determine the system boundary. In this paper, boundary determined including the scope of consideration for green building research, the scope of consideration for regional economic research, the boundary of green building and regional economic influence each other.
The scope of GB mainly contains green building evaluation identification project issued by MOHURD in China, with no regard to local evaluation identification projects. Meanwhile the research of regional economy covers regional gross national product (GNP), regional employment of population, regional investment of fixed assets, the policy support of local government, industry technical level, relevant standards and regulations and the public recognition.
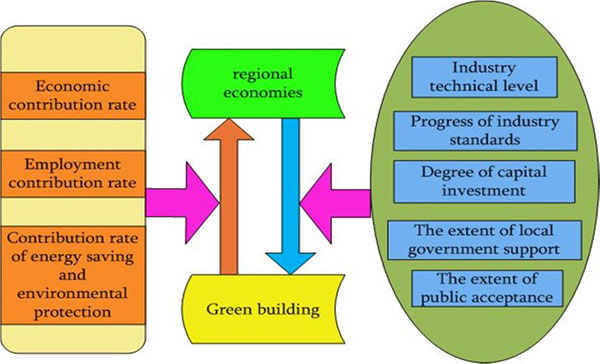
Boundary of the interaction between green building and regional economy can be determined as follows Fig. (7). On the one hand, the influence of green building on regional economy mainly reflects in the following three factors: the contribution of regional population employment (direct or indirect employment), the contribution of regional GDP and the contribution of energy conservation and environmental protection. On the other hand, the influence of regional economy on green building mainly reflects in the following five factors: the support of local government, industry technical level, perfection degrees of standards, the public recognition and the capital investment.
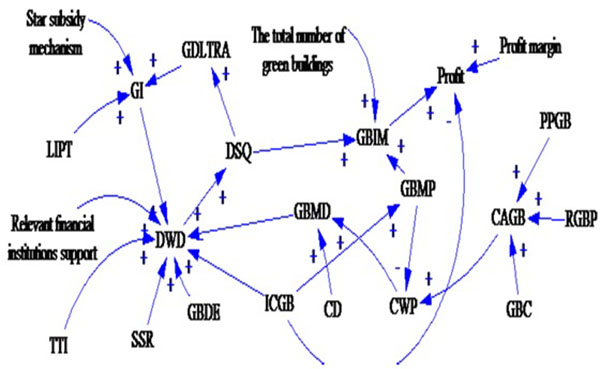
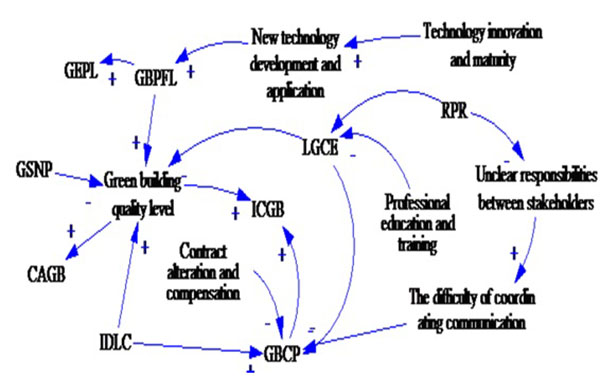
Causality diagram of green building and regional economic system can be drawn by Vensim PLE, based on the relations analysis of Green Building and regional economic. It consists of four sub-systems, including sub-regional economic subsystems (Fig. 8), social and employment sub-population (Fig. 9), local government support subsystem (Fig. 10) and green building subsystems (Fig. 11).

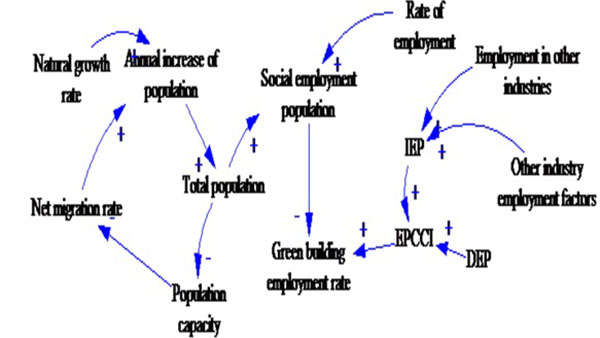
The social population employment system is defined as what raises the required elements of social resources for the economy, the government sector and the development of green building itself, including resources and labor force, etc.
Local government department subsystem mainly provides a number of local characteristics of the policies and regulations, responsible for the preparation of the adjustment of regional resources, propaganda and public opinion guidance work, for the development of local green building system.
Green Building subsystem is based on the required conditions and the development of green building forward and backward factors, including green building production activities, the regional economy of industrial added value, consumption of resources used, as well as promoting other industries’ development.
2.1.2. Step2: Simulation
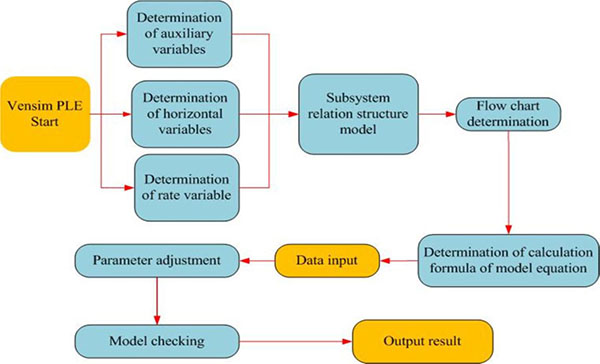
Building the diagram of causal and effectual relations between variable quantities through Vensim PLE software can merely present the basic aspect of the system feedback and the structure intuitively, however it is clearly quite hard to describe and embody that the impact of it feedbacks the effect of systematic and dynamic function. As a result, it is necessary that we should make further explorations to build a stock and flow chart concerning the economically systematic dynamics of the first zone of green construction projects.
Clearly, the process to build up model can be present in Fig. (12). Meanwhile, we are able to determine the bearing between subsystems based on the building of subsystem resulting from the causal and effectual connections between the green buildings and regional economic systems. The details are listed as the followings. Both regional economic subsystem and the subsystem of green building can be linked with each other through the contribution and investment of green architecture projects. Likewise, both the subsystem of social employment population and the subsystem of green construction can be associated with each other through the contribution of employment rate created by green building projects. In addition, both the system of local government support and the project of green construction can be connected with each other through the degree of governmental incentive. Moreover, both the subsystem of social employment population and the subsystem of regional economy can be tied with each other through the area of region and its per capita GDP. In the end, the model can be built as shown in (Fig. 13).
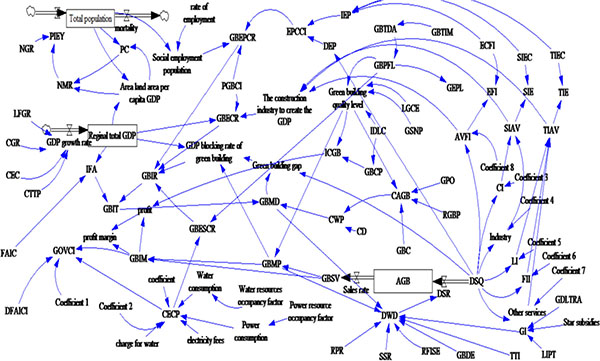
2.1.3. Step3: Write Equation
The main calculated formulas between variable quantities are listed as follows.
- The capacity of development and construction of green buildings = DELAY1 [the investment volume of green buildings * the contribution rate of investment, the period of construction of green buildings, the initial value of green buildings (Unit: ten thousand square meters)
- The volume of energy consumption of green buildings = (the amount of water consumption * water fees + the amount of electricity-consuming resources * electricity fees + the amount of other resources consumption * costs) * coefficient three (Unit: one hundred million Yuan)
- The gap of green buildings = IF THEN ELSE [the volume of development of green buildings > the volume of demand of green buildings, the volume of development of green buildings - the volume of demand of green buildings, 0] (Unit: ten thousand square meters)
- The GDP blocking rate = the gap of green buildings dividing the aggregate of GDP
- The annual growth of population in one region = the total population in the region * (natural birth rate + net emigration rate) (Unit: ten thousand people per year)
- The social population of employment in one region equals the total population in the region multiplying the employment rate (Unit: ten thousand people per year).
- The capacity of population = the total population dividing the area of the region (Unit: ten thousand people per square kilometer)
- The GDP of construction business = the increment value of the first industry + the increment value of the secondary industry + the increment value of tertiary industry + the output of construction sectors (Unit: one hundred million Yuan)
- The economic contribution rate of green construction business = (the GDP created by construction sectors * the coefficient two of occupancy rate in regional construction business) / the total GDP volume of the region.
- The employment population created by green construction sectors = the direct employment population generated by green construction sectors + the indirect employment population produced by green construction business (Unit: ten thousand people)
- The contribution rate of employment generated by green construction business = the employment population coming from green construction business dividing the employment population in the society (Unit: ten thousand people)
- The investment rate of green construction = A function of (the contribution rates of economy, employment and energy-saving sectors).
2.1.4. Step4: Testing
Due to the complexity of the real system, the model will have the ideal assumption; therefore, the model is only under certain conditions to the real world [35]. Model is the reality of the simulation, which is precise to our perception of the reality of the simulation. In order to verify the availability of the model, we must make sure that the laws and rules which we observe in reality are still set up in the model. The validation approach is to use formal or informal methods to compare the performance of the model with the test parameters. The comparison of the methods is: to observe the results of a series of data, see the establishment of the conditions whether it is consistent with the qualitative description of the problem, as well as the model characteristics and consider characteristics of the source of the model [36]. There are many kinds of model tests, such as Parameter estimation test, Sensitivity test, Dimensional consistency test and so on [37, 38].In this paper, the test method is chosen as the dimensional consistency test.
2.2. Research Data
As described in research method section, the relevant data used for analysis in this study are from comprehensive observations, questionnaires, interviews and relevant websites. Therefore, the quality of the data is determined by the quality to the accuracy of data collection [39]. In this paper, Guangdong province, the best province for economic development with the largest number of green buildings in China, is selected as the case study. In the SD model, it is assumed that the basic data in 2013 is regarded as the datum point in order to study and predict the development of Guangdong province in 2014. These data collected which are favorite to ensure the accuracy, is derived from the official website, such as China National Bureau of statistics, China National Statistical Yearbook, the whole country and local provincial Ministry of housing official website.
Additionally, parameter determination is also very important in the model calculation [40]. For the determination of the quantitative parameters, it is mainly to use the network resources to search the related material and books. This method is equally applicable to the determination of partial qualitative parameters. Yet establishing other qualitative parameters need real-time field interviews for the responsible person in local government, and then the qualitative problem can be quantified by mathematical language. Due to subjective judgment, which is very casual, the accuracy of the whole model will be slightly affected in the process of determining the qualitative parameters, which is the defect of the model itself. The main parameters in the model are determined as shown in Table 1.
| Parameter name | Input value | Unit |
|---|---|---|
| Green building construction period | 1 | Year |
| New construction area of green building identification evaluation | 860 | 10 thousand square meters per year |
| PGBCI | 0.02 | / |
| GDP growth rate | 0.085 | / |
| Rate of employment | 0.6854 | / |
| NMR | 0.51 | / |
| FAIC | 0.1039 | / |
3. RESULT AND DISCUSSION
3.1. Simulation Result
Relevant data in 2013 as a benchmark due to data acquisition difficulty limit, the analyzed results for 2014 can be shown in the model after various parameters input. The operating results are compared with the actual value of green building and economic index values in 2014, like the regional GDP (Fig. 14) and total population (Fig. 15).
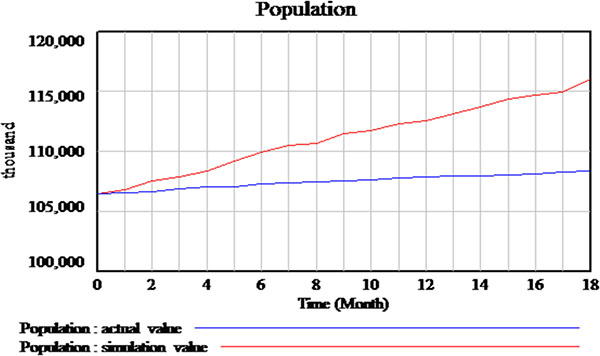
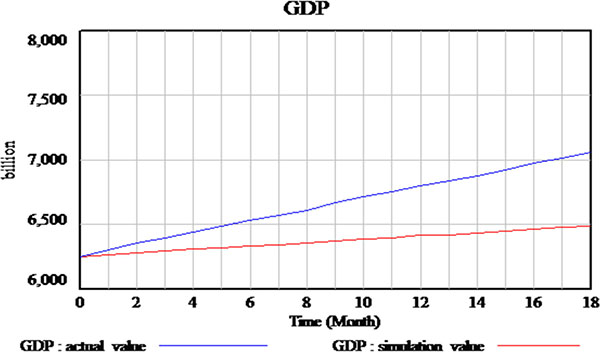
We may see that after one year regional GDP and total population by linear interpolation can be respectively to calculate the actual value and the simulated value. The various results obtained are listed in Table 2, at the same time the actual value and the simulated value of the new area of green building and Social employment are also listed.
| Index | Unit | Actual value | Simulation Value | Relative error |
|---|---|---|---|---|
| GDP | billion yuan | ¥67809.85 | ¥63721.12 | 6.03% |
| Total population | 1000 people | 107240 | 113400 | 5.74% |
| Social employment population | 1000 people | 85679.3 | 81215.64 | 5.21% |
| Green building new area | 10 thousand square meters | 9922 | 10143.82 | 2.24% |
We can easily judge that the deviation between simulation value and the actual value in various indicators is less than 10%, in addition, it belongs to the range of allowable error for simulation results, which can be used to describe and analyze the status quo accurately [27]. Moreover, the model built up, through the boundary model test and system test, proved to be suit for research on the relationship between regional economy and GB development through the boundary model test and system test.
3.2. The Influence of Green Building on Regional Economic Development
3.2.1. The Impact of Green Building on the Regional Economy
It can be shown that newly increased marking area of Green Building evaluation identification project in Guangdong Province accounts to about 8.6 million square meters, over 228 projects cumulatively and more than 23.56 million square meters for identified area. Correspondingly, the simulated results for 2014 is that the newly increased area can account to 11.6 million square meters, accounting for 2.3% of the annual new construction area of the construction industry approximately through simulation. Direct contribution of GDP produced by green building has occupied about 2.47 per thousand of GDP simulation approximations, similarly, 9.23 per thousand indirectly. If not consider under the current socio-economic changes in the level and production capacity, we’ll have enough confidence on that every one million square meters of new construction area of green building increased will about ¥18.2 million generate economic value for the regional development in 2014.We can understand that non-developed areas are difficult to put forward a high level of requirements for the green building with high performance, because their life problems are a big problem.
Green building growth plays an important role in construction enterprises, especially local companies. Through the construction of green building experience many times, can promote the construction of large-scale production. Huge business opportunities are the core driving force for them to take the initiative to improve their competitiveness and raise their demand if good situation to the development of green building [41].
3.2.2. The Impact of Green Building on the Regional Employment
It presents through simulation that the number of jobs directly created by the green building is about 27.331 thousand, 132.12 thousand employments indirectly. The proportion of indirect employment in all industries created by green building is about 0.0045%, 46.5827% and 53.4128% respectively.
Green building is moving into the direction of industrialization [42], and the employment of the population driven by the whole industry chain is relatively large. The high level of performance and quality of the green building is found in the model structure, and it also has a great effect on improving the concept of the people [43].
3.2.3. The Impact of Green Building on the Regional Industrial Structure
It can be presented after simulation that the regional development of green building results in changes in the situation of various industries at the end of 2014 (Table 3). It provides us from Table 3 above that the impact of green building development on the primary industry is extremely small, followed by the impact of the tertiary industry; the secondary industry influenced the largest. There is enough reason to estimate that the overall economy of the society is developed in Guangdong province and the development of green building has great importance by the government. Furthermore, it is easy to understand the development of green building, new energy saving and environmental protection construction, which leads to change stability of regional industrial structure, for example, it is inevitable to increase the development of transportation industry by altering the mode of production from the traditional on-site mixing construction to transport and install the components.
| The primary industry | The secondary industry | The tertiary industry | |
|---|---|---|---|
| Specific gravity of Influence | 1.01% | 52.23% | 46.76% |
From the operation process of the model building, we can find that the extension of the vertical development of the green building increasingly changes the traditional industrial manufacturing field into the service industry [44, 45].
3.3. The Promotion of Regional Economy to Green Building
3.3.1. The Impact of Regional Economy on Green Building
Economic market of relatively prosperous region can provide a solid foundation for the development of green building support so that contractors or developers are more likely to raise funds. This can help enterprises to open up the market for green building [46, 47].
On the one hand, development of the regional economy can promote investment. According to the preliminary judgment of simulation, 39.48 square meters of green building identification area results from every¥100 million of the regional economy, which indicates that the economic level of the region can promote the development of investment in energy saving and environmental protection of construction industry. On the other hand, development of the regional economy can promote the increase in market demand. According to stimulation, it is found that with regional national economy increase by per ¥100 million, the demand to green building, increased by 16.48 square meters, can be boost by the economy, which described the interaction between economic development and green building.
3.3.2. The Impact of Government Support Mechanisms on Green Buildings
The government's policy incentive effect is very obvious in China [48].Through simulation, it is the most sensitive for developers to implement some relevant incentive policies to green building on basis of local government. It indicates by Vensim that special funds of government incentives change10 percent, which may cause changes of the regional green building’s new building construction area in the magnitude from 6 to 9 percent. Local government of Guangdong Province except follow the implementation of national laws and regulations, standards of evaluation to the green building and some other relevant policies issued by government sector, such as, energy conservation law, the state building energy conservation laws, Green building action plan, etc. The local authority also takes some actions positively to develop and issue local policies and standards, which have local characteristics, such as Implementation plan of green building operations in Guangdong Province, Regulations of civil building energy conservation in Guangdong Province and so on. Additionally, the province is also actively implemented to invest a lot of Government funding and policy incentives. It is estimated that almost an average of ¥10 million special funds invested in major scientific and technological projects or special areas of energy saving for every year. For special demonstration of significant project, the local council will give appropriate subsidies correspondingly in the form of construction area. For a single project subsidy, the maximum amount is ¥2 million. What can be obtained through two-star identification evaluation project can give a subsidy ¥25per square meter, the maximum limit ¥1.5 million for a single project. The government grants ¥45per square meter for three-star evaluation labeling program, the highest amount to ¥2 million. Therefore, these positive policies play a leading role in the development of green architecture.
3.3.3. Influence of Social Subsystem on Green Building
Market demand is the key to the development of green building [49]. In particular, the people’s idea that is bound to lead to the suspicion of green building, it is easy for the large-scale production of green building to have a very negative impact [50].The simulation process has also shown that people's acceptance of green building has a significant impact on the further development of green building. From results, we may see that when people's recognition of green building is reduced by 10%, the size of the market will quickly shrink by about 18%. It is worth noting that ordinary people pay more attention to the efficiency and quality of green building, developers are concerned about how to create efficiency and sell better, local government is concerned about whether it is able to stimulate economic growth and increase employment. It could be argued that market orientation and the concept of change is very important for market demand.
CONCLUSION
Based on the comprehensive analysis to the development of regional distribution for green building, system dynamics about Green Building and Regional Economy was built up. Then, through the analysis of the causal relation and the stock flow chart, the Guangdong province which has the largest number of green building evaluation identification items is selected as an empirical study on the relationship between green building and regional economy. The results show that it is closely related to the development of green building and regional economic to local economic prosperity, residents’ green consciousness, technology innovation, government support and so on. The regional economic development could not only promote the development of green building, but also be influenced by green building, to a certain extent, on regional social employment, economic and so on. At the same time, it indicates that the model simulation results close to the actual value are effectively persuasive to analyze the relationship between green building and regional economic. We should understand that a focus on the future is to focus on the comprehensive collection of data in order to improve the accuracy of simulation modeling.
LIST OF ABBREVIATIONS
| AGB | = Accumulation of Green Building |
| AVFI | = Added Value of the First Industry |
| CAGB | = Consumer Acceptance of Green Buildings |
| CD | = Comfortable Degree |
| CEC | = Capital Elastic Coefficient |
| CECP | = Construction Energy Consumption |
| CGR | = Capital Growth Rate |
| CI | = Construction Industry |
| CTTP | = Contribution Rate of Technical Progress |
| CWP | = Consumer’s Willingness to Pay |
| DEP | = Direct Employment Population created by green building |
| DFAICI | = Depreciation of Fixed Assets In Construction Industry |
| DSR | = Development Supply Rate |
| DSQ | = Development Supply Quantity |
| DWD | = Developers' Willing to Develop |
| ECFI | = Employment Coefficient of the First Industry |
| EFI | = Employment in the First Industry |
| EPCCI | = The Employment Population Created by the Construction Industry |
| FAIC | = Fixed Assets Investment Coefficient |
| FII | = Financial and Insurance Industry |
| GB | = Green Building |
| GBC | = Green Building Certification Evaluation |
| GBCP | = Green Building Construction Period |
| GBDE | = Green Building Development Experience |
| GBECR | = Green Building Economic Contribution Rate |
| GBEPCR | = Green Building Employment Contribution Rate |
| GBESCR | = Green Building Energy Saving Contribution Rate |
| GBIM | = Green Building Income |
| GBIT | = Green Building Investment |
| GBIR | = Green Building Investment Rate |
| GBMP | = Green Building Market Price |
| GBMD | = Green Building Market Demand |
| GBPFL | = Green Building Performance Level |
| GBSV | = Green Building Sales Volume |
| GBTDA | = Green Building Technology Development and Application |
| GBTIM | = Green Building Technology Innovation and Maturity |
| GDLTRA | = Government Departments at all Levels Target Responsibility Assessment |
| GEPL | = Green Environmental Protection Level |
| GI | = Government incentives |
| GOVCI | = Gross Output Value of Construction Industry |
| GPO | = the Guidance of Public Opinion |
| GSNP | = Green Supervision is Not in Place |
| ICGB | = Incremental Cost of Green Building |
| IDLC | = Integrated Design of Life Cycle |
| IEP | = Indirect Employment Population created by green building |
| IFA | = Investment in Fixed Assets |
| LFGR | = Labor Force Growth Rate |
| LGCE | = Lack of Green Construction Experience |
| LI | = Logistics Industry |
| LIPT | = Low Interest loans Preferential Tax |
| NGR | = Natural Growth Rate |
| NMR | = Net Migration Rate |
| PC | = Population Capacity |
| PGBCI | = The Proportion of Green Building in the Construction Industry |
| PIEY | = The Population Increased Each Year |
| RFISE | = Relevant Financial Institutions to Support Efforts |
| RGBP | = Reputation of Green Building Products |
| RPR | = Relevant Policies and Regulations |
| SD | = System Dynamic |
| SIAV | = Second Industrial Added Value |
| SIE | = Second Industry Employment |
| SIEC | = Second Industry Employment Coefficient |
| SSR | = Sense of Social Responsibility |
| PPGB | = Public Propaganda of Green Building |
| TIAV | = Third Industrial Added Value |
| TIE | = Third Industry Employment |
| TIEC | = Third Industry Employment Coefficient |
| TTI | = the Transformation of the Traditional Idea |
CONFLICT OF INTEREST
The authors confirm that this article content has no conflict of interest.
ACKNOWLEDGEMENTS
In this paper, we would like to express our gratitude to all those who helped us during the writing of this thesis. Subject “Comprehensive supervision platform and demonstration of industrialized building evaluation”(2016YFC0701810) sponsored by National key research and development program. Subject “Evaluation techniques, standards and systems for the development of industrial buildings” (2016YFC0701808-02)are sponsored by National key research and development program.

