All published articles of this journal are available on ScienceDirect.
Compressive Strength Study on the Freeze-thaw Resistance of Recycled Aggregate Concrete Members
Abstract
Introduction:
Freeze-thaw resistance of recycled aggregate concrete with partial or total replacement of recycled aggregate compared with that of natural aggregate concrete was investigated in this paper.
Method:
Ninety specimens were fabricated to study the influence of different recycled aggregate replacement ratios on the surface scaling, mass loss, and residual compressive strength after 100 freeze-thaw cycles.
Results:
The experiment results indicate that the type of recycled aggregate and its replacement ratio have significant effects on the freeze-thaw performance. The cubic compressive strength of recycled aggregate concrete is overall slightly lower than that of normal concrete. After 100 freeze-thaw cycles, the compressive strength decreases and the reduction extent increases with increasing replacement rate of recycled aggregate. The surface scaling of reinforced recycled concrete prisms tends to be more severe with the increase of freeze-thaw cycles.
Conclusion:
Furthermore, a notable rise in mass loss and the bearing capacity loss is also found as the substitution ratio increases. Under the same replacement rate, recycled fine aggregate causes more negative effects on the freeze-thaw resistance than recycled coarse aggregate.
1. INTRODUCTION
Recycled aggregate concrete (RAC) is a kind of 'green' construction material for the substitution of natural aggregate with recycled aggregate. According to the particle size, recycled aggregate is divided into recycled coarse aggregate (RCA) and recycled fine aggregate (RFA). Facts proved that great popularization and application of RAC are the efficient ways to recycle and reuse large quantities of waste concrete, and the use of recycled aggregate instead of natural aggregate can save a great quantity of natural resources and protect our living environment [1].
Due to the characteristics of production process, the mechanical properties of RAC are lower than those of normal aggregate concrete (NAC), such as higher water absorption and shrinkage, lower strength and elastic modulus and reduced workability [2, 3]. Till now, a lot of researchers have conducted experimental research on the basic physical property and mechanical behavior of RAC. Olorunsogo and Padayachee [4], Nangataki et al. [5], Oikonomou [6], Khatib [7]discovered that the compressive strength, shear strength and tension strength of RAC were much lower than those of NAC. The previous findings mainly focus on the short-term mechanical behaviors of RAC; however, the research on the durability (e.g. freeze-thaw action, chloride penetration, and carbonation) of RAC is rather scarce.
Obviously, the freeze-thaw resistance of hydraulic structures in cold areas is a key problem which needs to be emphatically considered. To expand the application of RAC in cold regions, the first question is to systemically study the frost resistance of RAC. So far, relevant research has been conducted and some achievements have already been obtained.
Salem et al. [8] and Zaharieva et al. [9] reported that water saturation degree of RCA and RFA was a great important factor determining the freeze-thaw resistance of RAC. Yildirim et al. [10] furthered the research and conducted experiments to study the effect of RFA with 0%, 50%, and 100% replacement percentage on the freeze-thaw resistance. The test results showed that the weight loss and natural frequency decreased consistently with the decreasing water/cement ratio. The RAC with 50% RFA and 50% saturation achieved the remarkably good performance, which was very close to that of specimens with virgin aggregates.
Richardson et al. [11], Salem and Burdette [12] found that the resistance of RAC to freeze-thaw cycling can be improved by adding air entrainment, polypropylene fibers and fly ash in concrete mixing.
In a study carried out by Medina et al. [13], it was found that the freeze-thaw durability of concrete made with 20-25% ceramic aggregate obtained from industry waste was better than that of conventional concrete after 56 freeze-thaw cycles. This better performance was due to the high mechanical quality of recycled concrete and the intrinsic properties of the new aggregate.
Bogas et al. [14] studied the freeze-thaw resistance of normal strength and high-strength recycled concrete with different RFA replacement ratios (0%, 20%, 50% and 100%). The experimental results showed that the w/c ratio had a greater influence on the frost resistance than the type of aggregate, and the incorporation of RFA is not detrimental to the frost resistance of concrete.
Omary et al.’s [15] experimental results showed that the anti-freezing performance of concrete produced with recycled concrete gravels was less resistant to freeze/thaw action than conventional concrete but the degradation was not significant.
From previous findings, it can be seen that there are few systematic researches on the effects of the type of recycled aggregate (RA) and the substitution percentage used on the frost resistance of RAC. Due to the adhered mortar on the surface of RA, the microstructure of RA is far more complex than that of normal aggregate. Furthermore, the past studies are mainly conducted on the plain concrete cubes and prisms to study the resistance to freeze/thaw action. Researches on the component level, instead of material level, conducted to study the frost resistance of RAC are rather rare. Therefore, it is urgent to study the freeze-thaw resistance of reinforced recycled concrete for wider application of RAC.
Based on the test of 54 cubes and 36 reinforced concrete prisms, the aim of this paper is to study the effects of the incorporation of RCA and RFA with different replacement ratio on the freeze-thaw resistance of nine kinds of RAC. A systematical research was carried out to assess the freeze-thaw resistance of RAC on the basis of compressive strength, mass loss and residual bearing capacity after exposure to 100 cycles of freezing and thawing.
2. EXPERIMENTAL PROGRAM
2.1. Materials
The RCA and RFA were obtained by crushing waste concrete, which was taken from an old demolished reinforced concrete frame structure, as seen in Fig. (1). The average compressive strength of concrete cores (100mm cube) extracted from the original waste concrete was 38.7MPa. The natural coarse aggregate (NCA) used in the mix was crushed gravel with a maximum size of 25 mm. The natural fine aggregate (NFA) was local river sand with a fineness modulus of 2.40. The basic physical properties of aggregates are listed in Table (1).

| Type of aggregate |
Size (mm) |
Apparent density (kg/m3) |
Bulk density (kg/m3) |
Porosity (%) |
Clay dosage (%) |
Water absorption (%) |
Crushing value (%) |
|---|---|---|---|---|---|---|---|
| NCA | 5-25 | 2660 | 1420 | 40.32 | 1.28 | 1.00 | 8.12 |
| RCA | 5-25 | 2390 | 1230 | 45.49 | 3.37 | 3.23 | 12.51 |
| NFA | <4.75 | 2569 | 1450 | 41.69 | 0.97 | 0.96 | ----- |
| RFA | <4.75 | 2310 | 1280 | 47.33 | 3.84 | 15.47 | ----- |
2.2. Concrete Mix Design
In order to study the influence of the substitution of RCA and RFA with different replacement ratios (0%, 50% and 100%) on the freeze-thaw behaviors, nine kinds of concrete were prepared with different mixture proportion listed in Table (2). High efficiency water reducing agent (WRA), mineral powder (MP), and fly ash (FA) were added to enhance the workability of the RAC. The mix proportions and properties of fresh concrete were summarized in Table (2). The concrete type designations starting with RC refer to recycled concrete, and the following two numbers (0, 0.5, 1) indicates the replacement ratio of RCA and RFA respectively. For example, the label ‘RC-1-0.5’ indicates that the recycled concrete with 100% substitution of NCA by RCA, and 50% replacement of NFA by RFA.
| Type of concrete |
mix proportions(kg/ m3) | Properties | |||||||||
|---|---|---|---|---|---|---|---|---|---|---|---|
| Cement | MP | FA | NCA | RCA | NFA | RFA | Water | WRA | Slump (mm) |
Density (kg/m3) |
|
| RC-0-0 | 251 | 54 | 54 | 1201 | 0 | 676 | 0 | 161 | 6.8 | 210 | 2415 |
| RC-0.5-0 | 251 | 54 | 54 | 600.5 | 600.5 | 676 | 0 | 161 | 6.8 | 210 | 2406 |
| RC-0-0.5 | 251 | 54 | 54 | 1201 | 0 | 338 | 338 | 161 | 6.8 | 200 | 2402 |
| RC-0.5-0.5 | 251 | 54 | 54 | 600.5 | 600.5 | 338 | 338 | 161 | 6.8 | 180 | 2378 |
| RC-1-0 | 251 | 54 | 54 | 0 | 1201 | 676 | 0 | 161 | 6.8 | 185 | 2380 |
| RC-0-1 | 251 | 54 | 54 | 1201 | 0 | 0 | 676 | 161 | 6.8 | 150 | 2372 |
| RC-1-0.5 | 251 | 54 | 54 | 0 | 1201 | 338 | 338 | 161 | 6.8 | 160 | 2356 |
| RC-0.5-1 | 251 | 54 | 54 | 600.5 | 600.5 | 0 | 676 | 161 | 6.8 | 140 | 2348 |
| RC-1-1 | 251 | 54 | 54 | 0 | 1201 | 0 | 676 | 161 | 6.8 | 120 | 2309 |
As can be seen in Table (2), the slump value decreased with the increasing replacement rate of recycled aggregate. When the NCA and NFA were both totally replaced by recycled aggregates, a significant reduction of slump value was observed for the higher water absorption of RCA and RFA.
2.3. Specimen Preparations
A total of 90 specimens, including 54 cubes and 36 prismatic reinforced concrete specimens were cast in a standard laboratory at 25±2 ̊C, as seen in Fig. (2).
The specimens were divided into two groups according to the different shape feature and research content:
Group 1-Fifty-four 100×100×100mm3 cubes with different replacement ratio of RCA and RFA were under two conditions: 27 specimens were exposed to freeze-thaw test, the rest were not. Each condition involved in nine kinds of RAC and three samples were cast with the same concrete mix.
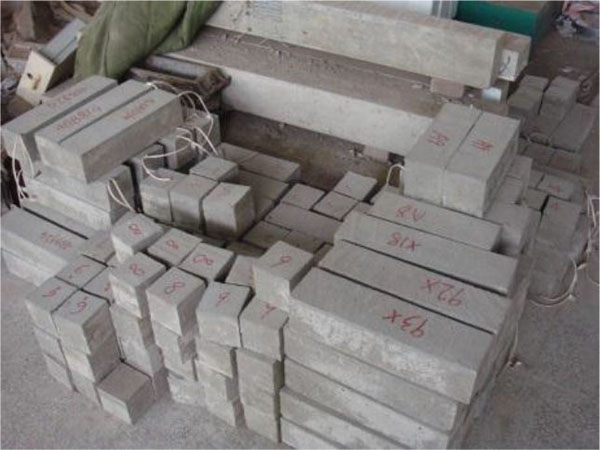
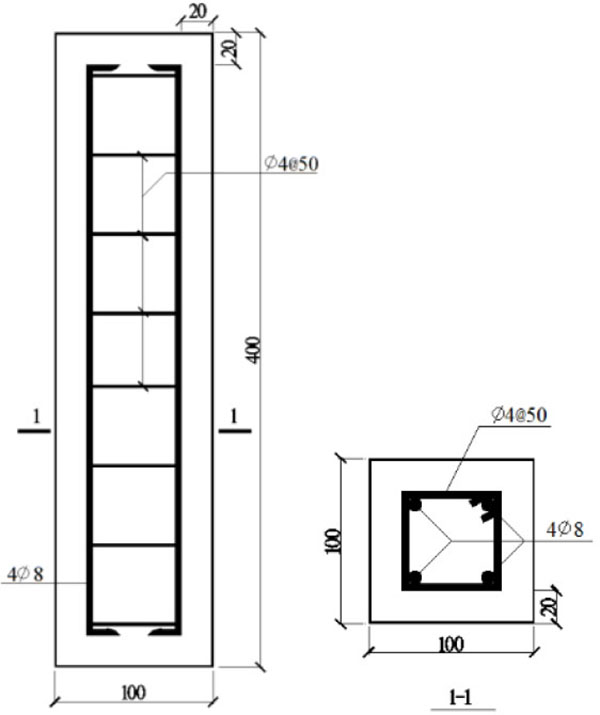
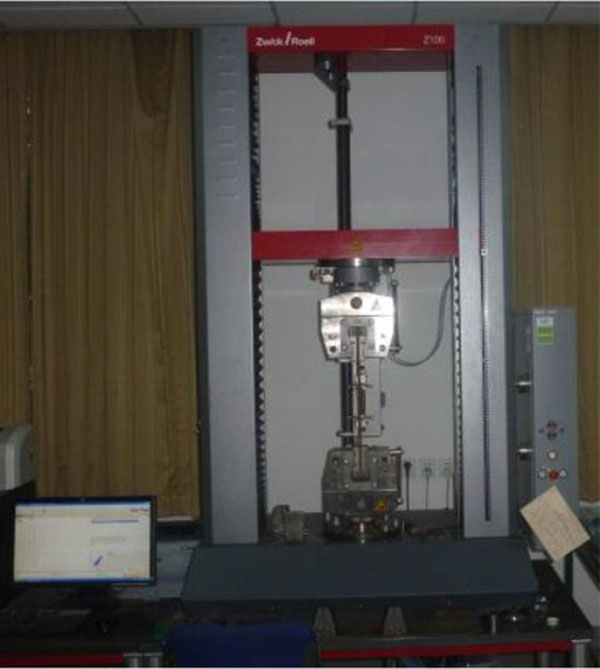
Group 2-Thirty-six 100×100×400mm3 reinforced concrete prisms with different replacement ratio of RCA and RFA were under two conditions: 18 specimens were exposed to 100 freezing and thawing cycles, the rest were not. Each condition involved in nine kinds of RAC and two specimens were cast with the same concrete mix. The steel bar details are shown in Fig. (3). Three coupons were taken from the longitudinal rebar to conduct the standard tensile coupon tests, as seen in Fig. (4). From these tests, the measured average yielding strength, tensile strength and modulus of elasticity of the rebar was 327MPa, 438MPa and 2.04×10⁵MPa respectively.
2.4. Freeze-thaw Test
After 28 days curing with condition of 20±3°C and 95% RH (relative humidity), the specimens were subjected to freeze-thaw cycles according to “Standard for test methods of long-term performance and durability of ordinary concrete” GB/T50082-2009 [16].
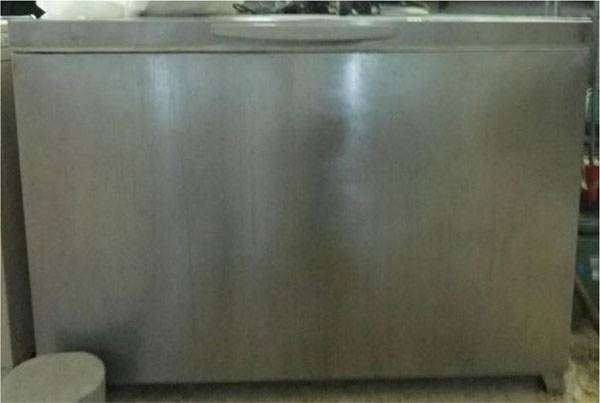
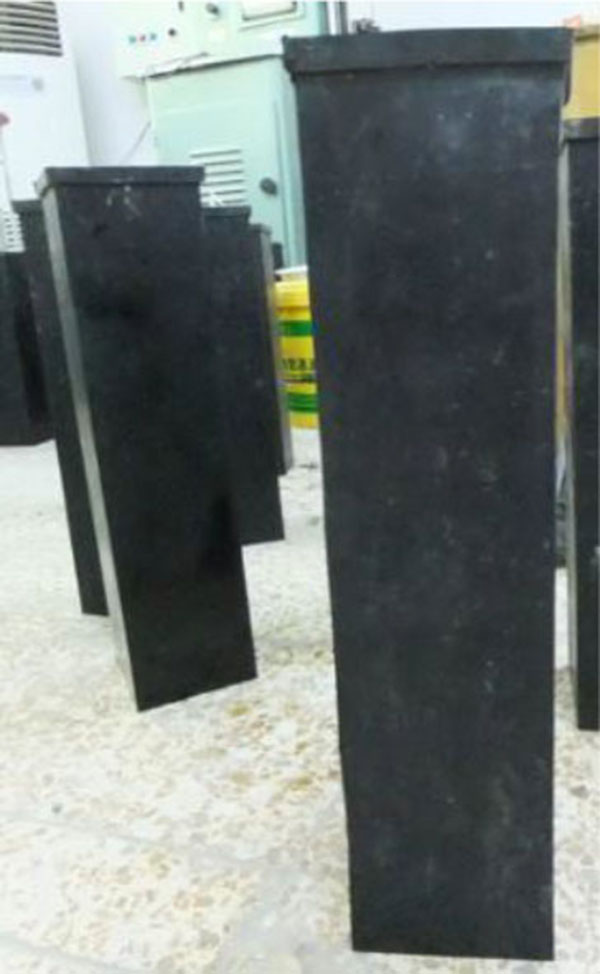
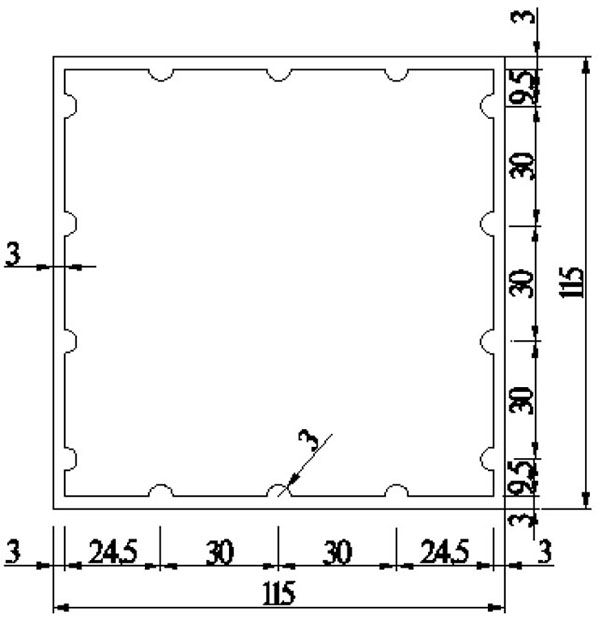
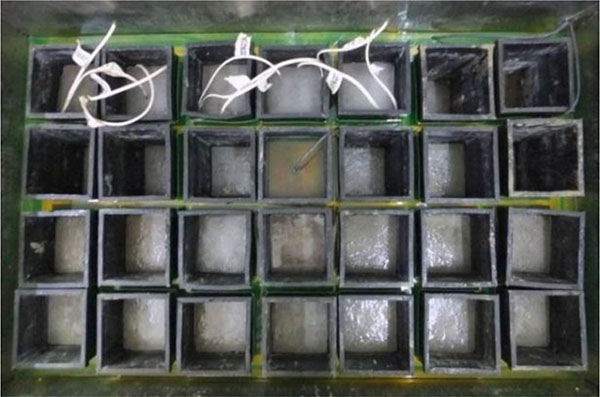
The accelerated freeze-thaw test as recommended by GB/T50082-2009 is water freezing and water thawing method, that is, all specimens are soaked in water for rapid freezing and thawing. Based on the standards, 2~4h for each freeze-thaw cycle is required, and the test time in this study is controlled around 3 hours. Simultaneously, the central temperature of specimens should be controlled within (-18±2)̊C at the lowest temperature and (5±2)̊C at the highest temperature. The freeze-thaw behaviors of RAC is conducted with the KDR-V5 testing machine, as shown in Fig. (5). The specimens were first inserted in rubber specimen boxes with the size of 115×115×500mm3. The rubber specimen box and its cross section dimensions are presented in Figs. (6 and 7). Then, clean water was poured into the rubber specimen box, and the water surface is 5mm above the upper face of specimens. Finally, the rubber specimen boxes were put into the test machine Fig. (8) and the freeze-thaw test started. After 100 freeze-thaw cycles, the compressive strength of cubes and prisms were measured and compared with the responding specimens without freeze-thaw experiment.
3. RESULTS AND DISCUSSION
3.1. Cubic Compressive Strength
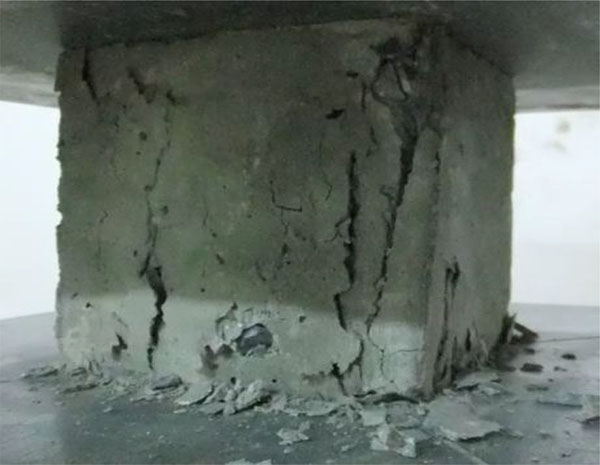
After the completion of 100 freeze-thaw cycles, the failure mode of cube specimens with different replacement ratios of RCA and RFA was similar to that of specimens without freeze-thaw action. During the process of loading, vertical cracks first appeared at the corners and extended upward and downward quickly, this increased the damage of the angular range. As the load increasing, vertical cracks began to appear in succession at the middle position of each side. Subsequently, the middle part of concrete was gradually crushed and peeled, which results in the loss of load-carrying capacity and the final failure, as seen in Fig. (9).
After 100 freeze-thaw cycles, the ultimate strength of cubes decreased when compared to the same mix proportion concrete cubes without freeze-thaw test. The main reason for this phenomenon is that, under the action of freezing and thawing, the ice pressure leads to the accumulation and development of the initial micro cracks inside the concrete. With the increasing load, the initial cracks developed fast. Consequently, the compressive strength decreased, and the decline was associated with the substitution ratio of RCA and RFA.
The measured compressive strength of RAC is given in Table (3). fc0 and fc100 is the average strength of three samples before and after 100 freeze-thaw cycles respectively. Δfc is variation ratio of compression strength after freeze-thaw test.
| Specimen Number | fc0 (MPa) | fc100 (MPa) | Δfc (%) |
|---|---|---|---|
| RC-0-0 | 30.80 | 27.60 | 10.4 |
| RC-0.5-0 | 29.20 | 24.94 | 14.6 |
| RC-0-0.5 | 27.67 | 22.50 | 18.7 |
| RC-0.5-0.5 | 25.40 | 18.59 | 26.8 |
| RC-1-0 | 28.40 | 22.41 | 21.1 |
| RC-0-1 | 31.76 | 22.90 | 27.9 |
| RC-1-0.5 | 31.40 | 21.29 | 32.2 |
| RC-0.5-1 | 30.50 | 20.19 | 33.8 |
| RC-1-1 | 29.53 | 17.19 | 41.8 |
As shown in Table (3), the compressive strength of RAC with different replacement ratio of recycled aggregate, on the whole, is lower than that of NC, except specimen RC-0-1 and RC-1-0.5. It seems that the compressive strength is not affected by the incorporation of recycled aggregates. This is completely contradictory to the other previous researches [5-7]. The reason lies in the same water consumption, as seen in Table (2). The effective water/cement ratio of RAC is lower than that of NCA, due to the higher water absorption of recycled aggregates. Therefore, although there are some defects in recycled aggregates, the compressive strength of RAC is very close to that of NAC. Considering the higher water absorption of recycled aggregates, many researchers took different measures to compensate the water that recycled aggregates absorb. Some recommended pre-saturating the aggregates [17, 18], others recommended immersion in water for 30 minutes [19], the rest advised adding more water during the concrete production, in order to obtain the same effective w/c ratio. However, not only the lower strength but the higher water absorption, they both are the characteristics of recycled aggregates. If the additional water were added, it is hard to judge who caused the change of mechanical properties of RAC. Therefore, no correction of water was done in this research to study the effects of different substitution rate on the compression performance of RAC.It can also be seen in Table (3) that, after exposure to 100 freeze-thaw cycles, the loss rate of compressive strength (LRCS) of NC is minimum(10.4%), and the LRCS of the remaining specimens in an order from small to large is RC-0.5-0, RC-0-0.5, RC-1-0, RC-0.5-0.5, RC-0-1, RC-1-0.5, RC-0.5-1, and RC-1-1. When the coarse and fine aggregates were totally replaced by recycled aggregates, the LRCS of RC-1-1 was up to the maximum as 41.8%. It can also be found that the interface damage is more complex and serious than that of other specimens.
This may be explained by the higher water absorption (WA) of recycled aggregate. A lot of research results show that the WA of RCA and RFA is generally 3.6%-8.0% and 8.3%-12.1% respectively, while natural rock is always lower than 3% [20]. Therefore, with the increasing replacement rate of RCA and RFA, recycled concrete is easier to damage under the inside pressure during the process of freezing and thawing, so the compressive strength decreased with the increasing contents of recycled aggregate.
3.2. Reinforced Concrete Prisms
3.2.1. Surface Scaling
Eighteen reinforced recycled concrete prisms with nine kinds of RAC were exposed to freeze-thaw test. The appearance change was observed and the loss of quality was measured after every 25 freeze-thaw cycles according to the standard of GB/T50082-2009. The test results showed that the damage phenomena and characteristics of RAC specimens were similar to those of NAC specimens, but the extent of damage and values in terms of mass loss were different. After 25 cycles, only a small amount of cement paste peeled off and the degree of exfoliation deepened gradually with the increasing freeze-thaw cycles; meanwhile, the surface mortar began to peel and became more and more serious. At the end of test, coarse aggregates shed at the ends of prisms, while the degree of spalling was slightly different, owing to the different replacement rate. However, this phenomenon did not occur for ordinary concrete specimens.
3.2.2. Mass Loss
The measured mass loss rate of nine kinds of RAC after every 25 freeze-thaw cycles is shown in Fig. (10).
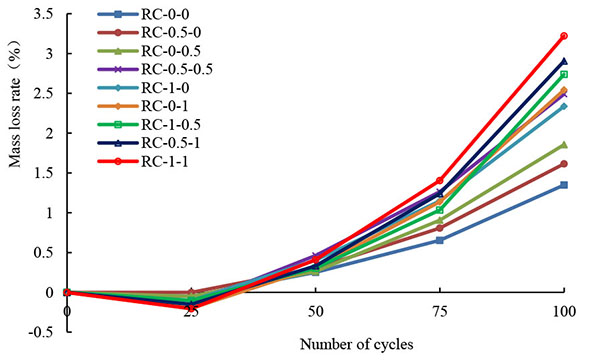
As clearly shown in Fig. (10), after 25 freeze-thaw cycles, the mass loss rate was negative, that is, the quality seems to be growing slightly. Because the specimens were soaked in water for 96h before the freezing and thawing test, a little bit water can penetrate into interior of the specimens as a result of the initial cracks and other defects. Then the specimens were put into the freeze-thaw testing machine and in the state of totally water immersion, which means the specimens were always in the environment of water freezing and water thawing cycles. After 25 freeze-thaw cycles, the specimens were taken out from the rubber box and wiped the surface water before weighing. The mass loss on the surface was relatively light, only a small amount of fine particles shedding, and the overall weight of shedding particles was less than that of the invasion water. Therefore, the phenomenon of negative mass loss rate occurred. It must be pointed out that the negative mass loss rate does not mean that the weight of the test specimen increases. In fact, the loss of the small particles is still a mass loss. During the following 50, 75 and 100 cycles, the effect of the weight of invasion water on the mass loss rate decreased, owing to the gradually increasing weight of the shedding particles. Consequently, the mass loss rate markedly increased with the increasing cycles of freezing and thawing.
It can also be found that the mass loss rate increases with the increase of substitution percentage of recycled aggregate. After 100 cycles, the mass loss rate of the totally recycled concrete (RC-1-1) was the largest, which is about 2.39 times of that of ordinary concrete.
3.2.3. The Bearing Capacity
The strength failure experiment of 36 reinforced recycled concrete (RRC) prisms under axial load was carried out to study the residual bearing capacity after 100 freeze-thaw cycles. In the early stage of loading, there was no obvious change on the surface of specimens. However, with the increasing load, longitudinal micro cracks first appeared at the mid span and continuously extended, which led to the complete loss of load-bearing capacity.
According to the current standard method [21], the compression bearing capacity of reinforced concrete columns can be described as:
 |
(1) |
where N is the bearing capacity under axial load;
The predicted load-carrying capacity (Nuc) and the experiment results (Nue) are presented in Table (4). The strain of steel bar of specimen RC-0-1-2 did not reach the yield strain when loading till failure. The specimen lost the bearing capacity quickly, attributing to the crushed concrete at the loaded end. Therefore, the ultimate strength of specimen RC-0-1-2 was not listed in Table (4). It can be seen from Table (4) that the absolute value of errors from test results and calculated results are within 10%. It may indicate that Equation (1) is also applicable to compression specimens with recycled concrete.
| No. | Specimen code | fc (MP) | Nue (kN) | Average of Nue (kN) | Nuc (kN) | Error (%) |
|---|---|---|---|---|---|---|
| 1 | RCC-0-0-1 | 22.24 | 278.59 | 284.00 | 259.29 | 8.70 |
| RCC-0-0-2 | 289.42 | |||||
| 2 | RCC-0.5-0-1 | 21.08 | 274.34 | 270.25 | 248.90 | 7.90 |
| RCC-0.5-0-2 | 266.15 | |||||
| 3 | RCC-0-0.5-1 | 19.98 | 251.49 | 249.00 | 238.98 | 4.02 |
| RCC-0-0.5-2 | 246.52 | |||||
| 4 | RCC-0.5-0.5-1 | 18.34 | 218.06 | 221.75 | 224.20 | -1.10 |
| RCC-0.5-0.5-2 | 225.43 | |||||
| 5 | RCC-1-0-1 | 20.50 | 255.75 | 258.25 | 243.70 | 5.63 |
| RCC-1-0-2 | 260.75 | |||||
| 6 | RCC-0-1-1 | 22.93 | 280.00 | 280.00 | 265.52 | 5.17 |
| RCC-0-1-2 | ------- | |||||
| 7 | RCC-1-0.5-1 | 22.67 | 251.38 | 257.00 | 263.19 | -2.41 |
| RCC-1-0.5-2 | 262.63 | |||||
| 8 | RCC-0.5-1-1 | 22.02 | 271.45 | 279.50 | 257.38 | 7.91 |
| RCC-0.5-1-2 | 287.55 | |||||
| 9 | RCC-1-1-1 | 21.32 | 227.59 | 231.25 | 251.02 | -8.55 |
| RCC-1-1-2 | 234.90 |
The measured residual bearing capacity of RRC specimens after 100 freeze-thaw cycles is listed in Table (5). N0 and N100 is the average bearing capacity of two specimens before and after 100 freeze-thaw cycles respectively. The bearing capacity loss ratio (ΔN) can be defined as [16]:
| No. | Specimen code | Residual strength (kN) | N100 (kN) | N0 (kN) | ΔN (%) |
|---|---|---|---|---|---|
| 1 | RCC-0-0-1 | 250.36 | 257.25 | 284.00 | 9.42 |
| RCC-0-0-2 | 264.15 | ||||
| 2 | RCC-0.5-0-1 | 224.55 | 229.00 | 270.25 | 15.26 |
| RCC-0.5-0-2 | 233.46 | ||||
| 3 | RCC-0-0.5-1 | 198.78 | 203.00 | 249.00 | 18.47 |
| RCC-0-0.5-2 | 207.23 | ||||
| 4 | RCC-0.5-0.5-1 | 170.69 | 179.75 | 221.75 | 18.94 |
| RCC-0.5-0.5-2 | 188.80 | ||||
| 5 | RCC-1-0-1 | 199.87 | 206.25 | 258.25 | 20.14 |
| RCC-1-0-2 | 212.64 | ||||
| 6 | RCC-0-1-1 | 222.35 | 219.50 | 280.00 | 21.61 |
| RCC-0-1-2 | 216.65 | ||||
| 7 | RCC-1-0.5-1 | 190.65 | 198.00 | 257.00 | 22.96 |
| RCC-1-0.5-2 | 205.36 | ||||
| 8 | RCC-0.5-1-1 | 204.37 | 209.76 | 279.50 | 24.96 |
| RCC-0.5-1-2 | 215.15 | ||||
| 9 | RCC-1-1-1 | 150.63 | 148.26 | 231.25 | 35.89 |
| RCC-1-1-2 | 145.89 |
 |
(2) |
As shown in Table (5), the ultimate strength of RRC specimens subjected to 100 freeze-thaw cycles is much lower than that of the corresponding specimen without freeze-thaw test. Specimen RC-0.5-0 has the closest loss rate of the bearing capacity compared with specimen RC-0-0. From the experimental results, it can be found that the freeze-thaw action has a significant adverse effect on the load-carrying capacity. Furthermore, RFA has greater impact on the bearing capacity than RCA under the condition of same replacement ratio. Thus, it is advisable to adopt RCA in cold regions and the appropriate replacement rate is 30%-50%. If it is less than 30%, it may have negative effects on the promotion of RAC. But if more than 50%, it is hard to ensure the freeze-thaw resistance of RAC. At present, the production capacity of recycled aggregates is far less than that of natural aggregates, so the suggested replacement rate is suitable for the current construction of recycled aggregate resources.
CONCLUSION
- Freeze-thaw action decreases the cubic compressive strength of concrete, and the reduction extent increases with increasing replacement ratio of recycled aggregate. Under the same replacement ratio, the strength loss caused by RCA is lower than that by RFA.
- Appearance damage, mass loss and the bearing capacity loss intensifies with the increase of freeze-thaw cycles and substitution rate of recycled aggregate.
- No obvious difference was found between normal concrete and RAC with 50% substitution of RCA on mass loss and the residual load-carrying capacity. Recycled concrete with 30%-50% substitution of RCA and natural fine aggregate is suggested for concrete structures in cold areas.
ETHICS APPROVAL AND CONSENT TO PARTICIPATE
Not applicable.
HUMAN AND ANIMAL RIGHTS
No Animals/Humans were used for studies that are base of this research.
CONSENT FOR PUBLICATION
Not applicable.
CONFLICT OF INTEREST
The authors confirm that this article content has no conflict of interest.
ACKNOWLEDGEMENTS
The authors are grateful for the financial support received from the National Natural Science Foundation of China (51608179), Key Scientific Research Projects of Education Department of Henan Province (17A560024) and the Doctoral Scientific Fund of Henan Polytechnic University (B2016-66).


