All published articles of this journal are available on ScienceDirect.

Creation of Similarity Requirement with Field Equations in Steel Bearing Systems
Abstract
Introduction:
This paper aimed to determine the structural behavior of steel bearing systems by creating similarity conditions with field equations. Scaling plays a crucial role in designing experiments aimed at understanding the structural behavior of systems where experimental studies are difficult to perform due to huge structures in the profession of engineering field. Scaling can be performed by using dimensional analysis or by normalizing differential equations that describe the dynamics of the system. If a model and prototype are dimensionally similar, it is possible to estimate experimental results from model to prototype.
Methods:
The use of scaled models is common on engineering applications because these models allow conducting experimental tests without the need of a physical system (i.e. prototype) to be constructed. Considering these advantages mentioned in this study, it is formed a similarity relation between prototype and scaled models of different steel bearing systems is established. Similarity relationships between systems are created by field equations. As an example, column and cantilever beams were selected and 1/2 and 1/4 scale procedure was applied.
Results and Conclusion:
The results obtained by finite element models in SAP2000 program for each system were compared with analytical results. The analysis results were examined and it was determined that scale factors are constant depending on scale types for different bearing systems. In addition, the influence diagrams of the systems were also examined and it was observed that the scale factor was fixed.
1. INTRODUCTION
Full-scale constructions have been designed and built on a small-scale in order to carry out experimental studies of the structures. Zhou et al. [1] have conducted experimental studies by producing scaled models in order to investigate the cracks that occur due to earthquake motions in the arch dam designed the earthquake acceleration which the possibility of which is expected to increase by 10% in the coming 500 years. Jiang and Shu [2] investigated on the effects of gun voices around the military area. For this purpose, using scaled models created in the laboratory environment with different acceleration records on the shake table, they examined the changes in dynamic characteristics. Oliveira and Faria [3] aimed to determine damage levels for arch dams in a study conducted using small scaled models. To this end, they built the 1/250 scaled models of the Alqueva and Alto Lindoso Arch Dam of 96 and 110 m height, respectively in the laboratory. To study the earthquake behavior of a dam with an arch height of 278m and a crest length of 612.5m in China, a 1/300 scaled model of the dam was constructed in the laboratory environment, including reservoir-ground interaction by Wang and Li [4]. Wang and He [5] investigated the effects of cracks occurring in arch dams with natural frequencies along with experimental studies conducted on large scaled models. In the scope of the study, a single curved arch dam was designed at an arch height of 80m and crest length of 209m. Wang and Li [6] constructed the laboratory model of the dam by considering the dam-foundation-reservoir interaction in order to experimentally study the earthquake behavior of Xiao Wan Arch Dam which has the 292m height in China. There are many experimental studies using scaled models in laboratory environment [7-11].
Dimensional analysis is used to determine the relationship between the prototype and the scaled model. Buckingham Pi Theorem is often used in many theoretical studies to determine this relationship. Carpinteri and Corrado [12] investigated structural behaviors such as cracking or fracture of concrete and yielding or rupture of reinforced during the loading process in reinforced concrete and yielding or rupture during the loading process in reinforced concrete beams subjected to bending effect by means of dimensional analysis. Ramu et al. [13] aimed to improve the rules of scaling with respect to Buckingham Π Theorem and the similarity criteria. In the study, it is stated that scaled models similar to prototype can be created and uploaded. Balaguer and Claramonte [14], in the work presented, investigated importance, advantages and the goals of dimensional analysis in detail. It is correlated in between prototype and scaled models that created with Buckingham Pi Theorem. Ghosh [15] has dwelled on areas of usage of scaled models and has stated general descriptions. Balawi et al. [16] aimed at examining the scaling rules based on the theory of similarity in plates and beams under low velocity impact and static loading. In this study, in order to ensure compliance with prototypes, the scaled factor is presented as the ratio of each change in the scaled models. With established similarities between systems, it is stated that various equations written for a system apply to all systems, and that in many cases it is impossible to establish complete similarity between model and prototype.
Steel bearing system is studied by taking the scaling principles into consideration. In the scope of the study, 1/2 and 1/4 scaled models of steel column and console prototypes were created. Dynamic characteristics and structural behavior between prototypes and models were investigated.
2. SCALING, SIMILARITY AND DIMENSIONAL ANALYSIS
Scaling is the size reduction of large elements or systems and the size of small elements or systems by expanding them in a certain ratio. The aim of the scaling is to facilitate the work by making the hard and time-consuming systems smaller and simpler to test. Examining and testing of large structures (prototype) as multi-story buildings, dams and airports is a very expensive, time-consuming and difficult-to-control process. For this reason, it is very easy and convenient to do the study on the small models created by scaling the prototype. Owing to the similarity between the prototype and the model, the results obtained from the small model will be evaluated so that the behavior of the prototype can be predicted. The aim of similarity analysis is to reveal the relation between large and expensive systems by using information obtained from experiments of small models. There are some similarity laws that are used to accomplish this. Equality or relativity of variables written for a system is valid for all systems. Each variable in a model is proportional to the corresponding variable in the prototype.
Analytical and experimental studies are carried out to solve a problem. The solution of the problem is investigated firstly analytically. Then experimental measurements are made to check the accuracy of the results. The most suitable scales are used according to the dimensions of the systems in laboratory studies. There are two ways to relate the prototype with the scaled model. Similarity conditions, if there is a mathematical model of the system, are derived from the related field equations, or if the mathematical model of system is not valid, by means of dimensional analysis. In dimensional analysis, all parameters and variables that affect the behavior of the system have to be known. The equation created by dimensional analysis is the dimensionless product of system parameters and variables. Thus the similarity condition can be created by the obtained equation. Experimental studies, which are an important step in comparing and confirming correctness of results, require careful examination of experimental data. The main purpose of experimental studies is to obtain maximum information with the least experimentation. In line with this purpose, dimensional analysis is used. Dimensional analysis is a method used to reduce the number and complexity of experimental variables affecting a physical phenomenon considered.
The generalization of empirical formulas and diagrams obtained from experimental studies is very important in terms of applications in which the system with different dimensions is used. One of the main purposes of dimensional analysis is to establish experimental studies that will provide this generalization. In an experimental study, there may be dimensionless quantities that define the relationship between a large number of parameters affecting a studying. For this purpose, dimensional analysis is a method which has an effect on the interpretation of results with fewer parameters, and also provides ease of operation.
2.1. Creation a Similarity Formula With the Aid of Mathematical Models
With the field equations of the bearing systems, the characteristic properties and structural behaviors of the systems can be calculated. The frequency of systems varies in proportion to the stiffness. The stiffness values of some bearing systems are given in Table 1.
| Bearing Systems | Rigidity (k) |
|---|---|
Simple Beam 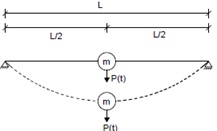
|
 |
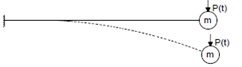 Cantilever Beam |
 |
 Cantilever Beam Cantilever Beam |
 |
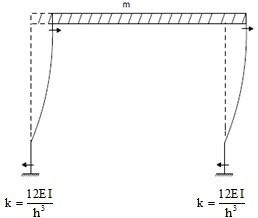 Frame |
 |
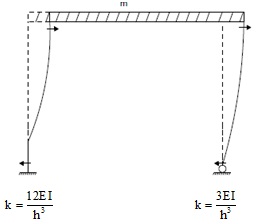 Frame Frame |
 |
The displacement relationships, which are an expression of the structural behavior of the system, are given in Table 2 for some carrier systems.
| Bearing Systems | Displacement |
|---|---|
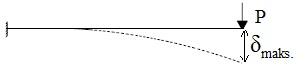 Cantilever Beam |
 |
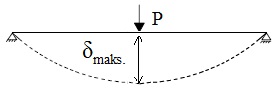 Simple Beam Simple Beam |
 |
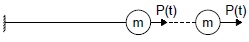
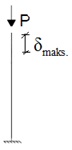 Column |
 |
In the study carried out on the steel bearing systems, the sizes available in the steel tables are used because each dimension of the steel profiles cannot be scaled in the desired area. A geometric and mass scaled is applied as scaling type.
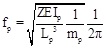
Frequency equations for bearing systems;
For symmetrical profiles
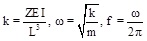 |
(1) |
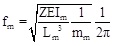
For non-symmetrical profiles
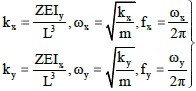 |
(2) |
are expressed (Eqs. 1-2). Where, Z, E, I, L, m and x-y are a coefficient, Modulus of Elasticity, the moment of inertia, the profile length, mass and the axis directions of the system, respectively. When these expressions are written in the frequency equation for prototype and model,
for prototype;
 |
(3) |
for model;
 |
(4) |
Eqs. (3-4) are obtained. With the application of the similarity condition between prototype and model frequency equations,
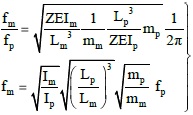 |
(5) |
Eq. (5) is obtained. Assuming that the mass is kept constant, the relation is mp = mm,
 |
(6) |
Eq. (6) is obtained.
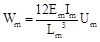
For displacement equations;
 |
(7) |
Eq. (7) is obtained. Where, U, F, K, V,, E, I, Z and L are displacement, force (mass of system), rigidity, volume, density, Modulus of Elasticity, Moment of Inertia, a coefficient and length, respectively.
For prototype:
 |
(8) |
For model:
 |
(9) |
(Eqs. 8-9) is obtained. With the application of the similarity condition
 between prototype and model,
 |
(10) |
Eq. (10) is obtained. With the application of the scale factor
 in Eq. (10)
 |
(11) |
Eq. (11) is obtained. Assuming that the mass is kept constant, the relation is mp = mm,
 |
(12) |
Eq. (12) is obtained.
With the necessary simplifications, equations of frequency and displacement shows the most general situation. These generalized equations that reflect the relationship between prototype and model are applied to different systems.
3. OBTAINING OF DYNAMIC CHARACTERISTICS AND STRUCTURAL BEHAVIOR
3.1. Finite Element Analysis
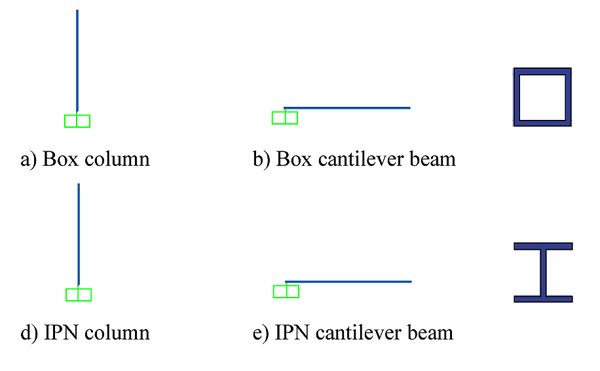
Column and cantilever beams are selected for application of the scale effect in steel bearing systems. The fact that profiles are factory-made disallows them from being reduced in terms of size in all dimensions of system in case of scaling. For this reason, the dimensions in the steel tables are selected and processed. In the studies done in box and I profiles, 1/2 and 1/4 scaled models have been used. The properties of I profiles are presented in Table 3.
| I Profiles | Weight (kN) | Mass (kNs2/m) | Moment of Inertia (m4) | ||
|---|---|---|---|---|---|
| Dimension (mm) | Length (m) | IX | IY | ||
| IPE400 | 2 | 1.3002756 | 0.1325459327 | 1.318E-6 | 2.313E-4 |
| IPE200 | 1 | 0.2196544 | 0.0223986646 | 1.420E-6 | 1.943E-6 |
| IPE100 | 0.5 | 0.0397143 | 0.0040483486 | 1.59E-7 | 1.71E-6 |
The unit length weights (G, kg/m) for I profiles are given in the steel tables. The weight of the selected profile is calculated by unit height. Since the weights of the unit height of the selected box profiles are not included in the tables, the weights of the selected profiles are calculated from specific formulas.
Unit length weights for box profile (kg/m);
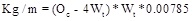 |
(13) |
calculated using Eq. (13) [17]. Where, Oc and Wt are outer diameter and wall thickness, respectively (Fig. 1).
for square section: oc = 4a
for rectangular section: oc = 2a + 2b
is obtained.
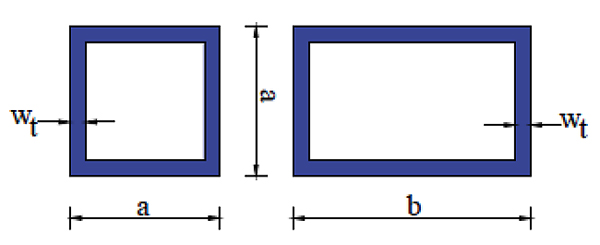
400x400x8 mm unit weight of box profile;
 |
(14) |
Eq. (14) is solved. 2m long box profile weight,
 |
(15) |
was calculated by (Eq. 15). By dividing the weight of the profile into gravity acceleration,
 |
(16) |
Eq. (16) was calculated. The masses of the other box profiles were calculated and presented in Table 4.
| Box Profiles | Weight (kN) | Mass (kNs2/m) | Moment of Inertia (m4) | ||
|---|---|---|---|---|---|
| Dimension (mm) | Length (m) | ||||
| 400x400x8 | 2 | 1.931201877 | 0.1968605379 | 3.214E-4 | 400x400x8 |
| 200x200x4 | 1 | 0.2414001856 | 0.02460756224 | 2.009E-5 | 200x200x4 |
| 100x100x2 | 0.5 | 0.0301750232 | 0.00307594528 | 1.255E-6 | 100x100x2 |
The finite element models of the selected profiles were created with the Sap2000 [18] program. The finite element models for the systems are shown in Fig. (2).
3.2. Mathematical Model
Frequency and displacement values were obtained analytically by using mathematical models of systems. The steps of calculation of the frequency value obtained as a result of considering the prototype, 1/2 and 1/4 scaled model of the column that is box profile are presented as follows:
The prototype Data of the Column
Dimensions 400 ×400 × 8mm
E 2.1 E 8KN / m2
I 3.214 E- 4m4
L 2m
The solution steps taken considering the above mentioned data are as follows. With the help of equation;
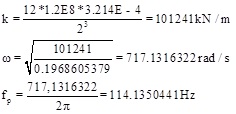 |
(17) |
Eq. (17) was solved.
1/2 Scaled Model Data of the Column
Dimensions 200 × 200 × 4mm
E 2.1E8KN / m2
I 2.009E- 5m4
L 1m
The solution steps taken considering the above mentioned data are as follows. With the help of equation;
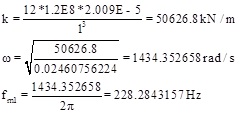 |
(18) |
frequency value was obtained (Eq. 18). When the obtained data were evaluated, the scale factor of the column;
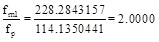 |
(19) |
was obtained Eq. (19).
1/4 Scaled Model Data of the Column
Dimensions 100 100 2mm
E 2.1E8KN / m2
I 1.255E - 6m4
L 0.5m
The solution steps taken considering the above mentioned data are as follows. With the help of Eq. (1);
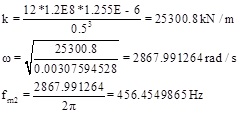 |
(20) |
frequency value was obtained (Eq. 20). When the obtained data were evaluated, the scale factor of the column;
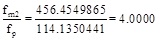 |
(21) |
was obtained Eq. (21).
The steps of calculation of the displacement values obtained as a result of considering the prototype, 1/2 and 1/4 scaled model of the cantilever beam that is box profile are presented as follows:
The prototype Data of the Cantilever Beam
Dimensions 400 × 400 × 8mm, 2m
Modulus of Elasticity E = 2.1E8KN / m2
System displacement

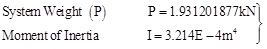 Table 4.
The solution steps taken considering the above mentioned data are as follows. With the help of displacement equation for cantilever beam;
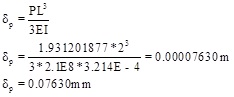 |
(22) |
was obtained displacement value which is given in Eq. (22). P load according to bulk mass acceptance is applied as system weight.
1/2 Scaled Model Data of Cantilever Beam
Dimensions 200 × 200 × 4mm, 1m
Modulus of Elasticity E = 2.1E8KN / m2
System displacement
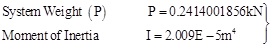 Table 4
The solution steps taken considering the above mentioned data are as follows. With the help of displacement equation for cantilever beam;
 |
(23) |
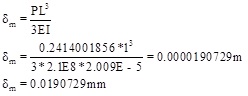
displacement value is obtained (Eq. 23). P load according to bulk mass acceptance is applied as system weight. When the obtained data are evaluated, the scaled factor of the cantilever beam;
 |
(24) |
was obtained (Eq. 24). The displacement values of the other systems are presented in next chapter.
3.3. Comparison of Results Obtained
The frequency values of the all bearing systems are presented in detail in Tables 5, 6, 7 and 8 for different scaling types of the results of finite element analysis and mathematical formula.
| Box Profile | |||||||
|---|---|---|---|---|---|---|---|
| Scale Types |
Bearing System Elements |
Finite Element Analysis Results (Hz) | Analytical Results (Hz) | ||||
| Prototype | 1/2 Scaled Model |

|
Prototype | 1/2 Scaled Model |
|
||
| Geometric | Column | 107.8369 | 76.2516 | 0.7071 | 114.1350 | 80.7107 | 0.7072 |
| Beam | 54.4533 | 38.5043 | 0.7071 | 57.0675 | 40.3553 | 0.7072 | |
| Geometric and Mass |
Column | 107.8369 | 215.6722 | 2.0000 | 114.1350 | 228.2843 | 2.0000 |
| Beam | 54.4533 | 108.9067 | 2.0000 | 57.0675 | 114.1422 | 2.0000 | |
| Box Profile | |||||||
|---|---|---|---|---|---|---|---|
| Scale Types |
Bearing System Elements |
Finite Element Analysis Results (Hz) | Analytical Results (Hz) | ||||
| Prototype | 1/4 Scaled Model |
|
Prototype | 1/4 Scaled Model |
|
||
| Geometric | Column | 107.8369 | 53.9164 | 0.5000 | 114.1350 | 57.0569 | 0.5000 |
| Beam | 54.4533 | 27.2267 | 0.5000 | 57.0675 | 28.5284 | 0.5000 | |
| Geometric and Mass |
Column | 107.8369 | 431.3316 | 4.0000 | 114.1350 | 456.4550 | 4.0000 |
| Beam | 54.4533 | 217.8134 | 4.0000 | 57.0675 | 228.2275 | 4.0000 | |
| I Profile | |||||||||
|---|---|---|---|---|---|---|---|---|---|
| Scale Types |
Bearing System Elements |
Finite Element Analysis Results (Hz) | Analytical Results (Hz) | ||||||
| Prototype | 1/2 Scaled Model |
|
Prototype | 1/2 Scaled Model |
|
||||
| Geometric | Column | f1 | 28.4324 | 26.3891 | 0.9281 | 28.1676 | 26.1506 | 0.9284 | |
| f2 | 109.0094 | 89.1932 | 0.8182 | 117.9994 | 96.7328 | 0.8198 | |||
| Beam | f1 | 14.0369 | 13.0223 | 0.9277 | 14.0838 | 13.0753 | 0.9284 | ||
| f2 | 55.4655 | 45.3849 | 0.8183 | 58.9997 | 48.3664 | 0.8198 | |||
| Geometric and Mass |
Column | f1 | 28.4324 | 64.2054 | 2.2582 | 28.1676 | 63.6252 | 2.2588 | |
| f2 | 109.0094 | 217.0099 | 1.9907 | 117.9994 | 235.3539 | 1.9945 | |||
| Beam | f1 | 14.0369 | 31.6836 | 2.2572 | 14.0838 | 31.8126 | 2.2588 | ||
| f2 | 55.4655 | 110.4228 | 1.9908 | 58.9997 | 117.6770 | 1.9945 | |||
| I Profile | |||||||||
|---|---|---|---|---|---|---|---|---|---|
| Scale Types |
Bearing System Elements |
|
Finite Element Analysis Results (Hz) | Analytical Results (Hz) | |||||
| Prototype | 1/4 Scaled Model |
|
Prototype | 1/4 Scaled Model | |||||
| Geometric | Column | f1 | 28.4324 | 24.9502 | 0.8775 | 28.1676 | 24.7503 | 0.8787 | |
| f2 | 109.0094 | 75.1150 | 0.6891 | 117.9994 | 81.1671 | 0.6879 | |||
| Beam | f1 | 14.0369 | 12.3147 | 0.8773 | 14.0838 | 12.3752 | 0.8787 | ||
| f2 | 55.4655 | 38.1692 | 0.6881 | 58.9997 | 40.5835 | 0.6879 | |||
| Geometric and Mass |
Column | f1 | 28.4324 | 142.7637 | 5.0212 | 28.1676 | 141.6201 | 5.0277 | |
| f2 | 109.0094 | 429.8042 | 3.9428 | 117.9994 | 464.4345 | 3.9359 | |||
| Beam | f1 | 14.0369 | 70.4643 | 5.0190 | 14.0838 | 70.8101 | 5.0277 | ||
| f2 | 55.4655 | 218.4021 | 3.9376 | 58.9997 | 232.2176 | 3.9359 | |||
As can be seen from the results, the scale factors (fm / fp) between different systems with the same scale are constant.
The displacement values of the other bearing systems are presented in detail in Tables 9, 10, Table 11 and 12 for different scaling types of the results of finite element analysis and mathematical formula. As can be seen from the results, the scale factor (δm δp) between different systems with the same scale is constant.
| Box Profile | |||||||
|---|---|---|---|---|---|---|---|
| Scale Types |
Bearing System Elements |
Finite Element Analysis Results (mm) | Analytical Results (mm) | ||||
| Prototype | 1/2 Scaled Model |

|
Prototype | 1/2 Scaled Model |
|
||
| Geometric | Column | 0.00073 | 0.00147 | 2.0003 | 0.0007357 | 0.001466 | 2.0000 |
| Beam | 0.08377 | 0.16750 | 2.0000 | 0.0763 | 0.1526 | 2.0000 | |
| Geometric and Mass |
Column | 0.00073 | 0.00018 | 0.2500 | 0.0007357 | 0.0001833 | 0.2492 |
| Beam | 0.08377 | 0.02094 | 0.2500 | 0.0763 | 0.0191 | 0.2500 | |
| Box Profile | |||||||
|---|---|---|---|---|---|---|---|
| Scale Types |
Bearing System Elements |
Finite Element Analysis Results (mm) | Analytical Results (mm) | ||||
| Prototype | 1/4 Scaled Model |
|
Prototype | 1/4 Scaled Model |
|
||
| Geometric | Column | 0.00073 | 0.00293 | 4.0000 | 0.0007357 | 0.002932 | 3.9853 |
| Beam | 0.08377 | 0.3351 | 4.0000 | 0.0763 | 0.3053 | 4.0000 | |
| Geometric and Mass |
Column | 0.00073 | 0.0000458 | 0.0625 | 0.0007357 | 0.0000458 | 0.0623 |
| Beam | 0.08377 | 0.00522 | 0.0624 | 0.0763 | 0.0048 | 0.0625 | |
| I Profile | |||||||
|---|---|---|---|---|---|---|---|
| Scale Types |
Bearing System Elements |
Finite Element Analysis Results (mm) | Analytical Results (mm) | ||||
| Prototype | 1/2 Scaled Model |
|
Prototype | 1/2 Scaled Model |
|
||
| Geometric | Column | 0.00073 | 0.00109 | 1.4794 | 0.000733 | 0.001086 | 1.4816 |
| Beam | 0.08377 | 0.1206 | 1.4935 | 0.07138 | 0.10622 | 1.4880 | |
| Geometric and Mass |
Column | 0.00073 | 0.00018 | 0.2501 | 0.000733 | 0.000184 | 0.2510 |
| Beam | 0.08377 | 0.02037 | 0.2432 | 0.07138 | 0.01794 | 0.2514 | |
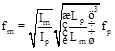
3.4. Application of Formulas Obtained by Formed Similarity
Calculation of the frequency value of the 1/2 scaled model by using the frequency value of the prototype box cantilever beam is as follows. If written, Ip = 3.214E- 4m4, Im = 2.009E- 5m4 (Table 4) and fp = 107,8369hz Table 5 in Eq. (6),
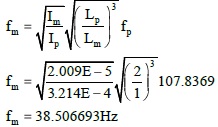 |
(25) |
Eq. (25) is obtained. This result obtained with Eq. (25) agrees with the 1/2 geometric scaled (constant mass) result presented for the box cantilever beam in Table 5.
| I Profile | |||||||
|---|---|---|---|---|---|---|---|
| Scale Types |
Bearing System Elements |
Finite Element Analysis Results (mm) | Analytical Results (mm) | ||||
| Prototype | 1/4 Scaled Model |
|
Prototype | 1/4 Scaled Model |
|
||
| Geometric | Column | 0.00073 | 0.001501 | 2.0466 | 0.000733 | 0.001503 | 2.0505 |
| Beam | 0.08377 | 0.170500 | 2.0353 | 0.07139 | 0.1509 | 2.1135 | |
| Geometric and Mass |
Column | 0.00073 | 0.000046 | 0.0625 | 0.000733 | 0.000459 | 0.0626 |
| Beam | 0.08377 | 0.005208 | 0.0622 | 0.07139 | 0.0046 | 0.0646 | |
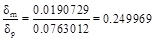
Calculation of the displacement value of the 1/2 scaled model by using the displacement value of the prototype box cantilever beam is as follows. If written Ip = 3.214E - 4m4, Im = 2.0009E - 5m4 Table 4 and p = 0.08377mm Table 8 in Eq. (12);
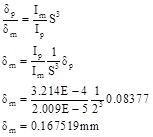 |
(26) |
Eq. (26) is obtained. This result obtained with Eq. (26) agrees with the 1/2 geometric scaled (constant mass) result presented for the box cantilever beam in Table 8.
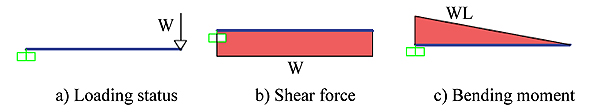
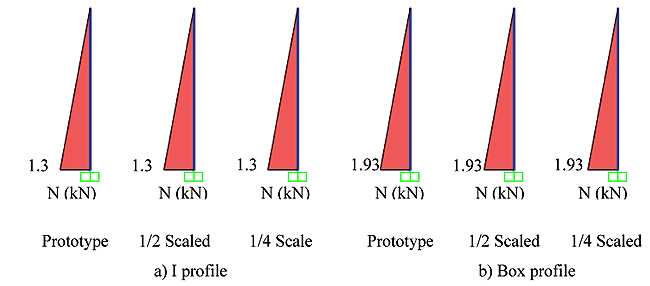
4. Effect of Scale Change on Influence Diagrams
The influence diagrams under the weight of the system at the column and cantilever beam are examined in Figs. (3-4). The relationship between the prototype and model with the field equations used to obtain the section effects was observed. The influence diagrams of the finite element models were examined and the existence of the relationship was determined.
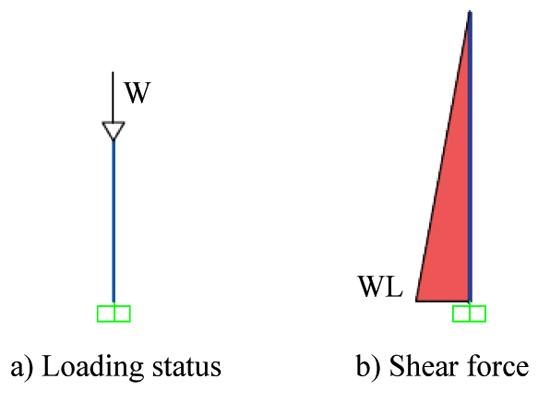
The parameters affecting axial force are system weight and column dimensions change.
The parameters affecting shear force and bending moment are system weight and beam length change.
The influence diagrams obtained from the finite element analysis are presented comparatively in Figs. (5, 6, 7 and 8).
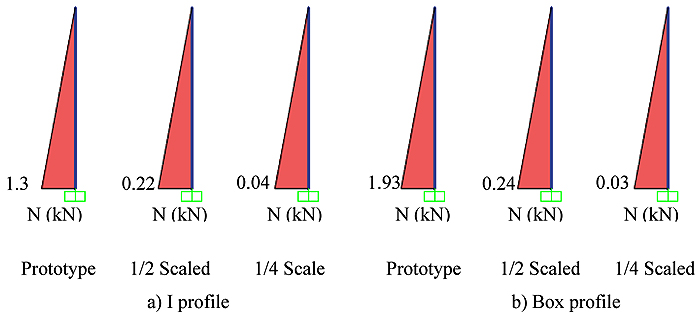
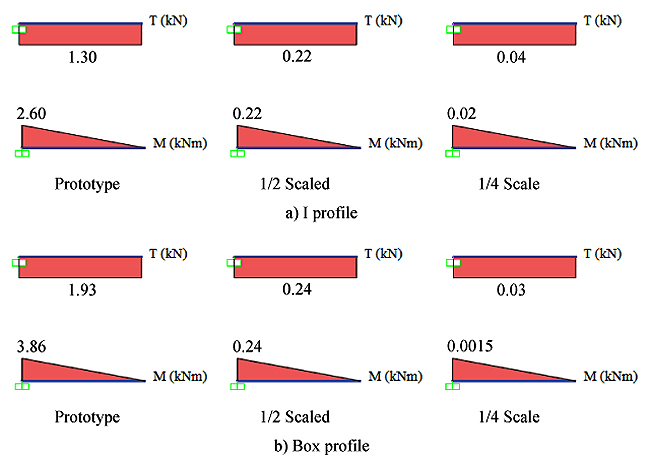
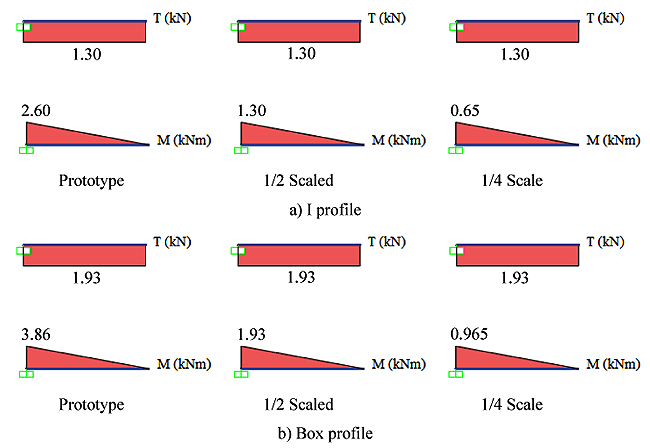
When the diagrams were examined, it was observed that changes were due to the scale type and scale ratio between the prototype and the model.
CONCLUSION
This study aimed to determine the characteristics properties and structural behaviors of steel bearing systems by establishing similarity relationship between prototype and scaled models. Column and cantilever beams were selected for application of the scale effect in steel bearing systems. The dimensions in the steel tables were selected and processed. In the studies carried out on box and I profiles, 1/2 and 1/4 scaled models were used. The finite element models of the selected profiles are created with the Sap2000 [18] program. Frequency and displacement values were obtained analytically by using mathematical models of systems. The frequency values of the all bearing systems are presented in detail for different scaling types of the results of finite element analysis and mathematical formula. As can be seen from the results, the scale factors (and) between different systems with the same scale are constant. Also, the influence diagrams obtained from the finite element analysis for different scaling types are presented comparatively. When the diagrams were examined, it was observed that changes were due to the scale type and scale ratio between the prototype and the model. For example, shear force is constant in geometric scale for box cantilever beam and bending moment changed with the changing of beam span. It was observed in this study that the characteristic properties and structural behaviors of the systems can be obtained establishing a similarity relation, by establishing small scaled models.
CONSENT FOR PUBLICATION
Not applicable.
CONFLICT OF INTEREST
The authors declare no conflict of interest, financial or otherwise.
ACKNOWLEDGEMENTS
Declared none..

