All published articles of this journal are available on ScienceDirect.
Preliminary Analysis of the Influence of Reinforced Mortar Coating on the Compressive Strength of Clay Bricks
Abstract
Introduction:
This paper presents an extensive characterisation of materials and components used in non-structural masonry constructions in the region of Pernambuco, Brazil.
Methods:
An experimental study was carried out on a running bond of red clay prisms, of two and three ceramic blocks, with and without cement mortar coating, subjected to axial compression in order to enhance the capacity of masonry.
Results and Conclusion:
The experimental preliminary results indicate an increase both in the compressive load capacity of the coated prisms and in those that use coatings based on reinforced mortar, not complying with the specifications of conventional structural mortar.
1. INTRODUCTION
The occurrence of diverse accidents in buildings constructed with resistant masonry in the Region Metropolitan of Recife (RMR) has drawn the attention of the regional and national technical community to adopt measures to minimize such events. This kind of masonry buildings has one of its most important characteristics, the use of non-structural units in masonry walls that will carry loading beyond its own weight. Such type of construction is found with relative frequency in under developing countries as public solutions to the housing deficit of these countries, namely in Recife, Brazil.
In this type of construction, nonload-bearing masonry, generally leaked ceramic blocks seated with the punctures in the horizontal line or blocks of concrete with low compressive strength (2.5 MPa) are used. This practical constructive had important impulse at the beginning of 80’s and its success had, to a large extent, is due to the lesser cost in relation to the workmanships with conventional reinforced concrete structure. In addition, one can add the rapidity in the execution, the great applicability and the low cost of producing the ceramic blocks and of concrete in the state of Pernambuco, in that occasion [ 1] as reasons for stimulating the growth of this type of building in the region.
Several pathological manifestations have been reported and in some cases, there have been reports collapses with human deaths. It is important to register that the problem in quarrel does not consist in a local exclusiveness, and is of the knowledge of the authors the existence of accident with similar characteristics in other cities of the country, such as Maceió and Belo Horizonte.
Even taking into account that this is not the only factor to be considered, it is important to note that since masonry structures are primarily stressed in compression, the compressive behaviour of masonry is of crucial importance for design and safety assessment purposes [ 2-4].
It is important in masonry design to determine the appropriate ultimate compressive strength of the masonry material. Masonry is a material built from units and mortar that induce an anisotropic behaviour for the composite. The lack of knowledge on the properties of the composite material imposes low assessments of the strength capacity of the masonry wall [5-8]. Atkinson et al., [9] state that the prediction of compressive strength and the deformation of full-scale masonry based on compressive tests of stack-bond masonry prism and the interpretation of the results of prism tests have a significant influence on the allowable stress and stiffness used in masonry design. Khalaf et al., [10] analysed the effect of different materials on the compressive strength and showed only an increase in the prism strength of about 20% produced by an increase of mortar strength of ungrouted prisms of 188% and 72%. An experimental investigation developed by Vermeltfoort [11] showed that further research is required for Poisson’s ratio of masonry controlling the lateral deformation of specimens. The author studied the brick-mortar interactions to explain the behaviour of masonry when submitted to compressive loading.
Despite the great interest, only a few studies have been carried out and published in Brazil on the influence of reinforced mortar coating on the compressive strength of clay brick masonry prisms.
2. MATERIALS AND METHODS
2.1. Geometrical Characteristics
The geometrical characteristics of the clay blocks, i.e, their shape and manufacturing dimensions, must meet the tolerances provided:
- − Face measures - Effective dimensions;
- − Thickness of the septa and external walls of the blocks;
- − Deviation from the square (D);
- − Face plane (F);
- − Gross area (Ab)
The apparatus required to carry out the measurements consisted of: digital calliper with a minimum sensitivity of 0.05mm, a metal ruler with a minimum sensitivity of 0.5mm, a metal bracket of 90 + 0.5º and a balance with a resolution of 10g, all of them were properly calibrated. The measurements of the block faces, the values of width (W), height (H) and length (L) were determined as shown in Fig. (1).
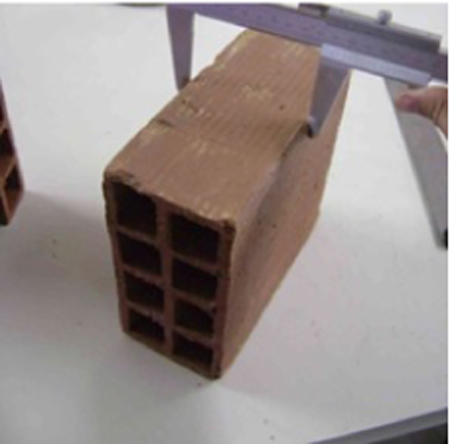
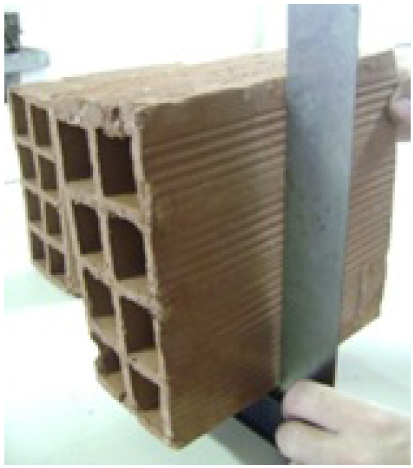
The septa measurements were made in the central region of the clay blocks, using at least four values, searching for the narrowest septa, as shown in Fig. (2a). The flatness of the faces was determined by the arrow formed in the diagonal of one of the facing faces of the block, according to (Fig. 2b).
Finally, the value of the gross area of each clay block was determined as shown in Table 1, together with all the data of the geometric characterization.
| Specimens | Face measures: Effective Dimensions (mm) | Thickness of the Septa and External Walls (mm) | Square Deviation (mm) |
Face Plane (mm) | Gross Area (cm2) |
|||||
|---|---|---|---|---|---|---|---|---|---|---|
| Width (W) | Height (H) | Length (L) |
Septa | External walls | D | F | Ab | |||
| 1 | 93 | 193 | 190 | 7 | 8 | 1 | 1 | 177 | ||
| 2 | 91 | 191 | 191 | 7 | 8 | 1 | 1 | 173 | ||
| 3 | 93 | 192 | 190 | 8 | 8 | 1 | 1 | 176 | ||
| 4 | 90 | 192 | 190 | 8 | 8 | 1 | 1 | 171 | ||
| 5 | 91 | 190 | 188 | 8 | 8 | 1 | 1 | 172 | ||
| 6 | 91 | 190 | 191 | 7 | 8 | 1 | 1 | 175 | ||
| 7 | 91 | 191 | 189 | 8 | 9 | 1 | 1 | 173 | ||
| 8 | 90 | 190 | 191 | 8 | 8 | 1 | 1 | 172 | ||
| 9 | 92 | 188 | 190 | 7 | 8 | 1 | 1 | 174 | ||
| 10 | 92 | 192 | 191 | 8 | 9 | 1 | 1 | 176 | ||
| 11 | 92 | 191 | 192 | 8 | 8 | 1 | 1 | 175 | ||
| 12 | 89 | 190 | 188 | 7 | 8 | 1 | 1 | 167 | ||
| 13 | 91 | 189 | 193 | 7 | 8 | 1 | 1 | 175 | ||
| Average | 91 | 191 | 190 | 8 | 8 | 1 | 1 | 174 | ||
| Tolerance NBR 15270-1 [13] (mm) | Individual | + | 5 | 5 | 5 | Minimum 6 |
Minimum 7 |
Maximum 3 |
Maximum 3 |
x |
| Average | + | 3 | 3 | 3 | ||||||
| non-conforming units | 0 | 0 | 0 | 0 | 0 | 0 | 0 | x | ||
2.2. Physical Characteristics
The physical characteristics of the ceramic blocks analysed were:
- Dry mass (mdry);
- Water absorption index (AA);
- Initial absorption index (AAI).
The equipment used for such determinations were balanced with a resolution of up to 5 g, oven with adjustable temperature and a tank for submersion of the samples. The number of samples established by the standard to determine these characteristics is equal to six specimens.
To determine the dry mass (mdry), the samples of the ceramic blocks were first cleaned for dust removal and other loose particles adhered to the block and identified, after which they were submitted to a temperature range of (105+5) °C up to the stabilization of the individual mass, when after two consecutive weighing, with intervals of 1 hour, did not differ by more than 0.25% of the weight, as shown in Fig. (3a).
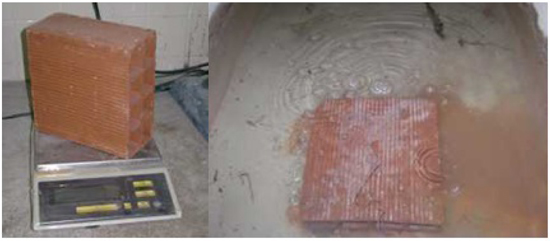
After the determination of the dry mass, the blocks were completely submerged in a tank with water at ambient temperature for a period of 24 hours and then they were removed and placed in a balance to determine the wet mass (mwet), after removal of excess water with a cloth (Fig. 3b).
The water absorption index (AA) of each specimen was calculated using the following expression in Eq. (1):
 |
(1) |
The determination of the initial absorption index (IRA) required, in addition to the equipment described above, a chronometer with a sensitivity of 1s, a bubble level ruler, a water reservoir that allows the maintenance of a (3 + 0.2) mm.
The samples were first subjected to heating in an oven for 24 h and after their removal, 2 hours were allowed for cooling in the open air until the ambient temperature. The geometric characteristics of the blocks were determined to obtain the contact area with the water slide. The blocks were positioned on the supports so that the contact face of the block remained in contact with the water slide at a height of 3 mm for a time of 1 min, then the block was removed and take out the excess water with the aid of a damp cloth to proceed with the weighing of the block.
The IRA is the water absorption index (suction) of the tested face of the blocks, expressed in (g/193.55cm2)/min and is calculated according to the expression in Eq. (2):
 |
(2) |
where ΔP is the wet mass change after 1 min (dried at room temperature). The properties of the clay bricks used in prism construction are presented in Table 2. All the samples used in testing had a net area that exceeded 75% of their gross area.
| Samples | IRA(1) |
Dry Mass (g) |
Compressive Strength(2) (MPa) |
|---|---|---|---|
| 1 | 6.9 | 2406 | 2.17 |
| 2 | 12.6 | 2320 | 2.10 |
| 3 | 9.2 | 2289 | 2.16 |
| 4 | 8.6 | 2338 | 2.12 |
| 5 | 17.4 | 2307 | 2.02 |
| 6 | 3.9 | 2403 | 2.04 |
| Average | 9.77 | 2331.4 | 2.05 |
| Standard deviation | ± 4.70 | ± 43.86 | ± 0.40 |
| COV(3) | 19% |
2.3. Mechanical Characteristics
The mechanical characteristics of the ceramic clay brick blocks were evaluated by individual compressive strength. For the accomplishment of this test, a total of 13 specimens were properly prepared. The regularization of the two faces destined to the settlement perpendicular to the block length was done with cement and a maximum thickness of 3 mm in order to uniformize the block surfaces.
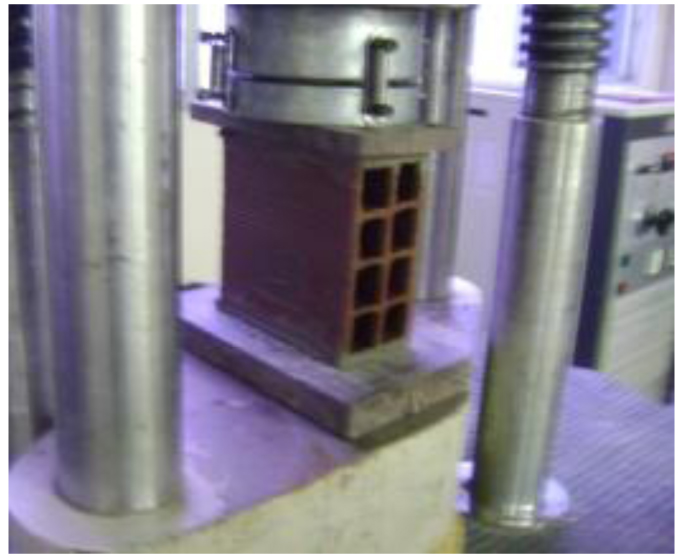
After hardening the capping layers, the specimens were completely submerged in a tank with water for a period not lesser than 6 hours, as established in the Brazilian standard NBR 15270-3 [12]. The specimens were tested in saturated conditions and placed in the press so that their center of gravity coincides with the load axis of the press plates, as illustrates in Fig. (4). The results obtained are presented in Table 1 [13].
2.4. Fine Aggregate Analyse
The characterization of the fine aggregates (sand), used in the preparation of mortars for coating the prisms, took into account the following tests and their respective Brazilian standards:
- Granulometry of the fine aggregate - NBR NM 248 [14]
- Specific Gravity Flask of Chapman - NBR 9776 [15]
- Clay content in clods - NBR 7218 [16]
- Determination of fine materials - NBR NM 46 [17]
- Determination of the unit mass – NBR NM 45 [18]
- Swelling of the fine aggregate - NBR 6467 [19]
The sand used was acquired in the Metropolitan Region of Recife and all the tests were carried out in the Laboratory of Construction Materials of Catholic University of Pernambuco, Brazil.
2.4.1. Determination of the Granulometric Composition
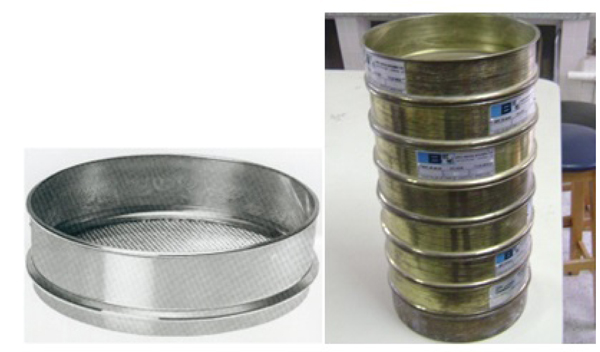
The determination of the granulometric composition aims to classify the aggregate as a function of the size of the grains. The test method is described in NBR NM 248 [14] and to determine if it is necessary to collect two samples of the aggregate to be analysed which must then be washed and preheated to a temperature of (105+5)° C. Its classification occurs through a set of sieves with openings standardized by ABNT (Fig. 5). The assembly is organized in a decreasing manner so that the sieves of larger apertures overlap the sieves of smaller apertures; the material is then sieved so that each fraction is retained in the sieves, and then separated and weighed. Fig. (5) illustrates the procedure.
2.4.2. Determination of the Specific Mass
In order to determine the specific mass of the fine aggregate, the procedure described in the Brazilian standard NBR NM 52 [20], using the Chapman vial (Fig. 6), a standardized vial that indicates the displacement of the water column volume after the materials insertion was used. The material specific mass is the ratio of its mass and the volume occupied by it, excluding voids between the grains.
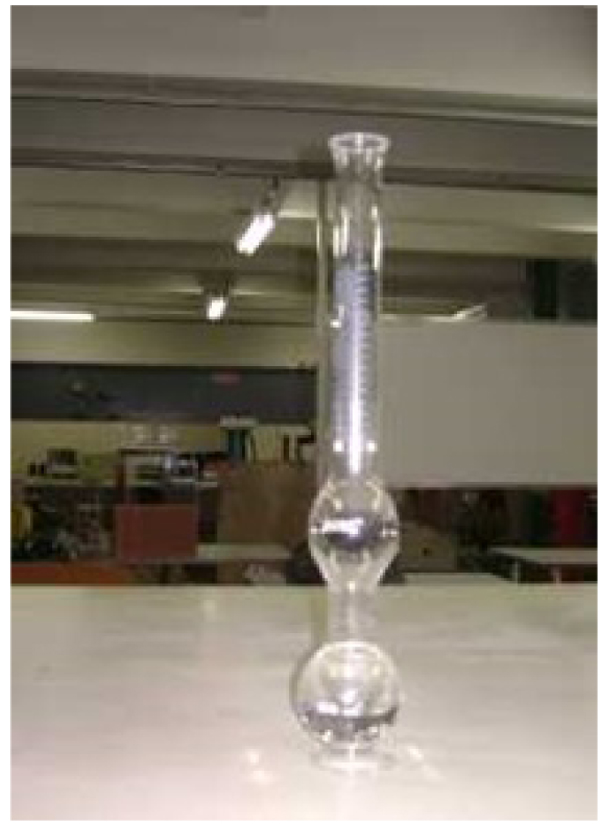
The sand was oven dried at a temperature of about 105° C and a sample of 500 g was withdrawn. This sample was then inserted into the Chapman vessel, which was already filled with water until a volume of 200 cm3; as the material was being placed, the water column moved so that at the end, the variation of this displacement represented the volume of sand inserted. The equation used is shown below in Eq. (3):
 |
(3) |
where m is the dry mass of the material and L is the final volume of the water column, the result is expressed in g/cm3.
2.4.3. Determination of the Fine Materials Content
Fine materials present in the aggregate, i.e., those passing through the 75 μm aperture sieve, also called powder material, should be analysed by the method described in NBR NM 46 [17]. Its quantity, when higher than the one foreseen in the standard NBR 7211 [21] that is of 5%, can harm the mixture, either of concrete or mortar because the very fine grains make difficult the adhesion of the paste of cement to the aggregate.
The sample was oven-dried at 110° C until mass constancy and then a 100 g sample was withdrawn. This quantity was placed on the sieves with opening 1.2 mm and 75 μm and subjected to the washing successive times so that the fine material adhered to the aggregate was eliminated with the water. The process was completed when the water passed through was completely clean. The material was again placed in an oven to evaporate the water and obtain the final mass. The result was calculated according to the following expression in Eq. (4):
 |
(4) |
where Mi is the initial mass and Mf is the final mass.
2.4.4. Clay Content in Clods
Clad clays and friable materials are materials that are susceptible to wear when subjected to minor stresses that may alter the quality of an aggregate for contamination with poorly resistant grains and which impair both the strength and the appearance of concrete and mortars. Its content is calculated according to the recommendations code NBR 7218 [16], separating a portion of the kid's aggregate that passes in the sieve with opening 4.8 mm and is retained in the sieve with opening 1.2 mm, identifying the clods and friable grains and proceeding with discharging of these grains and subjecting them to a new sifting process. The calculation is based on the following equation in Eq. (5):
 |
(5) |
where mi is the initial mass and mf is the final mass after sieving.
2.4.5. Unit Mass Test
The unit mass in the loose state of the fine aggregate is determined by NBR NM 45 [18]. In this method, a cylindrical vessel with a known volume of 20 litters, 16 mm diameter metal rod, a concrete shovel, metal ruler, a balance with a resolution of 50 g and an amount of dry sand sufficient to occupy the volume of the vessel.
In this test, method C of the standard was used. The dry sand is added without compaction until the entire volume of the vessel is occupied, the metal ruler is used to remove the excess sand on the vessel and the sand set plus vessel is weighed, the result is calculated according to the expression in Eq. (6):
 |
(6) |
where ρap is the unit mass of the aggregate (kg/m3), mar is the mass of sample plus container (kg), mr is the empty container mass (kg) and V is the container volume (m3).
2.4.6. Swelling of the Fine Aggregate
The swelling is a phenomenon that concerns the small aggregate and can be described as the variation of the apparent volume that affects the unit mass of the material when it is submitted to the variation of the moisture content. In other words, the same amount of sand may occupy larger or smaller volumes without compaction when its moisture content varies from dry to wet sand. When performing a volume trace, it is very important to correct the volume of the sand in the container as well as its moisture content, due to the great capacity of water retention by the small aggregates.
|
Opening of the Sieves (mm) |
Maas Retained (%) |
Variation of the % Retained <= 4% |
Average of Retained Mass (%) |
Cumulated of Retained Mass (%) | Ratios over % Retained | ||||
|---|---|---|---|---|---|---|---|---|---|
| Lower Limits | Higher Limits | ||||||||
|
Test nº 1 |
Test nº 2 |
Used zone | Optimal zone | Used zone | Optimal zone | ||||
| 9.5 | 0.0% | 0.0% | 0.0% | 0.0% | 0.0% | 0 | 0 | 0 | 0 |
| 6.3 | 0.0% | 0.0% | 0.0% | 0.0% | 0.0% | 0 | 0 | 0 | 7 |
| 4.75 | 0.6% | 0.3% | 0.2% | 0.5% | 0.5% | 0 | 0 | 5 | 10 |
| 2.36 | 4.1% | 3.3% | 0.8% | 3.7% | 4.1% | 0 | 10 | 20 | 25 |
| 1.18 | 10.1% | 8.9% | 1.2% | 9.5% | 13.6% | 5 | 20 | 30 | 50 |
| 0.6 | 21.4% | 21.4% | 0.0% | 21.4% | 35.1% | 15 | 35 | 55 | 70 |
| 0.3 | 33.4% | 32.5% | 0.9% | 33.0% | 68.0% | 50 | 65 | 85 | 95 |
| 0.15 | 21.2% | 23.1% | 1.9% | 22.1% | 90.2% | 85 | 90 | 95 | 100 |
| Bottom | 9.2% | 10.5% | 1.2% | Fine module = | 2.11 | Maximum characteristic size = (mm) = | 2.4 | ||
The test, according to the standard NBR 6467 [19], is to perform several measurements of the unit mass in various sand moisture conditions, namely: 0%, 0.5%, 1%, 2%, 3%, 4%, 5%, 7%, 9% and 12% and the coefficient of swelling is then calculated by the expression in Eq. (7):
 |
(7) |
where Vh is the volume of the aggregate with h% humidity (dm3), V0 is the volume of dry aggregate in greenhouse (dm3), Vh/V0 is the swelling coefficient, γs is the unit mass of the dry aggregate (kg/dm3), γh is the aggregate mass with h% of moisture content (kg/dm3) and h is the aggregate moisture content (%).
Finally, Table 3 shows the granulometric results according to the Brazilian standard NBR NM 248 [14] and Table 4 presents a summary of the characterization results obtained with the fine aggregates used in the research.
2.5. Weak, Medium and Strong Mortar
The used red clay brick blocks had dimensions of 91x191x190 mm3 (with a tolerance of ±3mm) and an average density of 2620 kg/m3. Overall, a total of 100 prisms were built and tested (Table 5). All the applicable ASTM standards or Brazilian standards (NBR) were followed in the building, curing, capping, and testing of the prisms and the components.
| Ref. | Samples Tested | Dimension (cmxcm) | Area (cm2) |
|---|---|---|---|
| Prims with 2 clay blocks | |||
| 2P-1 | Uncoated prims | 9x19 | 171 |
| 2P-2 | Prisms with a coating of 3 cm of mix ratio 1:1:6 (cement:lime:sand) | 15x19 | 285 |
| 2P-3 | Prisms with a coating of 3 cm and mix ratio 1:2:9 (cement:lime:sand) | 15x19 | 285 |
| 2P-4 | Prisms with a coating of 3 cm and mix ratio 1:1:6 (cement:lime:sand) reinforced with a POP mesh of 10x10 cm and 4.2 mm of diameter | 15x19 | 285 |
| Prims with 3 clay blocks | |||
| 3P-1 | Uncoated prisms | 9x19 | 171 |
| 3P-2 | Prisms with a coating of 3 cm of mix ratio 1:1:6 (cement:lime:sand) | 15x19 | 285 |
| 3P-3 | Prisms with a coating of 3 cm and mix ratio 1:2:9 (cement:lime:sand) | 15x19 | 285 |
| 3P-4 | Prisms with a coating of 3 cm and mix ratio 1:1:6 (cement:lime:sand) reinforced with a POP mesh of 10x10 cm and 4.2 mm of diameter | 21x19 | 399 |
3. RESULTS AND DISCUSSION
Table 6 shows that the average compressive strength of the uncoated prisms with two (2P-1) or three blocks (3P-1) was not very different. In fact, for the two-block prism, the mean load was 9.72 kN whereas, for the three-block prisms, this load was 9.49 kN, representing a difference of 2.4%. However, it is important to note that the coefficients of variation observed were 35% and 22%, for uncoated prisms with two and three blocks respectively, indicate that the observed values should be examined with caution. In addition, it should be noted that these prisms were tested on a hydraulic press machine with a load capacity of 500 kN and the average compressive resistance values obtained were below the accuracy of the press machine, which is on the order of 10% of its capacity. In spite of these aspects, it is possible to conclude that no significant difference was observed between prisms of two and three blocks.
| Sample | Compressive Resistance of Prisms (kN) | |||
|---|---|---|---|---|
| Average | St. Dev. | COV (%) | Increase | |
| 2P-1 | 9.72 | 3.38 | 35 | --- |
| 2P-2 | 45.47 | 12.21 | 27 | 368% |
| 2P-3 | 50.43 | 13.61 | 27 | 419% |
| 2P-4 | 120.73 | 16.89 | 14 | 1142% |
| 3P-1 | 9.49 | 2.08 | 22 | --- |
| 3P-2 | 52.71 | 9.07 | 17 | 455% |
| 3P-3 | 45.03 | 10.38 | 23 | 374% |
| 3P-4 | 109.17 | 11.23 | 10 | 1050% |
Coated prisms made with low (Type O) and medium compressive-strength (Type-N) mortar, with 2 and 3 blocks, according to Table 6, had a significant increase of load capacity, reaching up to 419% for 2 block prisms and 455% for 3 block prisms.
For the 2 block prisms with a coating, it was observed that the prisms with medium compressive-strength mortar presented lower load capacity than the prisms made with low compressive-strength mortar, although the difference did not exceed 10%. The coefficient of variation observed for these two situations was of the same order of magnitude, approximately 27%, considering this value to be statistically high, possibly explaining the unexpected result.
The observed inconsistency in the mean burst load of the 2 block prisms was not observed in the 3 block prisms. This can be justified by the fact that the coefficient of variation for the 3 block prisms was lower than for 2 block prisms.
The grout mixtures and the thickness of the mortar in the 3 block prisms had a significant influence on the compressive resistance of these elements. In prisms with the same thickness of 3 cm and different mix ratio, an increase of 15% between mix ratios of 1:1:6 and 1:2.9 was observed.
Reinforced prisms with 3 cm of thickness reinforced mortar and connectors showed a significant increase in the load capacity when compared to the prisms without framework and connectors. For the prisms with 2 blocks and a medium mortar with 3 cm of thickness, the increase of 166% was observed. However, for the 3 block prisms medium compressive-strength mortar of 3 cm thickness, the increase was 107% (Tables 6 and 7).
| Typology | 3-blocks / 2-blocks prisms |
|---|---|
| Uncoated prisms | 0.98 |
| Prisms with a coating of 3 cm and mix ratio 1:2:9 | 0.89 |
| Prisms with a coating of 3 cm of mix ratio 1:1:6 | 1.16 |
| Prisms with a coating of 3 cm and mix ratio 1:1:6 reinforced | 0.90 |
| Average = | 0.98 |
| Standard Deviation = | 0.12 |
| Coefficient of Variation = | 13% |
The rupture observed with uncoated prisms (2 and 3 blocks) was abrupt. The ruptures of the coated prisms start at the septa and it was transferred to the coating layer. This type of rupture was not abrupt but by shear. The coated prisms present the same type of rupture for 2 or 3 blocks.
The types of rupture observed in 2 block prisms and 3 block prisms with a coating of 3.0 cm and a mix ratio of 1: 1: 6 show that the rupture in the reinforced prisms was transferred from the septa to the first layer and then to the second layer. This rupture type was less explosive, however, continuing to be abrupt.
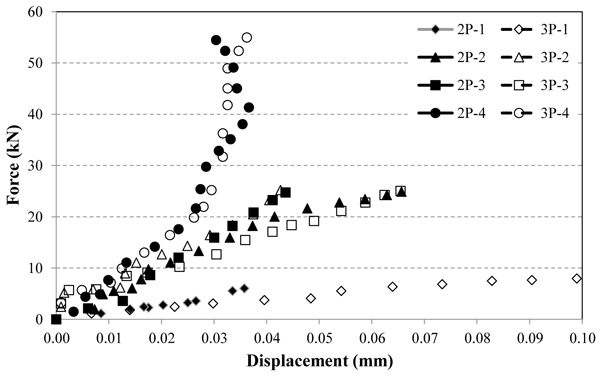
Finally, Fig. (7) shows the mean displacements observed during the application of load in the prisms of two and three blocks, respectively. From the analyses of this figure, it is possible to observe that for the prisms of 2 and 3 blocks, without coating, the hardness was lesser than in the other prisms studied. In general, significant difference behaviour in the prisms with strong and weak mortar, both for prisms with 2 and 3 blocks was not observed. However, the reinforced prisms present higher performance in comparison with the other prisms studied; aspects that suggest the importance of the reinforcement performed.
CONCLUSION
The main conclusions of this research are as follows:
- The experimental results showed that the coatings contributed to increase the vertical compressive resistance of the masonry elements studied;
- The increase observed in the load related to the reinforcement of the coated two-blocks prisms was approximately 166% and for three-blocks prisms, it was of 107%;
- The ratio of the maximum average loads of 2 block prisms and 3 block prisms was near 1, showing to be equivalent two-blocks and three block prisms;
- Several types of rupture were observed in the prisms, and it is not possible to define a typical rupture form. On the other hand, the lateral detachment ruptures of the coating layers were frequent.
CONSENT FOR PUBLICATION
Not applicable.
CONFLICT OF INTEREST
The authors declare no conflict of interest, financial or otherwise.
ACKNOWLEDGEMENTS
Declared none.


