All published articles of this journal are available on ScienceDirect.
Experimental and Numerical Investigation of Old Masonry Wall Using a Macro-Modeling Approach
Abstract
Background:
A 3-D finite element model of the internal masonry wall of a 103-year-Old Senate hall, Allahabad University, has been modeled using macro-modeling approaches. The masonry wall is an excellent example of Indo-Saracenic style architecture used by Britishers during the late 19th Century, which is a unification of the Mughal and Colonial architecture.
Methods:
Non-destructive Test (NDT) has been conducted to estimate is compressive strength and Young’s modulus of the wall. Compressive strength of the brick masonry and stone arch was estimated in the range of 10.5-12.5 MPa and 18.6-21.2 MPa, respectively, whereas Young’s Modulus was estimated in the range of 1800-5000 MPa and 5500-8000 MPa (outlier not considered). Finite Element model was prepared using the macro-modeling approach.
Results:
The gravity load analysis shows that the wall is stable, and its geometrical configuration is safe with maximum Von-Mises stress of 5.38 MPa and deformation of 2.27 mm. The results of the first six modes are presented. Further, in the absence of a recorded ground motion for the Prayag city, synthetic ground motion is simulated for 25th April 2015 Nepal earthquake (Mw) using a stochastic finite fault model.
Conclusion:
Evaluated behaviour of the internal masonry wall is shown in the form of acceleration, deformation and stress response.
1. INTRODUCTION
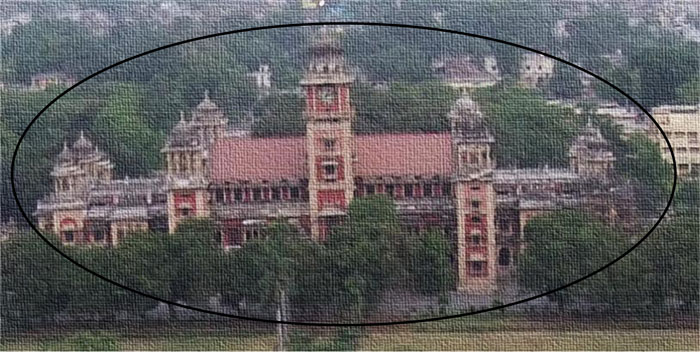
Indo-Saracenic style of Architecture in India was an effort by Britishers to integrate British and Indian ambitions in the year 1858 to show that they are a part of the Indian culture. The word Indo is used for Indians and Saracen is an old name for Muslims used by the British. It was a movement in terms of colonizing India by creating a prototype structure and then moving towards Colonial architecture only after India’s first freedom fight against the British in 1857. In the year 1870, the movement began, and the construction of the Indo-Saracenic style, a mixture of Indian and Islamic Architecture, was initiated with clock towers, public buildings, University buildings, Railways station, etc. [ 1 ]. One such example is the 103-year-old unreinforced masonry structure of Allahabad University, Prayag, India. The university was built in 1887, and it is the fourth oldest university in India after Bombay, Madras and Calcutta. The Senate hall masonry wall, which is the part of the building, had been constructed in 1915 and was designed by Luitenent Sir John Hawwet (Fig. 1). The building has various structural and non-structural components, i.e., stone arches, column (octagonal and rectangular) and, load-bearing walls [2].
In the past, historic structures and its structural components, e.g., arches, walls, vaults, domes, the diaphragm/ wall, were analyzed for different loading conditions to identify the critical locations in the masonry building [3-5]. It is recommended that the field observation could be a powerful tool for careful analysis of the historical structures that reveal various unknown factors of the structure such as the verification of dimension on drawings, its materials, damages, and crack propagations [6, 7]. Many researchers have proposed the stability check for the old buildings for standard gravity loads and dynamic analysis to know the structural response [8, 9]. The seismic demand of old masonry was even investigated against sequences of the earthquake [10]. Cundari and Milani (2013) compared the two finite element models, homogenized and heterogenous, of unreinforced masonry for its computational cost using pushover analysis, whereas a very limited number of studies were conducted to evaluate the dynamic response of masonry structures for site-specific ground motion.
In the present work, the load-bearing wall of Senate Hall, an excellent example of Indo-Saracenic style architecture, is analyzed using macro-modeling approach on Ansys Workbench. The work has been instigated with a detailed survey and followed by Non-destructive testing to estimate its mechanical properties. The macro-modeling approach is used to prepare the model, and the problem is delineated to no-crack model to reduce the computational time and simplify the analysis. In the absence of a time history record for Praya City, previously known as Allahabad, the synthetic ground motion has been generated using the stochastic finite fault model.
1.1. Description of the Internal Masonry Wall
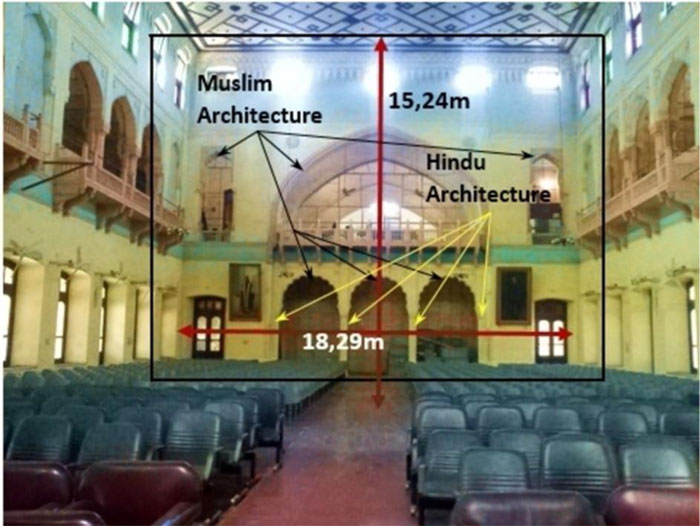
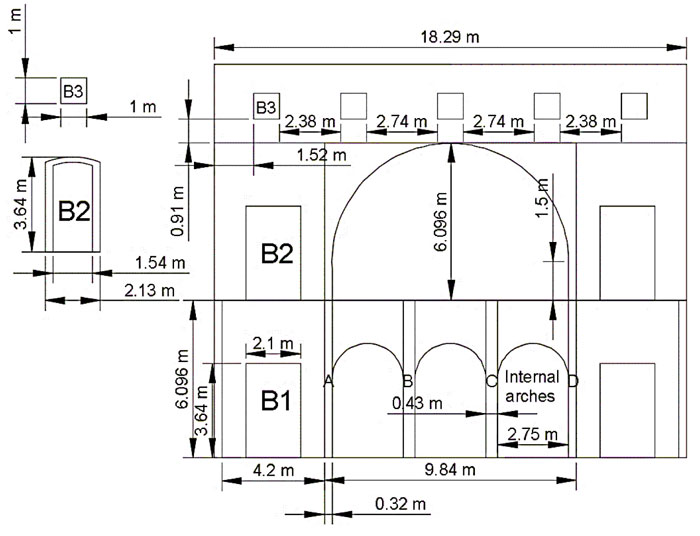
The internal masonry wall of the senate hall building is arranged in a cellular pattern. The British had carefully amalgamated the composition of the building with Hindu and Muslim architecture, whereas the function of the building remained in colonial-style architecture. Fig. (2) shows the internal masonry walls on both sides of the central hall that is a combination of brickwork and stone arches. Fig. (2) shows the combination of the pillars (columns), lintels with corbels are part of Hindu Architecture whereas the arches, vaults and domes are conscientiously used in the Muslim Architecture to demonstrate the blended culture of India in these type of buildings; the internal wall is one such example. Fig. (3) shows the width of the wall and its height as 18.29 m and 15.24 m, respectively. The wall consists of four stone arches (Muslim Architecture), three small arches of ~3.28 m in diameter each at the ground floor transferring the loads from the bigger arch of ~9,84 m diameter from the first-floor level. The wall is symmetrical at the vertical axis on which three stone arches are positioned at the center of the wall on the ground floor level. The thickness of the internal masonry wall on the ground floor, first floor and the second floor is 0.76 m, 0.61 m and 0.46 m, respectively.
Further, the crown height is ~6.01 m of the bigger arch that supports the roof of the senate hall. The thickness of the arch is 0.31 m at ground floor level and 0.61 m on the first-floor level. The arches at the ground floor are supported on the octagonal and rectangular columns that represent the Hindu architecture in the building. Octagonal columns are 3.64 m high and 0.42 m in diameter, with a spacing of 2.75 m (Fig. 3 ). The bigger stone arch transfers the loads to the rectangular column base of 0.32 m × 0.46 m having a height of 7.6 m, as shown in Fig. ( 3 ).
The parabolic arch supports the second floor and wall of 3.048 m with 09 openings in the form of windows and ventilators. The dimensions of four doors of the same type (B1 & B2) are 3.64 m × 2.1 m, and of five ventilators (B3) is 1m × 1m, as shown in Fig. (3).
1.2. Finite Element Modelling
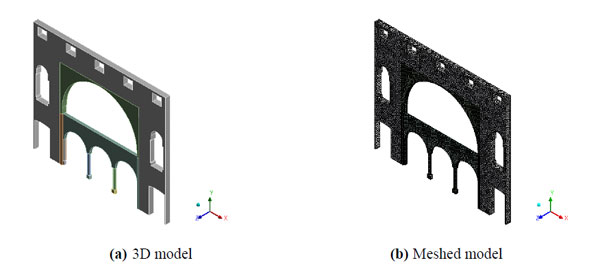
In the present model, the interface between units and mortar is insignificant for the global behaviour of the masonry wall. Lourenco et al. (1995) denoted that the macro-modeling distinction between brick/stone units and mortar joints is treated as one unit. The properties of masonry wall are obtained through testing, and it is assumed that the anisotropic composite wall reproduces an orthotropic material with different tensile and compressive strengths along the material axes as well as different inelastic behaviour for each material axis [11]. In this model, different material properties have been used for the test of masonry and stone arch. Macro element modeling is the most appropriate methodology for the analysis of old masonry constructions as it comprises an accurate illustration of the computational cost for the massive structures. The finite element and its meshed model of the internal masonry wall are shown in Fig. (4). Mesh size of 200 mm for brick masonry and 100 mm for stone masonry has been selected only after the convergence of mesh. Altogether, 2,54,467 nodes and 1,02,810 solid elements are formed on the entire masonry wall. Solid 186 and Solid 187 structural elements are used for the brick and stone masonry, respectively. Solid 186 is 10-noded three degrees of freedom, and Solid 187 is 20-noded three degrees of freedom at each node. These elements are connected using contact 174, and target 170 in the Ansys.
1.2.1. Element Description
SOLID187 element is having mixed formulation ability for imitation of linearly incompressible elastoplastic material. These are three-dimensional 10 noded tetrahedral elements having 03 Degrees Of Freedom (DOF) at each node (translation in x, y, and z directions). Subsequent equations show the shape functions of the elements.
 |
 |
Eq. 1 is used to estimate the displacement results.
 |
(1) |
where N1, N2, N3 …. N10 are shape functions and u1, u2, u3 …u10, v1, v2, v3…v10, and w1, w2, w3…w10 are displacements at corresponding nodes. Eq. 2 shows the stain-displacement relationship.
 |
(2) |
where {ϵ}6×1 is strain vector
 |
and  is the displacement at each node
 |
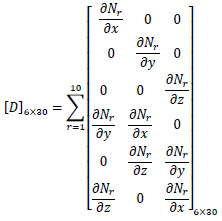 |
Using a stress-strain relationship, Eq. 3 can be used to estimate the stress.
 |
(3) |
where D is the rigidity matrix
 |
and {σ}6×1 is stress vector
 |
Similarly, stress, strain and displacement can be obtained for other elements used in the numerical model.
1.3. Non-Destructive Testing on Internal Wall
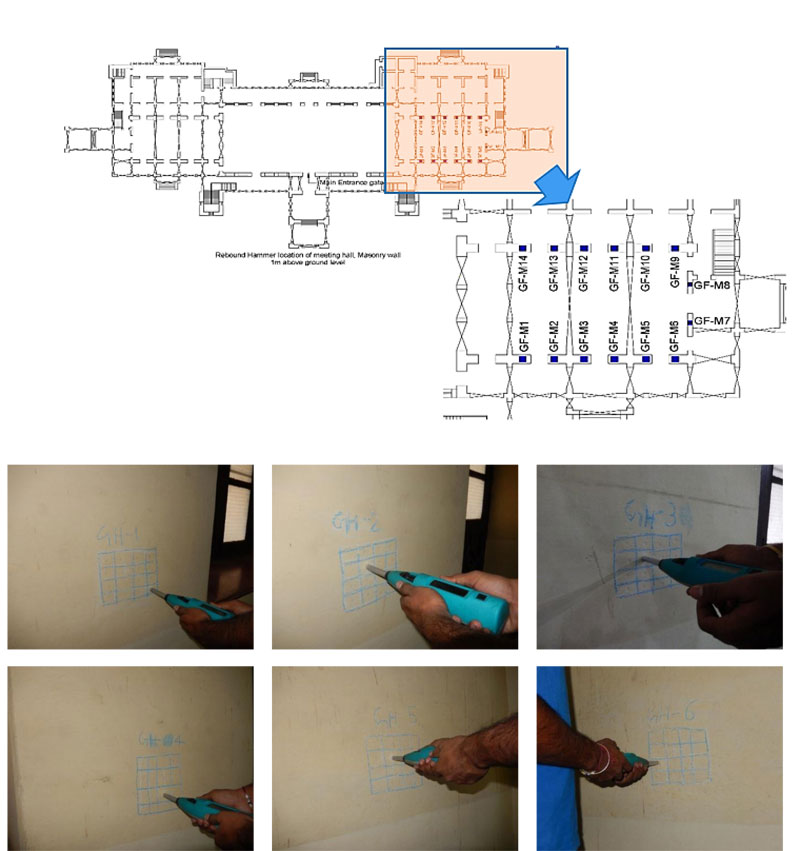
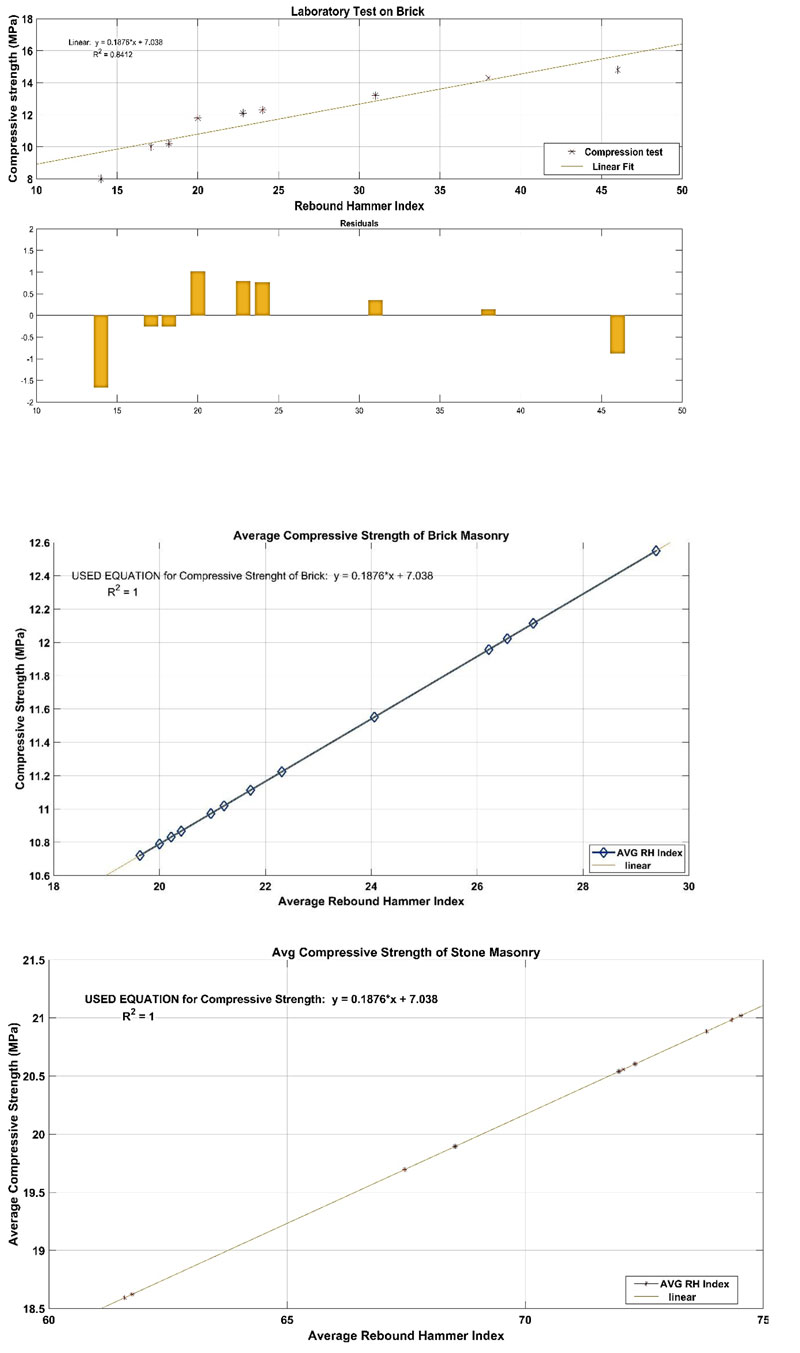
The compressive strength, the surface of the brick masonry and stone masonry are estimated using the Rebound Hammer. Fig. (5) shows the locations of RH test viz., GF-M1 to GF-M6 (front wall), GF-M7 to GF-M8 (right-side wall) and GF-M9 to GF-M14 (backside wall). Table 1 shows the RH Index in the fourteen locations. At each location, 16 test, 4x4 grid has been performed, and the average RH index is shown in the last column of the table. To estimate the compressive strength, RH has been calibrated with the laboratory test; Fig. (6a) shows the linear equation to estimate the compressive strength (MPa) from the RH Index value. Fig. (6b) shows the estimated compressive strength of brick masonry ranging from 10.5 MPa to 12.6 MPa, whereas Fig. (6c) shows the estimated strength of stone masonry ranging from 18 MPa to 21.1 MPa. Table 2 shows the RH Index value of the stone arch.
| Location | Rebound Hammer Index | Avg. | |||||||||||||||
|---|---|---|---|---|---|---|---|---|---|---|---|---|---|---|---|---|---|
| GF – M1 | 23.5 | 17.0 | 31.5 | 33.5 | 22.0 | 24.0 | 20.0 | 27.0 | 25.0 | 17.0 | 20.0 | 23.5 | 30.0 | 31.0 | 17.5 | 22.5 | 24.06 |
| GF – M2 | 20.0 | 19.5 | 21.0 | 17.0 | 19.0 | 21.0 | 20.0 | 23.0 | 17.5 | 22.0 | 17.0 | 17.5 | 20.0 | 19.5 | 21.0 | 19.0 | 19.63 |
| GF – M3 | 21.5 | 20.0 | 19.0 | 23.0 | 18.5 | 19.5 | 20.5 | 18.0 | 31.0 | 18.0 | 16.5 | 21.5 | 23.5 | 22.5 | 21.0 | 21.5 | 20.97 |
| GF – M4 | 32.0 | 27.5 | 30.0 | 20.0 | 28.5 | 32.5 | 32.0 | 29.0 | 22.0 | 32.5 | 31.5 | 31.0 | 28.0 | 34.5 | 30.5 | 28.5 | 29.38 |
| GF – M5 | 20.0 | 21.0 | 22.5 | 17.5 | 21.0 | 24.0 | 24.0 | 21.5 | 19.0 | 19.5 | 26.5 | 22.5 | 25.0 | 23.5 | 25.0 | 24.5 | 22.31 |
| GF – M6 | 28.0 | 23.0 | 22.5 | 16.5 | 18.5 | 17.5 | 21.5 | 21.5 | 17.5 | 21.5 | 22.0 | 16.0 | 17.5 | 18.0 | 24.0 | 21.0 | 20.41 |
| GF – M7 | 26.0 | 28.5 | 27.5 | 25.0 | 26.5 | 24.0 | 26.5 | 28.5 | 24.5 | 28.5 | 24.0 | 26.5 | 27.5 | 20.0 | 28.5 | 27.5 | 26.22 |
| GF – M8 | 19.5 | 28.5 | 30.0 | 31.5 | 24.5 | 29.5 | 24.0 | 23.5 | 17.5 | 28.5 | 24.0 | 25.0 | 30.0 | 31.5 | 28.0 | 29.5 | 26.57 |
| GF – M9 | 17.5 | 19.0 | 23.5 | 21.5 | 22.0 | 19.5 | 19.0 | 19.0 | 19.5 | 16.5 | 21.0 | 21.5 | 20.5 | 19.0 | 21.0 | 23.5 | 20.22 |
| GF – M10 | 22.0 | 17.5 | 25.5 | 23.0 | 23.0 | 18.5 | 23.0 | 19.0 | 21.5 | 20.5 | 20.0 | 25.0 | 19.5 | 21.5 | 25.0 | 23.0 | 21.72 |
| GF – M11 | 18.5 | 16.5 | 24.0 | 30.0 | 18.5 | 17.5 | 18.5 | 19.5 | 21.5 | 17.0 | 18.5 | 17.5 | 22.5 | 20.0 | 22.5 | 21.0 | 20.22 |
| GF – M12 | 32.0 | 29.0 | 20.0 | 30.0 | 28.0 | 36.5 | 16.5 | 30.0 | 30.0 | 28.5 | 19.0 | 25.0 | 27.5 | 28.5 | 24.5 | 28.0 | 27.06 |
| GF – M13 | 18.5 | 17.5 | 17.0 | 22.5 | 40.5 | 18.0 | 19.0 | 16.5 | 19.0 | 17.0 | 16.5 | 19.5 | 21.5 | 21.5 | 17.0 | 18.5 | 20.00 |
| GF – M14 | 26.5 | 25.0 | 21.5 | 16.5 | 26.5 | 24.0 | 18.0 | 17.0 | 23.5 | 22.0 | 21.5 | 18.0 | 23.0 | 18.5 | 17.0 | 21.0 | 21.22 |
| Location | Rebound Hammer Index | Average | |||||||||||||||
| EA – 1 | 57.0 | 71.0 | 74.5 | 76.0 | 76.0 | 58.5 | 76.0 | 74.5 | 61.0 | 71.5 | 65.5 | 75.5 | 57.0 | 69.0 | 61.0 | 72.5 | 68.53 |
| EA – 2 | 76.0 | 74.5 | 77.0 | 72.0 | 74.5 | 72.5 | 72.0 | 75.5 | 75.0 | 77.0 | 73.5 | 73.0 | 74.5 | 65.5 | 75.0 | 73.5 | 73.81 |
| EA – 3 | 57.5 | 57.5 | 66.0 | 63.0 | 62.5 | 63.0 | 63.5 | 62.5 | 61.0 | 64.0 | 62.0 | 66.5 | 66.5 | 58.0 | 55.5 | 59.0 | 61.75 |
| EA – 4 | 71.0 | 61.0 | 68.5 | 77.0 | 58.0 | 64.5 | 61.0 | 74.5 | 66.0 | 65.0 | 61.0 | 74.5 | 72.0 | 74.5 | 64.5 | 66.5 | 67.47 |
| EA – 5 | 77.5 | 76.5 | 75.5 | 78.5 | 65.5 | 67.5 | 78.0 | 76.5 | 71.5 | 75.5 | 74.0 | 74.5 | 76.5 | 77.5 | 73.5 | 74.0 | 74.53 |
| EA – 6 | 67.0 | 75.0 | 75.5 | 71.0 | 68.0 | 67.0 | 78.5 | 74.0 | 75.5 | 73.0 | 65.0 | 75.0 | 65.5 | 78.0 | 74.5 | 69.0 | 71.97 |
| EA – 7 | 59.5 | 64.0 | 74.5 | 72.0 | 77.0 | 79.5 | 78.5 | 66.5 | 59.5 | 77.5 | 75.0 | 77.5 | 69.0 | 79.5 | 77.0 | 66.5 | 72.06 |
| EA – 8 | 58.0 | 55.5 | 65.5 | 66.5 | 69.0 | 59.5 | 58.0 | 70.0 | 55.0 | 60.0 | 64.5 | 60.5 | 54.0 | 67.5 | 64.5 | 57.5 | 61.59 |
| EA – 9 | 77.5 | 79.0 | 78.0 | 78.0 | 66.0 | 81.0 | 77.5 | 71.0 | 69.5 | 79.0 | 80.5 | 70.5 | 70.0 | 69.5 | 75.0 | 67.5 | 74.34 |
| EA – 10 | 76.0 | 75.5 | 66.0 | 76.5 | 79.0 | 58.5 | 73.0 | 79.0 | 74.5 | 71.0 | 65.0 | 72.5 | 70.5 | 77.5 | 76.0 | 66.5 | 72.31 |
The maximum and minimum RH index values of stone arches are 74.53 and 61.59 on EA-5 and EA-8, respectively.
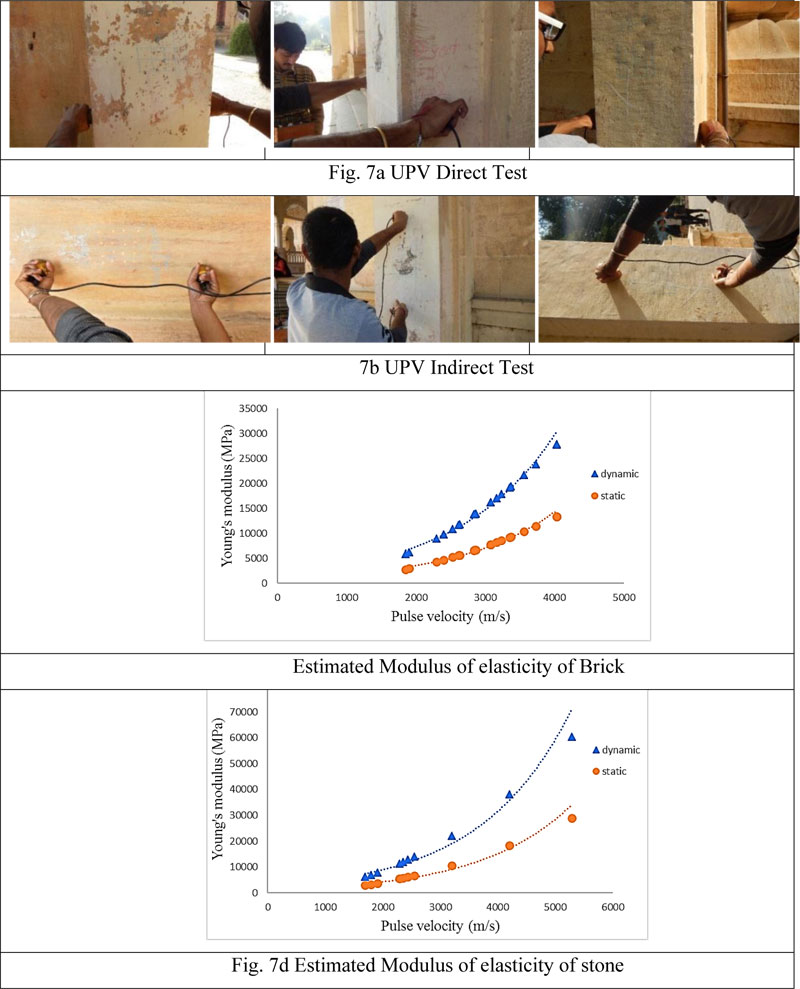
Further, to estimate the dynamic young’s modulus and Poisson’s ratio, an ultrasonic pulse velocity test has been performed using the direct and indirect method. Fig. (7a) and Fig. (7b) show the testing locations of direct and Indirect UPV test. The path length of 0.5 m is fixed between the transducer and receiver for each location.
The modulus of elasticity and compressive strength have been evaluated from the test data. Fig. (7) shows the test location of the UPV test and estimated dynamic modulus of elasticity of masonry and stone masonry (Table 3). Table 4 shows the mechanical properties that are used in the FE model.
| Material | Density (kg/m3) | Young’s Modulus (MPa) | Poisson’s Ratio |
|---|---|---|---|
| Masonry | 1900 | 2100 | 0.2 |
| Stone | 6470 | 2400 | 0.2 |
| Mode | Frequency (Hz) | Time Period (sec) |
|---|---|---|
| 1 | 0.286 | 3.4965 |
| 2 | 0.721 | 1.3869 |
| 3 | 2.116 | 0.4725 |
| 4 | 2.447 | 0.4086 |
| 5 | 3.073 | 0.3254 |
| 6 | 3.189 | 0.3135 |
2. MATERIALS AND METHODS
2.1. Analysis of Internal Masonry Wall (Indo-Saracenic Style)
The effectiveness assessment of the historical masonry wall strongly depends on the type of investigation of the senate hall building, as well as on the appropriate finite element macro-modelling approach for analysis. The masonry wall is analyzed for fixed supports at the base. The standard gravity (self-weight) analysis is performed using Indian standard code IS 875 Part 1 [12] by considering all the floor/roof loads to check the stability of the wall. Dynamic modal analysis on the internal masonry wall shows the first six mode shapes and frequency of the wall. The history of 25th April, 2015 Nepal Earthquake has been simulated using the regional parameters such as stress drop, slip [13]. The input ground motion of 0.07g has been applied along the longitudinal X-direction of the wall.
2.2. Static Analysis
The linear static analysis was performed in ANSYS Workbench using vertical loads corresponding to self-weight and live load. The analysis has been performed under constant vertical load, i.e. self-weight due to standard earth gravity as per IS 875(Part 1)-1987. The live load of 0.75 kN/m2 (crew load) is applied at the roof per Indian standard IS: 875 (part 2)-1987 (inaccessible roof) [14] and transferred to the load-bearing wall. Static analysis is performed by providing fixed support at the base, and resultant stresses are obtained in terms of equivalent von Mises stress.
 |
(4) |
2.3. Modal Analysis
To understand the dynamic response associated with the structure, modal analysis is performed. By solving Eq. 5, the Mode shape of the structure can be obtained Table 5 shows the six modal frequency of the wall.
 |
(5) |
For free vibration analysis, force vector f(t) = 0 and equation (5) can be simplified as
 |
(6) |
where [K] (stiffness matrix)=∫[B]t[D][B]dv,{xi} is the frequency of ith mode, and [M] (mass matrix) = ∫[N][N]tpdv
2.3.1. Site-Specific Dynamic Time History
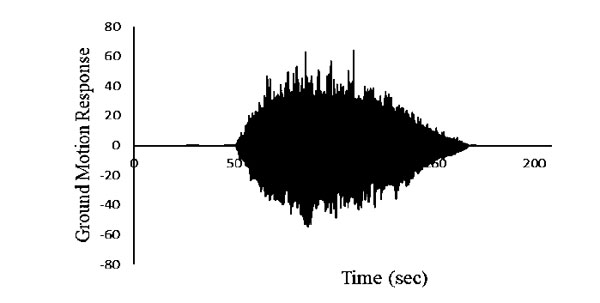
In the absence of strong-motion data for Allahabad city, synthetic ground motion is simulated using the stochastic finite fault method [15]. The target ground motion amplitude spectrum, which depends on the magnitude, distance and duration properties, can be estimated using Eq. 1 proposed by Motazedian and Atkinson (2005) [15],
 |
(7) |
Where Aj(r, f) is target amplitude spectrum corresponding to distance (r) and frequency (f), Rθϕ is radiation pattern constant (average value of 0.55 for shear waves), F denotes free surface coefficient (generally taken as 2), V is partitioning coefficient of shear waves into two components (generally taken as  ), ρ is the density of rock at source (fault), vs = shear wave velocity at source, M0ij = seismic moment related to the ijth sub fault, f0ij(t) = corner frequency related to ijth sub-fault at time t, Nr(t) = number of ruptured sub-faults at time t, M0,avg = average sub fault moment due to each fault = M/N, N = total number of sub-faults, G = geometrical spreading function, reff = effective distance of sub fault from the site, Q(f) = quality factor at frequency f, and k = high-frequency diminution filter, kappa [16-19]. Fig. (8) shows the simulated time history for Praya city (Allahabad). The response of the masonry wall was observed using the stochastic dynamic time history analysis of Allahabad city. The dynamic response of the masonry wall model for 5% damping has been evaluated.
The ground motion response has been simulated for Nepal earthquake (Mw 7.8) that occurred on 25th April 2015, due to which, Prayag city experienced a minor shake along with slit tilt of some of the multistory buildings in the neighboring city, e.g. Varanasi. The analysis setting used included end time 220 sec; sub-step 500; large deflection on. The analysis was performed in 2.65GHz high configuration (32GB RAM, 2TB Hard Drive, 2GB Graphic card) workstation. It took ~94 hr to complete the analysis.
3. RESULTS AND DISCUSSION
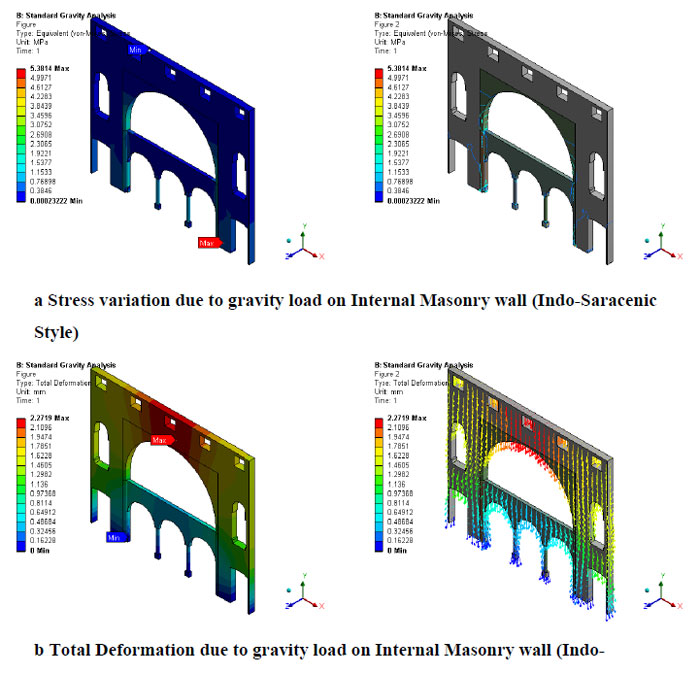
The geometrical configuration of the inner masonry wall shows the distribution of stress. The maximum stress of 5.38MPa was observed at the ground floor stone arch. Fig. (9a) shows the variation of stress on the inner masonry wall. It can also be observed from the figure that the stress on the stone arches is higher than the brick walls. It is due to the fact that the stone arch carries the higher load transfer directly from the roof, whereas the sidewall is only for supporting lateral actions. This is even more clear from Fig. (9b) which shows the variation in deformation on the inner masonry wall. The maximum deformation 2.27 mm is at the crown of the first floor stone arch.
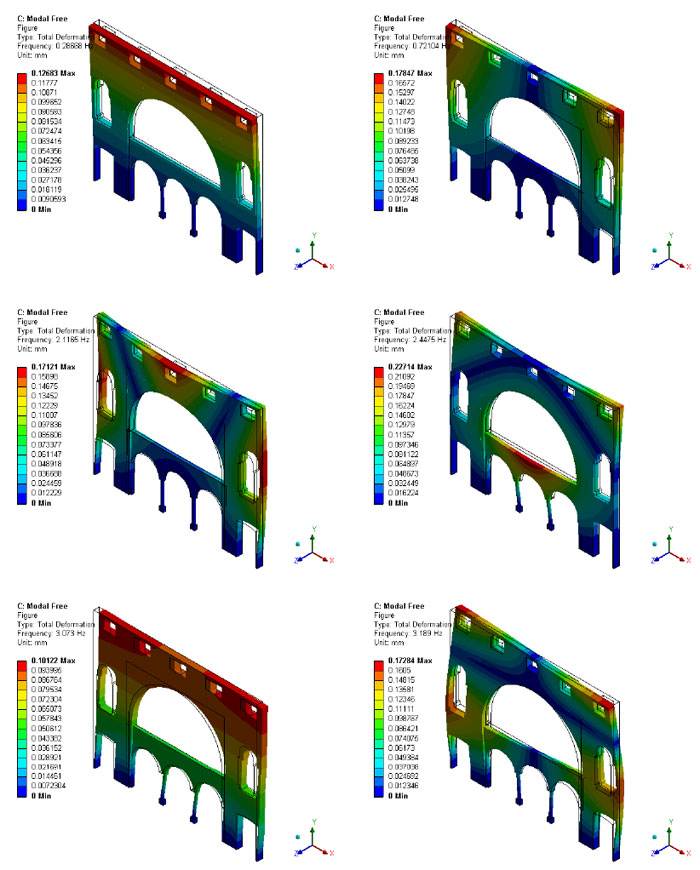
The model analysis has been performed using the Block Lancozoc method. Altogether six frequencies have been estimated for the inner masonry wall of the senate hall building. Table 4 shows all six modal frequencies and the natural time period.
Fig. (10) shows the deformation response of the octagonal column arch on the ground floor that performs well along the longitudinal direction, whereas being deformed quite significantly for the rotation (third mode).
3.1. Dynamic Time History Response
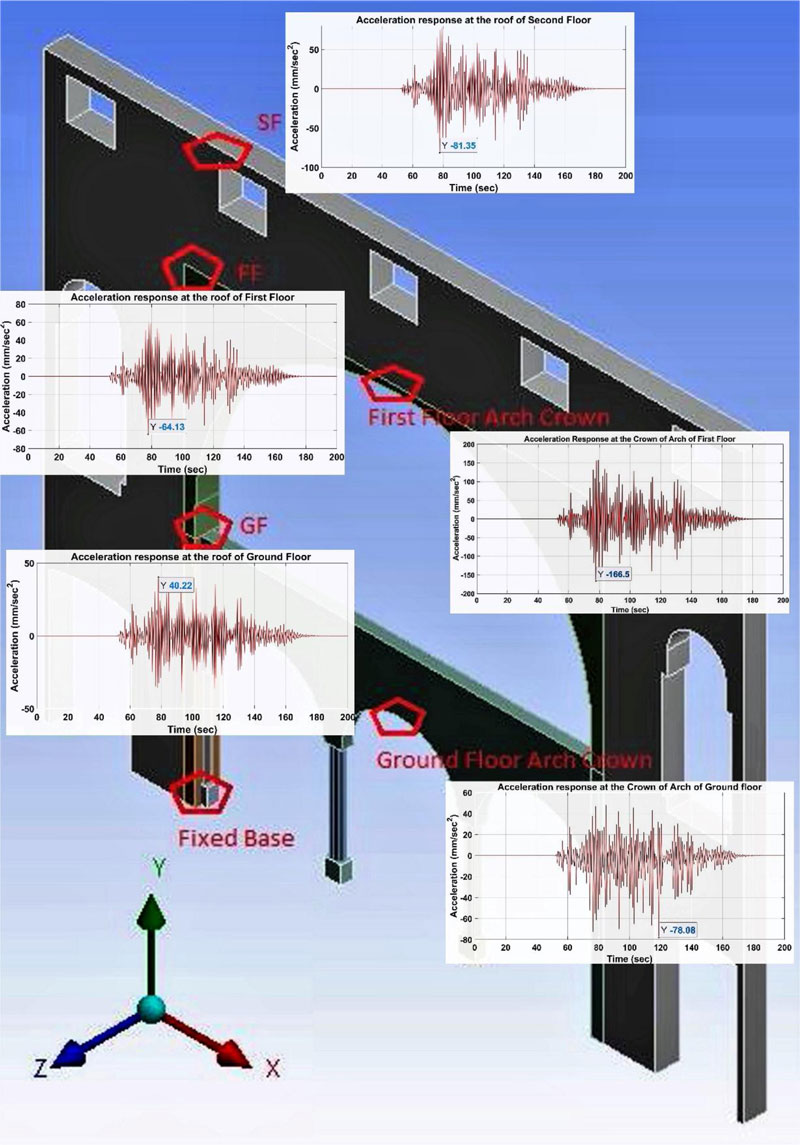
To estimate the behavior of the inner wall during the Nepal earthquake (Mw 7.8), the dynamic time history analysis has been performed for the simulated ground motion at Prayag city. The global response has been observed for the internal masonry wall of the building in terms of acceleration, deformation, velocity and stress on the location (cracks were observed) of masonry. The dynamic acceleration response has been observed on different locations in the masonry wall, as shown in Fig. (11). The amplification on the crown of the arch of the first-floor level is approximately ~2 times of the input ground motion. Further, the minimum response at the ground floor level is de-amplified. It is observed that due to the input of ground motion, the inner masonry wall of the ground floor is de-amplified, whereas the other portion of the wall is amplified. The amplification of acceleration response at the crown of arches on the ground floor and the first floor is 48.5% and 61.48%, respectively.
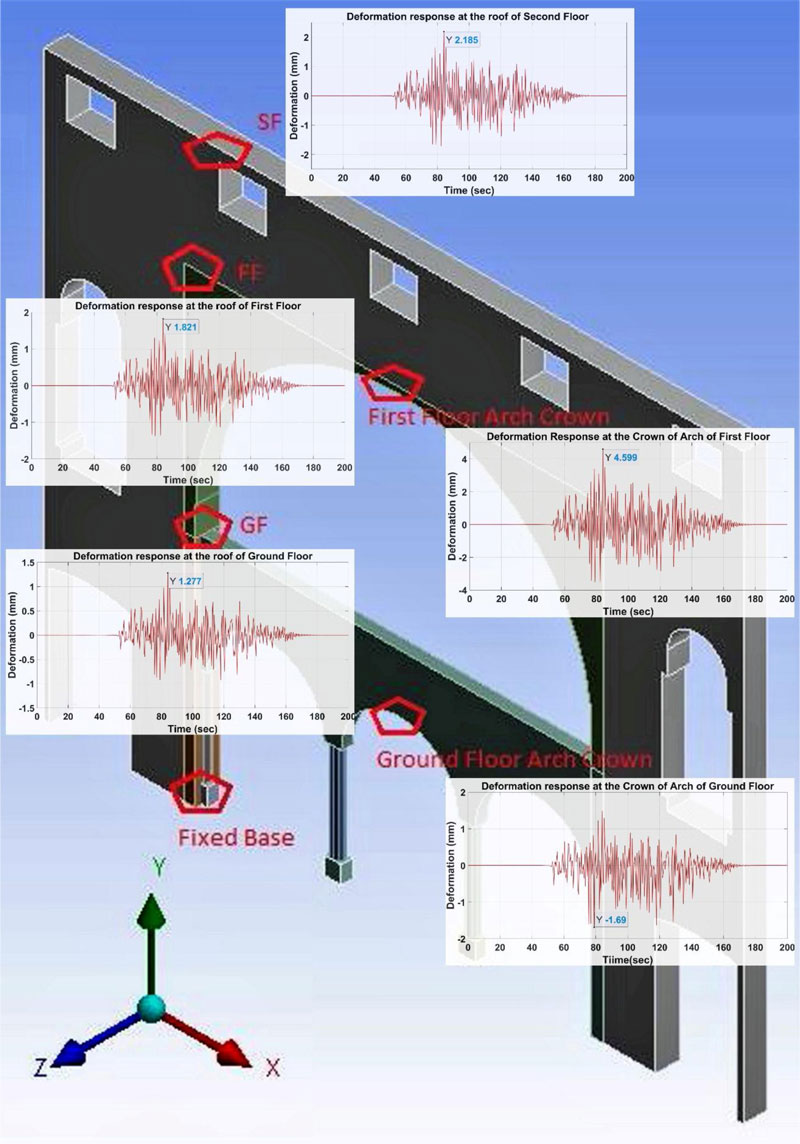
Fig. (12) shows the deformation response of the masonry wall of the building. The minimum and maximum deformations on the ground floor and the arch’s crown on the first floor have been observed as 1.27 mm and 4.59 mm, respectively. The deformation response of the masonry wall on the ground floor has been augmented to ~30% and ~17% at the level of the first and second floors, respectively. The global deformation response of the masonry wall has been observed in a positive direction during ground motion response in the longitudinal direction of the masonry wall. The deformation response on the ground floor and first-floor arch crown has been detected as 2.18 mm and 4.59 mm, respectively. The major cracks were visible on the columns and the connection between the stone panel and masonry wall has been visible during the in-situ survey of the building. The internal masonry wall was found in better condition on the ground floor and the first floor, but significant damages and deterioration have been observed in the construction and plaster materials on the second floor.
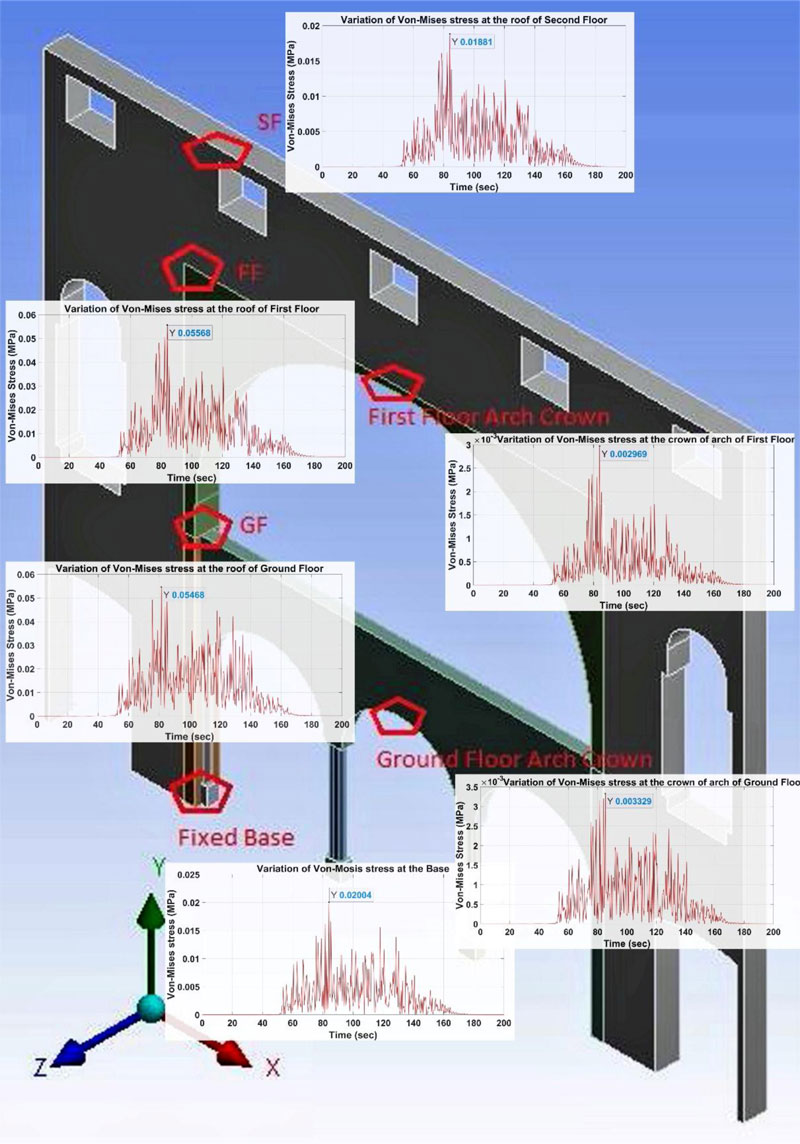
Fig. (13) shows the stress response of the internal masonry wall and the minimum and maximum stresses have been observed on the second floor and the first floor as 0.018 MPa and 0.055 MPa, respectively. The stress between the masonry wall and the plinth level of the senate hall building has been observed to be 0.02 MPa. During the dynamic analysis of the inner masonry wall of the senate hall building, the maximum stress responses have been visible on the connections at each of the levels. These connections have been strengthened and retrofitted from new materials which were visible during the survey of the building.
CONCLUSION
A comprehensive study has been performed to understand the behaviour of the inner masonry wall by building an approximate model using a macro-modelling approach. Due to limited resources, only RH UPV testing has been performed to estimate the compressive strength and Young’s Modulus for the 103-year-old masonry wall (Indo-Saracenic Style). More comprehensive study may improve the accuracy of the results. The approximated average values were used in the analysis of the old masonry. In-situ survey showed the minor cracks on the octagonal columns, stone facade, arch crown, connection between masonry wall and stone facade of the internal masonry wall. These cracks are not modeled in the present work. The gravity analysis results showed that the geometrical configuration of the wall was well in agreement with the distribution of stress and deformation pattern of the wall. The maximum Von-Mises stress of 5.38 MPa was observed on the ground floor stone panel and maximum deformation of 2.27 mm on the crown of the first floor stone arch. Further, modal analysis showed the first six modes of the masonry wall. In the absence of time history data of the earthquake, a stochastic finite fault model was used to simulate synthetic time history for Prayag city and used as an input for ground motion. The masonry wall was found to be stable against the Nepal earthquake and the deformation of the wall to bewithin the limit.
CONSENT FOR PUBLICATION
Not applicable.
AVAILABILITY OF DATA AND MATERIALS
The authors confirm that the data supporting the findings of this study are available within the article.
FUNDING
None.
CONFLICT OF INTEREST
The authors declare no conflict of interest, financial or otherwise.
ACKNOWLEDGEMENTS
The authors are grateful to Mr. Naveen Kumar, Engineer in-charge of Allahabad University, for providing the permission to survey and capture photographs of the building. The work was not conducted without guidelines and consideration.


