All published articles of this journal are available on ScienceDirect.

Increasing Value of Façade at Green Hotel Building Based on Value Engineering
Authors Info & Affiliations
Abstract
Background:
Of a total of 180 countries in the world, Indonesia is ranked 116th in the EPI ranking. This paper describes the innovative design of a high-rise hotel building that carries a green building concept. which utilizes the outer wall area of the hotel building as an object in this study.
Objective:
The main design of this project is the creation of an innovative high-rise hotel building with attention to architectural, structural, and lighting system aspects as well as energy efficiency from direct sunlight, which will be processed into a source of electrical energy.
Materials and Methods:
Application of analysis through value engineering case studies and application of green building methods, with qualitative methods. This paper focuses on factors related to energy sources and environmental sustainability and calculates life cycle costs concerning case study designs. The goal is to reduce the use of electrical energy sources from PLN which have an impact on nature preservation, by carrying out the concept of environmentally friendly buildings, by utilizing the facade wall area with the application of Photovoltaic.
Results:
The results obtained a percentage of ≤ 6.21%, with the use of Photovoltaic material as much as 100%.
Conclusion:
The facades (east and west) generate ± 1,050 KVA of electricity from the Solar Power Plant and reduce the use of electricity from PLN by 991 KVA, out of a total of 2,041 KVA. It can be concluded that the decrease obtained is 47.32%.
1. INTRODUCTION
The goal of this research is to acquire any work items that are viable to be value-engineered and also can increase the value of a material [1]. Many concepts of implementing green buildings have provided various benefits in developed countries, but implementation is still largely not beneficial in developing countries, including Indonesia [2].
According to Law Number 28, 2002 concerning buildings, it is explained that each building has a different function. The number of 3-star hotels in DKI Jakarta in the 2014-2018 period has increased by 53.05% or from 213 hotels in 2014 to 326 hotels in 2018. Meanwhile, the number of hotels throughout Indonesia has reached 1,302 hotel units built [3].
The Facade is the outermost part of the building's architecture that reflects the image and expression of all parts of the building, it can even become the soul of the building.
The exterior will be the most critical and vulnerable to extreme and rapid weather changes. The composition of a façade, taking into account all its functional requirements (windows, doors, sun shading, roof planes) is principally carried out by creating a harmonious unity using a proportional composition, structured vertical and horizontal elements, materials, colors, and decorative elements. Other things that are no less important to get more attention are the proportion of openings, building height, the principle of repetition, a good balance of composition, and the themes that are included in the variations [4].
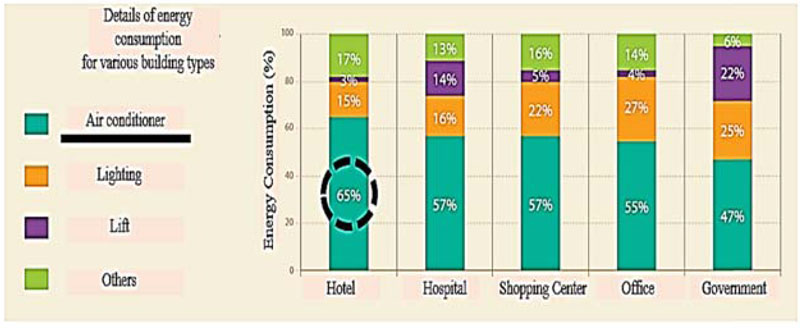
The use of the VE method will certainly be more valuable with a combination of the Green Building method. Based on the most recent research [5] that buildings and their construction consume 36% of the world's energy, and cause 39% of greenhouse gas (CO2) emissions, therefore the façade design concept will be reduced by using the Green Building method to reduce the dangers of natural damage and is also environmentally friendly (Fig. 1).
Besides, it can also be seen that the percentage of external heat gain from the use of the façade is the highest load of the main cooling system which reaches 60%. Thus the facade can be optimized with energy-saving consumption using value engineering methods and green building concepts. The implementation of the green building concept can be applied by utilizing solar energy sources. Based PP. 79 of 2014 concerning National Energy Policy, the target of the new and renewable energy mix in 2025 is at least 23% and 31% in 2050. Indonesia has a large enough potential for new and renewable energy to achieve the primary energy mix target, as seen in Table 1 below.
| Energy Type | Potential |
| Hydro power | 94.3 GW |
| Geothermal | 28. 5 GW |
| Bioenergy | PLT Bio |
| - | BBN: 200 Thousand Bph |
| Solar Power | 207,8GWp |
| Wind | 60,6 GW |
| Ocean Energy | 17,9 GW |
Currently, the local government has installed as many as 24 power plants from new and renewable energy sources with a capacity of 354.08 MW from the total planning of 1,771.41 MW and has been operating in the 1st semester of 2020 [6]. The application of a working system using VE and green building can achieve innovations in quality and cost efficiency and energy conservation obtained during planning until the value of benefits is calculated in the future. This research is a novelty with these innovative achievements that can reduce the use of electricity that comes from PV.
In the current construction world, finishing work on the outer wall (facade) as the outer side of a building is common and widely used. The use of a building façade is closely related to the concept of environmentally friendly buildings. For example, if a building uses glass as a facade material, it can certainly have a bad impact on the environment, where the effect of the reflection of sunlight from the glass material can increase hot temperatures and dilute the ozone layer as a protective layer of the earth and what happens if the entire building uses glass as a material. The facade will certainly add to the worse of the things mentioned above.
In this paper, the author will analyze the value engineering of the facade material with the concept of an environmentally friendly building. In Value Engineering (VE) problems in general, the obstacles that are often encountered include in the design process, correcting mistakes made by planners, or doing recalculation that has been done by planners, reducing process costs, reducing costs by reducing excellence or appearance, and quality control.
Green Building and VE in the facade work process have never been carried out, even though VE activities in the facade work process are very necessary because they can create a function of the work process stages and reduce construction costs to be more efficient overall without reducing the function of the material and space in the hotel building.
The application of this system can achieve innovations in quality and cost efficiency and energy conservation that are obtained not at the beginning of development but obtained during planning so that the value of benefits is calculated in the future.
2. MATERIALS AND METHODS
2.1. Innovative Themes for High-Rise Hotel Building Design
The value engineering study in this research is used to identify additional functions as innovation so that it can form an alternative conceptual design model that leads to an increase in the economic value added of high-rise hotel projects.
The VE phase in Planning, according to Eng Karim Ragab, in his article on Planning and Project Controls Engineer SAVE International, there are stages/phases in planning Value Engineering activities, namely: 1) information gathering stage, 2) function analysis stage, 3) stage creativity and innovation, 4) development stage, 5) decision analysis stage, 6) decision-making stage, 7) implementation stage, 8) recommendation stage, and 9) research results.
Therefore, the implementation of Green Building and VE is expected to optimize in terms of construction costs. Some of the assumptions used in this study are as follows:
- How to implement the Green Building and VE method to the façade work of high-rise budget hotel projects?
- What factors affect the implementation of the Green Building and VE method to the façade work of high-rise budget hotel projects?
- What is the result of the implementation of the Green Building and VE method to the façade work of high-rise budget hotel projects?
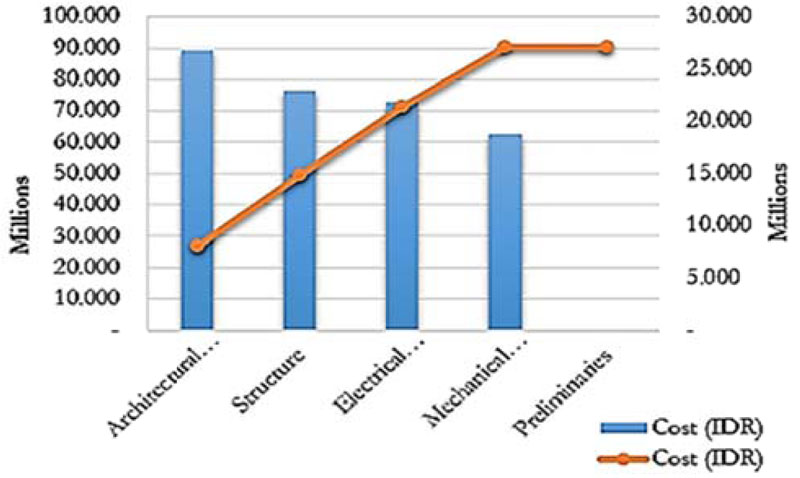
One way to determine the scope work of VE analysis is to use the Pareto distribution law. According to the Pareto distribution law (Pareto's Law Distribution-Vilfedro Pareto, 1848-1923 Italian Political Economist, and Engineer), 20% of the significant part of an item or system will represent 80% of the total cost [7].
Through the Pareto Test on the project cost of the project component or work for the VE study. Breakdown Cost Model can be seen as follows (Fig. 2).
In the façade work, it is known that the percentage of the total cost of building the façade is 6.21% of the total budget. So that if a figure exceeds the minimum standard is achieved, it is necessary to conduct a VE study to improve performance in terms of costs.
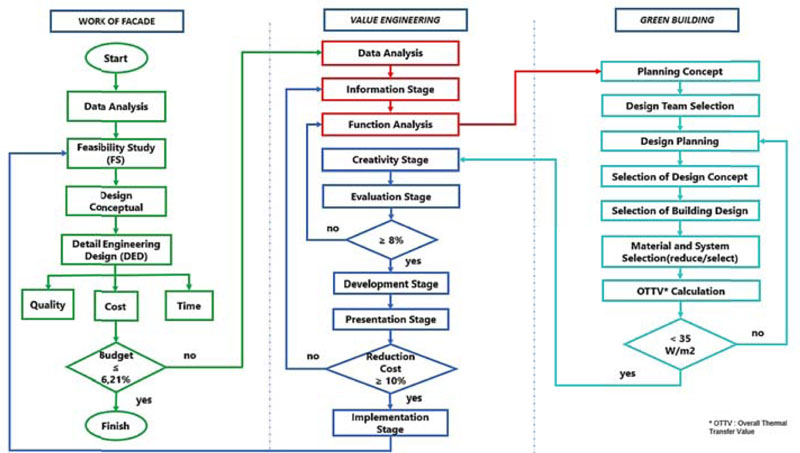
To conduct the VE study process stage through several analyzes, it is hoped that it can reduce costs and increase its function. The following is a diagram of applying the VE and Green Building methods to the façade work (Fig. 3).
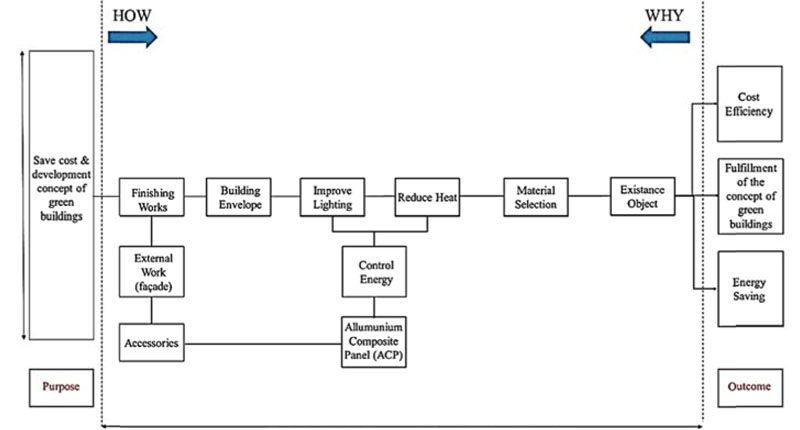
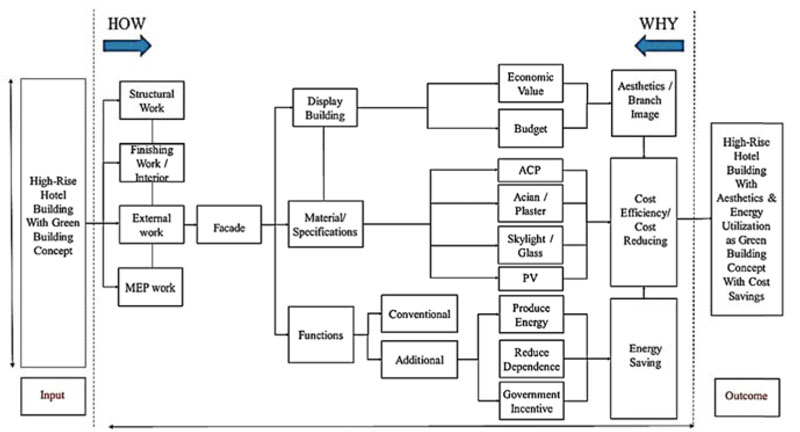
Furthermore, the function of finishing items for facade work is arranged in a FAST diagram (Fig. 4) so that the diagram will look like the following image after adding and creating functions to optimize the value of use (Fig. 5)
2.2. Façade Design Planning
In this study, the costs used are costs that have been recapitulated at the information stage. After the amount of cost and worth of each other finishing, the work item is determined, the ratio cost/worth is calculated. The cost/worth of facade work can be seen in Table 2 below.
| Design | Cost (IDR) |
| Existing Design | 3, 494, 885, 473 |
| Alternative to-1 | 5, 299, 439, 728 |
| Alternative to- 2 | 6, 835, 831,473 |
The reduced production of fossil energy, especially petroleum, and global commitments to reduce greenhouse gas emissions, encourage the Government to continuously increase the role of new and renewable energy as part of maintaining energy security and independence. Indonesia has the potential for new and renewable energy, which is large enough to achieve the target of the primary energy mix, especially for solar energy which reaches 207.8 GWp. [8]. Therefore, based on the concept of planning a Green Building by utilizing solar energy sources by referring to one of the main aspects in the guideline for determining the evaluation of a building's Green Building assessment, namely in terms of Energy Efficiency & Conservation which is applied to façade work using the PV system (Fig. 6).
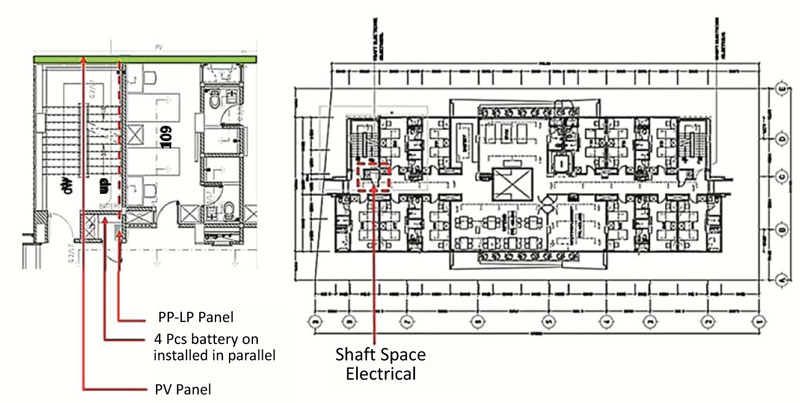
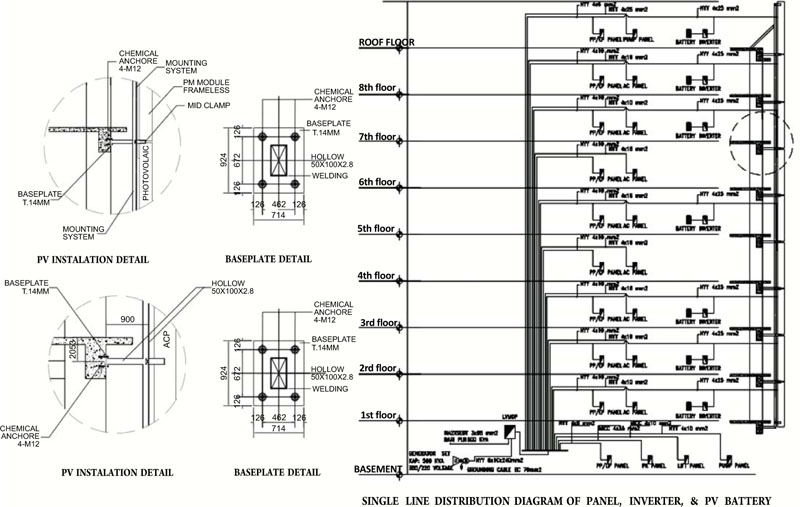
The determination of the PV installation method depends on the needs, which can be installed using the on-grid method or the off-grid method, in the design of the hotel building. It is designed using the On-Grid installation method which aims to reduce the use of electricity from PLN [9] (Figs. 7-9).

2.3. Estimation of Electrical Energy Efficiency
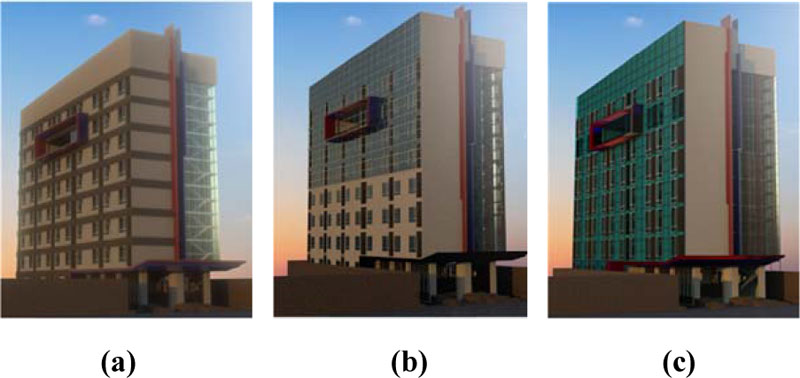
The choice of building facade design can be determined at the planning stage, but still in the same concept, namely Green Building. The façade area that will be modified by adding other materials to produce electricity is by using PV material on both sides of the building (east-west side) with an area of 2,122.60 m2.
This clean electricity will not only reduce an organization's electricity bill expenses, it will also help reduce the organization's carbon footprint. The difference between the three lies in the choice of materials used (Table 3).
Based on the data (Tables 4 and 5), the selected building design selection is on the second alternative, namely by using full PV.
| No. | Information | Existing Design | Alternative 1 | Alternative 2 | ||||||
|
Vol (M2) |
The Price of the Unit in Stalled (DR) |
Total (DR) |
Vol (M2) |
The Price of the Unit in Stalled (DR) |
Total (DR) |
Vol (M2) |
The Price of the Unit in Stalled (DR) |
Total (DR) |
||
| 1 | ACP Installation Cost |
2122, 60 | 1290,000 | 2738,154,000 | 976,11 | 1290,000 | 1259,187,429 | - | - | - |
| 2 | Installation Cost PV | - | - | - | 1146,49 | 2863,988 | 3283,520,836 | 2122,60 | 2863,988 | 6079,100,000 |
| 3 | Other Material Installation Cost | 549,40 | 1377,378 | 756,731,473 | 549,40 | 1377,378 | 756,731,473 | 549,40 | 1377,378 | 756,731,473 |
| - | Total | 3,494,885,473 | 5,299,439,728 | 6835,831,473 | ||||||
| Total Electricity Requirements XSANA Hotel | ||||||
| No. | Information | Floor | Electricity |
Operstionsl Length (Hours/ Day) |
Total Power (KVA) |
|
| (Watt) | (KVA) | |||||
| 1 | AC Panel | 2,3,4,5,6,8 | 28.200 | 28.20 | 12 | 338.40 |
| 2 | Pump Panel | Roof | 38.500 | 38.50 | 8 | 308.00 |
| 3 | Fire Pump Panel | - | 64.900 | 64.90 | 0 | - |
| 4 | Pump Panel | Parking | 22.800 | 22.80 | 8 | 182.40 |
| 5 | Lift Panel | - | 5.500 | 5.50 | 20 | 110.00 |
| 6 | AC Panel | 1 | 19.500 | 19.50 | 20 | 390.00 |
| 7 | AC Panel | 7 | 19.900 | 19.90 | 5 | 99.50 |
| 8 | PP/LP Panel | Roof | 3.122 | 3.12 | 8 | 24.98 |
| 9 | PP/LP Panel | Parking | 5.458 | 5.46 | 12 | 65.50 |
| 10 | PP/LP Panel | Roof | 3.804 | 3.80 | 8 | 30.43 |
| 11 | PP/LP Panel | 1 | 12.248 | 12.24 | 20 | 244.96 |
| 12 | PP/LP Panel | 2,3,4,5,6,8 | 16.462 | 16.46 | 12 | 197.54 |
| 13 | PP/LP Panel | 7 | 12.390 | 12.39 | 4 | 49.56 |
| Total | 252,784 | 2,041 | ||||
| No. | Location | Existing Design | Alternate 1 | Alternate 2 | ||||||
|
ACP (M2) |
PV (M2) |
Other Materials (M2) |
ACP (M2) |
PV (M2) |
Other Materials (M2) |
ACP (M2) |
PV (M2) |
Other Materials (M2) |
||
| 1 | 1st Floor | 261,60 | - | 65,40 | 261,60 | - | 65,40 | - | 261,60 | 65,40 |
| 2 | 2nd Floor | 178,63 | - | 44,66 | 178,63 | - | 44,66 | - | 178,63 | 44,66 |
| 3 | 3rd Floor | 178,63 | - | 44,66 | 178,63 | - | 44,66 | - | 178,63 | 44,66 |
| 4 | 4th Florr | 178,63 | - | 44,66 | 178,63 | - | 44,66 | - | 178,63 | 44,66 |
| 5 | 5th Floor | 178,63 | - | 44,66 | 178,63 | - | 44,66 | - | 178,63 | 44,66 |
| 6 | 6th Floor | 178,63 | - | 44,66 | - | 178,63 | 44,66 | - | 178,63 | 44,66 |
| 7 | 7th Floor | 124,77 | - | 44,66 | - | 124,77 | 44,66 | - | 124,77 | 44,66 |
| 8 | Balcony | 38,86 | - | 44,66 | - | 38,86 | 44,66 | - | 38,86 | 15,00 |
| 9 | 8th Floor | 178,63 | - | 44,66 | - | 178,63 | 44,60 | - | 178,63 | 44,66 |
| 10 | 9th Floor | 312,80 | - | 78,20 | - | 312,80 | 78,20 | - | 312,80 | 78,20 |
| 11 | 10th Floor | 312,80 | - | 78,20 | - | 312,80 | 78,20 | - | 312,80 | 78,20 |
| Total | 2.122,60 | - | 549,40 | 976,11 | 1.146,49 | 549,40 | - | 2.122,60 | 549,40 | |
| 2672’00 | 2.672,00 | 2672,00 | ||||||||
| No. | Present Value | Existing Design (IDR) |
Alternative 1 (IDR) |
Alternative 2 (IDR) |
|
| Initial Cost (IC) | 1 | Construction Costs | 3.494.885.473 | 5.299.439.728 | 6.835.831.473 |
| 2 | Total Initial Cost | 3.494.885.473 | 5.299.439.728 | 6.835.831.473 | |
| Investment Cost | 3 | Investment Benefits for the Future 25 years | - | - | 9.788.121.000 |
| Maintenance Cost Total | 4 | P/A Factors (n=25, i=9, 95%) | - | - | 9 |
| 5 | Annual Maintenance cost/ Treatment Per year (0.8% × IC) | 27.959.083.784 | 423.955.178 | 54.686.652 | |
| 6 | Present WORT of Annual Maintenance Cost | - | - | 498.086.024 | |
| Total | 7 | Total Cost Present Value | 3.494.885.473 | 5.723.394.906 | 17.122.038.497 |
2.4. Life Cycle Cost (LCC)
In analyzing the financial feasibility of a hotel façade project using the Lifecycle Cost analysis [10], the inflation rate for each function is increased according to its respective sectors.
For example in the transportation sector, freight rates and train tickets, and freight costs increase according to the inflation rate in the energy sector, the IRR and NPV for each function are calculated as shown in Table 6.
3. RESULTS
The results of this study are as follows:
- Implementation of high-rise hotel building façades based on Green Building and VE can be seen in the implementation flow chart, where several factors influence cost performance which is the research variable as indicators of success and the achievement of hypotheses in facade work performance.
- From the results of statistical analysis, there are 10 (ten) factors that most influence the application of the Green Building and VE methods on facade work; 1. Project Feasibility Study, 2. Detailed Engineering Design (DED), 3. Cost Usage, 4. Data Analysis, 5. Functional analysis 6. Development Stage, 7. Cost Reduction / Reduction Cost, 8. Design Concept Selection, 9. Image Specifications, 10. Material and System Selection (Reduce / Select).
- After the value and function engineering was carried out through case study analysis, with the use of PV material as much as 100% (floor 1 to floor 10) from 2 sides of the facade wall (east side and west side) which can produce ± 1,050 KVA of electricity from PLTS, and can reduce the use of electricity from PLN by 991 KVA, of the total hotel electricity needs that reach 2,041 KVA can reduce PLN electricity use by 47.32%.
- The hypothesis of this research is based on the results of statistical analysis and case studies. It can be concluded and proven that the application of the Green Building and VE methods can improve the cost performance of high-rise hotel building façades.
4. DISCUSSION
This research can still be developed more broadly by looking at the other side of the green building aspect, of course with the same object or even a different object, but still prioritizing the green building aspect, especially in saving energy.
CONCLUSION
The use of PV materials in high-rise building facade components, if applied optimally, will produce optimal electrical power, besides that it is also an environmentally friendly material with reference to the green concept.
CONSENT FOR PUBLICATION
Not applicable.
AVAILABILITY OF DATA AND MATERIALS
The data that support the findings of this study are available from the corresponding author [A.E.H], on request.
FUNDING
None.
CONFLICT OF INTEREST
The authors declare no conflict of interest, financial or otherwise.
ACKNOWLEDGEMENTS
The author would like to express his gratitude to all related parties that the author cannot mention one by one, and most especially for someone who is always supportive of everything. wouldn't have gotten this far without your support. This research is not yet perfect, it would be nice if anyone could explore this research further and be able to work together.

