All published articles of this journal are available on ScienceDirect.
Interaction between the Local and General Zone for the Post-tensioned Girder Anchorage Zone
Abstract
Background:
The use of post-tensioning in girders causes high bearing and compressive stresses in the anchorage zone. In this study, the behavior of the anchorage zone and the interaction between the local and general zone are investigated. The variables included different reinforcements for both the local and general zones for a block of two anchorage devices.
Methods:
Both experimental and numerical methods have been applied to study the behavior of the anchorage zone. The experimental part of the study involved laboratory testing of sixteen specimens, and the numerical study was conducted using ABAQUS non-linear finite element analysis.
Results:
Tie reinforcement provided additional confinement for the local zone, and this confinement was more for the specimens with originally less confined spiral reinforcement strength. There was a slight or no effect of the local zone reinforcement on the general zone strength and ultimate load of the anchorage zone when the failure was in the general zone.
Conclusion:
Confinement of the local zone prevented the brittle bearing and compression failure of this zone.
1. INTRODUCTION
In pre-stressed concrete, internal compressive stresses are induced by means of pre-stressed reinforcement to reduce tensile stresses in the concrete due to applied loads. The use of post-tensioned concrete allows for longer spans and smaller cross-sections in structures, especially bridges. Post-tensioned girders are subjected to a high concentration of compressive stresses at the anchorage zone due to the transfer of prestressing force at the girder end through bearing plates and anchors [1-3]. One of the most critical aspects of post-tensioned construction is the anchorage zone which is also necessary for the success of the system [4]. A local failure may occur in the immediate vicinity of the anchorage device if the local stresses exceed the compressive strength of the concrete [5]. To enhance the local compressive strength, spiral or tie confining reinforcement is used in this region. Moreover, at the larger distance from the anchorage device, large tensile stresses develop, which can lead to cracking of the concrete in tension [6]. It is essential to understand the interaction between the local zone and general zone, and their influence on the behavior and strength of the anchorage zone, especially for the real cases that involve multiple anchorage devices.
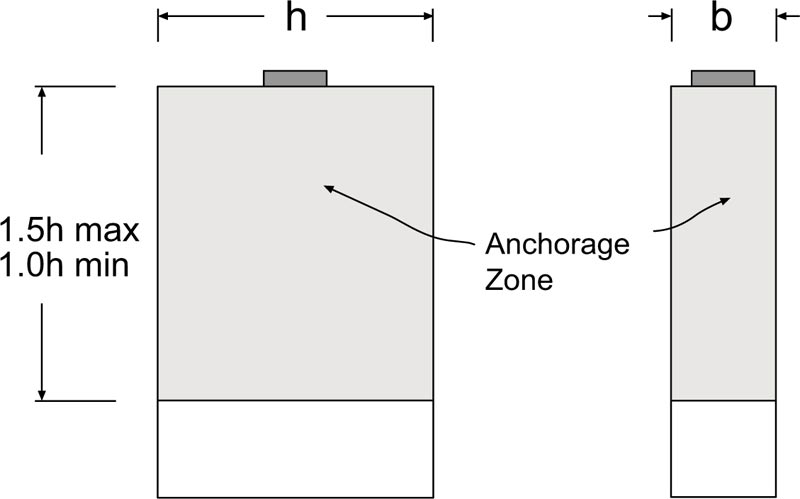
A typical anchorage zone has been shown in Fig. (1), which is defined as the volume of concrete through which the concentrated pre-stressing force at the anchorage device spreads transversely to a more linear stress distribution across the entire cross-section at some distance from the anchorage device [7-9]. Within the anchorage zone, the bending theory is not valid because the ordinarily assumed linear strain distribution is disturbed by the introduction of the concentrated anchorage force.
According to the American Association of State Highway Transportation Officials (AASHTO) specifications [9], the longitudinal extent of the anchorage zone in the direction of the tendon shall be taken between 1.0 h and 1.5 h, where h refers to the greater transverse dimensions of the anchorage zone. Moreover, the transverse dimensions of the anchorage zone may be taken as the depth and width of the section but not larger than the longitudinal dimension of the component or segment.
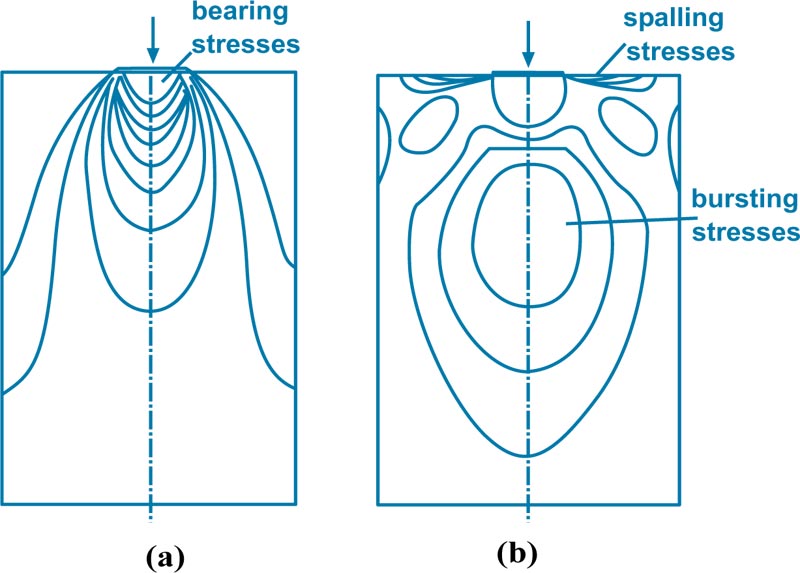
As shown in Fig. (2), there are different types of stresses in the anchorage zone [7, 10]. The region ahead of the concentrated force is subjected to high compressive and bearing stresses. Bursting stresses are lateral tensile stresses that result from the deviation of the compressive stresses parallel to the force. This type of stress acts at a region that extends a certain distance ahead of the anchorage device. Spalling stresses are local tensile stresses which are found along the loaded edge of the member.
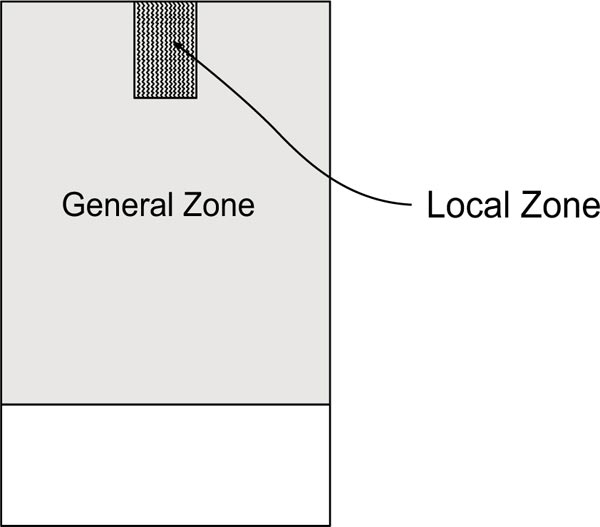
Fig. ( 3 ) shows the two regions of the anchorage zone that include the local zone and the general zone [7, 9,11,12].
The region ahead of the anchorage device is the local zone. In order to resist the high compressive and bearing stresses in this region, spiral or tie confining reinforcement is provided in the local zone. AASHTO Specifications [9] recommend the transverse dimensions of the local zone to be greater than the bearing plate size with concrete cover and the outer dimension of confining reinforcement plus concrete cover. The length of the local zone along the tendon axis is considered greater than the local zone width and the length of the confining reinfo- rcement. Pre-stressing force is transferred from the local zone into the general zone.
The region of concrete outside the vicinity of the local zone, into which the high concentrated pre-stressing forces from the anchorage device spread throughout, is called the general zone.
This region is subjected to bursting tensile stresses due to the spreading of the tendon force into the structure. Transverse reinforcement is provided in the general zone to resist bursting stresses.
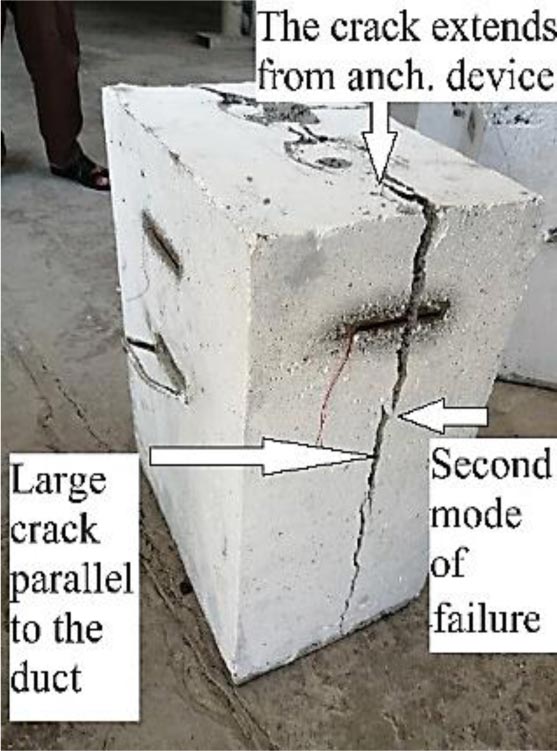
Three main modes of failure can be recognized in the anchorage zone [6]. The first mode is due to the high bearing and compression stresses in the local zone. This failure occurs if the compressive strength of concrete is insufficient or lacks confining reinforcement. The surface of rupture is often in the shape of a pyramid or cone. The second mode of failure occurs due to insufficient transverse reinforcement for bursting tensile stresses in the general zone. This mode is characterized by large cracks running parallel to the duct and extending from the anchorage device, as shown in Fig. (4). The third mode of failure is at the interface between the local zone and the general zone, and is due to compression failure of unconfined concrete at the end of confining reinforcement.
Three main methods for the analysis of stresses in the anchorage zone are used. These include Finite Element analysis, Strut- and-Tie-Model and approximate method. If the post-tensioned anchorage zone is not properly detailed and designed to withstand the forces and stresses which develop, failure of the anchorage zone can occur.
The research project conducted in the early 1990s at the University of Texas at Austin, under the support of the National Cooperative Highway Research Program (NCHRP) [7, 11], is considered one of the main studies in the field of anchorage zone. Roberts [7, 8,13], as a part of this work, suggested the following equation to predict the ultimate load capacity of the local zone:
 |
(1) |
Where, Fult is the ultimate load of the local zone, fcʹ is the concrete compressive strength, A is the effective supporting area geometrically similar to the shape of the loaded anchorage plate, Ab is the bearing area, flat is the lateral confining strength, Acore is the area confined by the local confining reinforcing, s is the pitch or the spacing of the confining reinforcement, D is the outside diameter of confining reinforcement.
The experimental investigations of general zones by Sanders [4, 8, 7] were performed parallel to the analytical investigations using the linear elastic finite element method performed by Burdet [6]. Wollmann et al. [14] studied the design and behavior of end diaphragms when used for the anchorage of external tendons. The experimental test included three half-scale specimens. Kim et al. [15] conducted an experimental and numerical study to predict the ultimate resisting capacity of the HPC and UHPC anchorage zones, while many researchers [1,16-19] investigated the use of fiber-reinforced concrete in anchorage zones.
The performance of the anchorage zone is critical for the safety and stability of the whole concrete structure. It can be inferred from the literature that the interaction between the local zone and general zone, and their influence on the behavior and strength of the anchorage zone with multiple anchorage devices have not been studied. To overcome this knowledge gap, the present study investigated the interaction between the local zone and general zone, and their influence on the behavior and strength of the anchorage zone with multiple anchorage devices. The variables included different reinfo- rcements for both the local and general zones for a block of two anchorage devices. The anchorage zone with multiple anchorage devices represents a more realistic case compared to the single anchorage device in most post-tensioned const- ructions. The experimental part of the study included casting and testing sixteen specimens arranged in four groups, and the numerical part included finite element analysis using the ABAQUS program.
2. MATERIALS AND METHODS
The following sections present the details of the experimental work related to preparing and testing the specimens.
2.1. Size and Shape of the Test Specimens
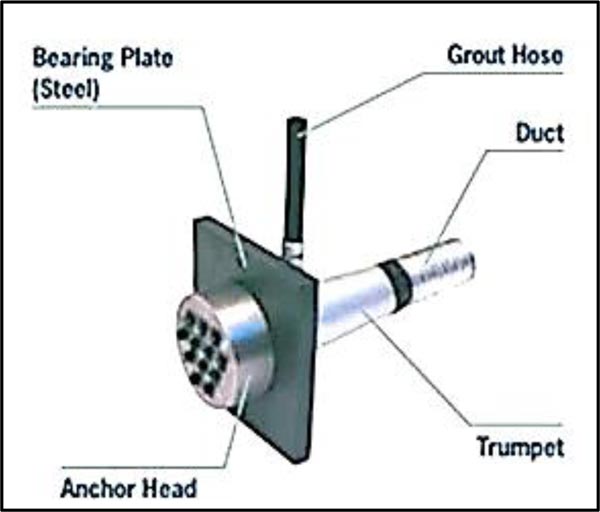
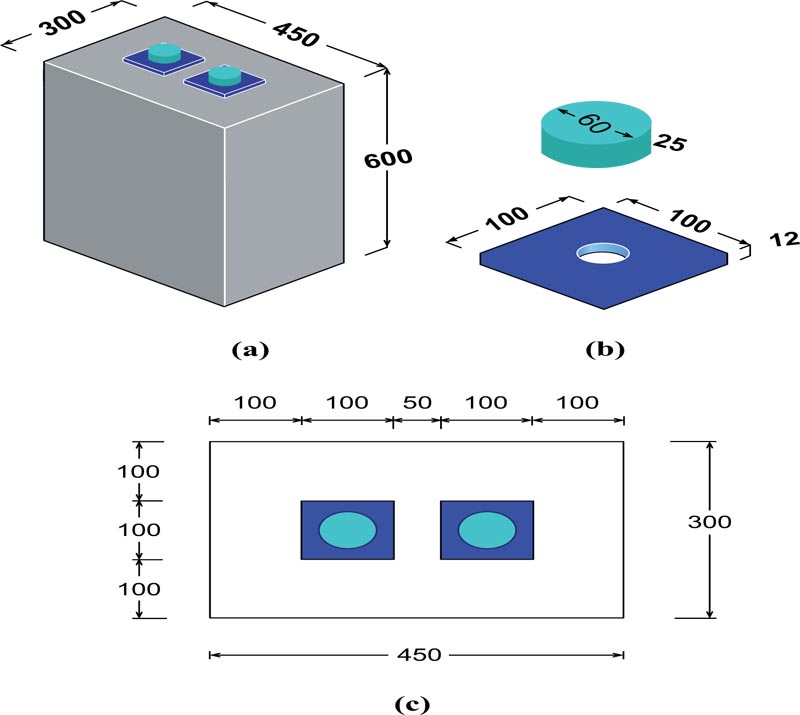
The test specimen included a concrete block with two anchorage devices [20]. The standard anchorage device VSL E 5-19 [21, 22], shown in Fig. (5), was selected for modeling the specimens. The scale factor for the anchorage device was one-third, which was selected based on the capacity of the loading frame of the laboratory. As shown in Fig. (6), the final dimensions of the anchorage plate were 100 mm x 100 mm with a thickness of 12 mm, and the wedge plate (anchorage head) was of 60 mm diameter and 25 mm depth.
AASHTO approximate method section 5.8.4.5 was used to determine the transverse dimensions of the concrete block. This method recommends a minimum edge distance of 1.5 times the corresponding lateral dimension, “a”, of the ancho- rage plate for a proper stress distribution of the anchorage zone. Moreover, the depth of the block was selected to be within the limits recommended by AASHTO specifications (refer to Fig. 1). Duct holes were made by using 30 mm diameter aluminum tubes with a negligible strength. This diameter represented a scale of one-third of the duct diameter of 90 mm required for the number of strands for anchorage devices VSL E 5-19 [21]. The final dimensions of the specimen were 300 mm x 450 mm x 600 mm.
2.2. Materials and Reinforcement Details
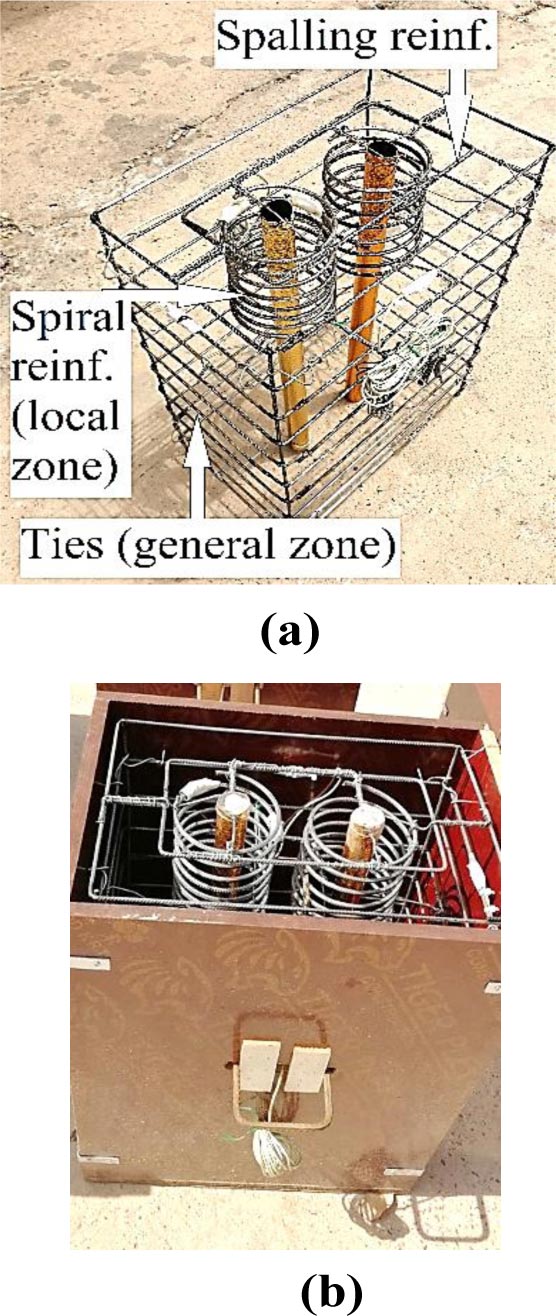
As shown in Fig. (7), the local zone for each anchorage device was confined by a deformed steel bar spiral of 120 mm diameter, which was close to the anchorage plate size, and represented a scale of one-third of the spiral diameter of 365 mm required for the anchorage devices VSL E 5-19 [21, 22]. The spiral consisted of 8 turns with 20 mm pitch and a total length of 140 mm. Spirals were located 10 mm under the anchorage plate, and as a result, a total depth of 150 mm of the anchorage zone was confined. This depth represented the length of the local zone along the tendon axis, which was designed according to AASHTO specifications mentioned in section 1. Ties of deformed steel bars were provided to resist tensile bursting stresses in the general zone for both directions. The first tie was fixed at 10 mm from the loading face and continued for the whole block depth with a spacing of 60 mm. The spacing of the ties was within the maximum limits of AASHTO specifications [7,23] of 300 mm and 24 bar diameter for the bursting reinforcement. As variables, different bar sizes have been used for the reinforcement of the spirals and ties. The tested properties of concrete and reinforcing bars are presented in Table 1.
| Test | Results |
|---|---|
| Concrete (results at the age of 56 days) | - |
| Compressive strength (MPa) | 49.95 |
| Splitting tensile strength (MPa) | 4.7 |
| Elastic modulus (GPa) | 33.75 |
| Steel Bars | - |
| Yield stress-ϕ6 mm (MPa) | 401 |
| Yield stress-ϕ5 mm (MPa) | 495.5 |
| Yield stress-ϕ4 mm (MPa) | 428 |
| Group | Specimen | Spiral | Tie |
|---|---|---|---|
| No. | No. | bar size | bar size |
| - | - | (mm) | (mm) |
| G1 | SP1 | 6 | 6 |
| SP2 | 6 | 5 | |
| SP3 | 6 | 4 | |
| SP4 | 6 | 0 | |
| G2 | SP5 | 5 | 6 |
| SP6 | 5 | 5 | |
| SP7 | 5 | 4 | |
| SP8 | 5 | 0 | |
| G3 | SP9 | 4 | 6 |
| SP10 | 4 | 5 | |
| SP11 | 4 | 4 | |
| SP12 | 4 | 0 | |
| G4 | SP13 | 0 | 6 |
| SP14 | 0 | 5 | |
| SP15 | 0 | 4 | |
| SP16 | 0 | 0 |
2.3. Experimental Variables
As presented in Table 2, the study included sixteen specimens in four groups to show the interaction between the local zone and the general zone. Each of the mentioned four groups included a constant bar size for the spiral reinforcement (local zone) and different bar sizes for the ties reinforcement (general zone). Hence for the four groups, there were four different bar sizes for the spiral reinforcement.
For the control specimen (SP7), the bar size for the spiral and tie reinforcement was ⱷ5mm and ⱷ4mm, respectively. This amount of reinforcement, which was based on ABAQUS [24] finite element analysis prior to the experimental work, was provided to prevent the general zone failure, and to allow the failure of the control specimen to occur in the local zone. Similarly, and based on ABAQUS finite element analysis, one closed tie of ⱷ4mm surrounding both anchorage plates was used as spalling reinforcement at the loaded edge for all specimens.
2.4. Test setup and instrumentation
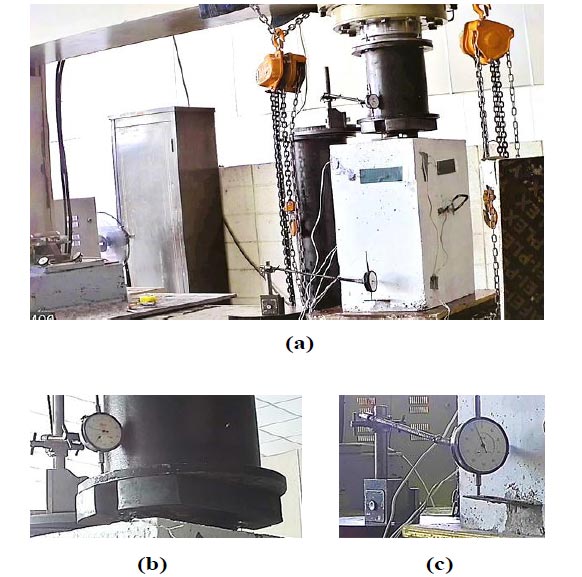
As shown in Fig. (8), the test machine consisted of a steel frame with a capacity of 2500 kN. Application of the load was performed through a hydraulic circular jack to a beam, and then to the two wedge plates of the anchorage devices. The specimen was supported over the lower part of the frame through a plate 50 mm thick. Directly under the specimen, there was a thin layer of plywood in order to provide uniform support.
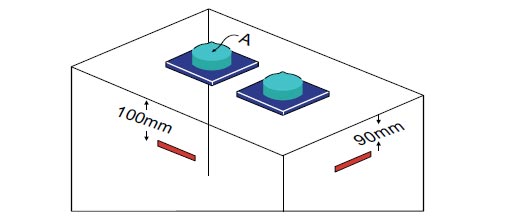
The vertical displacement of the specimen was measured through the anchorage device axis, shown as point A in Fig. (9). This displacement was obtained as the difference of the reading of two dial gauges. The top dial gauge was attached to the loading plate, and the lower dial gauge was attached to a plate at the bottom of the specimen, fixed during casting of the concrete. Two strain gauges with 80 mm length were used to measure the strain of the concrete at the critical elastic bursting stresses, at both the short and long sides of the specimen. These locations, shown in Fig. (9), were determined according to ABAQUS finite element analysis prior to the experimental work. Moreover, two strain gauges of 5 mm length were used to measure the strain of ties. These strain gauges were fixed at the center of the short and long part of the second tie, which according to the finite element analysis were found to be the critical locations.
3. NUMERICAL FINITE ELEMENT MODELING
ABAQUS was used to perform the numerical simulation in this study. This software can solve a wide range of linear and non-linear problems.
3.1. Geometric Modeling and Boundary Conditions
To minimize the computational cost, only half of the speci- men was represented in numerical modeling by ABAQUS, as the specimen had axes of symmetry located at the mid-plane between the two anchorage devices. Three-dimensional solid members were used to model the concrete block, anchorage and wedge plates. The reinforcements were defined using deformable “wire” type parts. A wire is represented as a line in ABAQUS.
The bottom surface of the model was supported in the Y direction, and the axial load was applied as a specified vertical displacement over the wedge plates, with the use of amplitude function (smooth step). The analysis was conducted in step-1 (Dynamic, Explicit), which was after the initial step.
3.2. Material Modeling
In order to represent the behavior of the experimentally tested specimens with the FE model, the material models in FE should accurately describe the properties of the materials and the interactions between them.
3.2.1. Concrete
To describe the behavior of concrete under loading, the Concrete Damage Plasticity (CDP) model, which is available in ABAQUS, was used. CDP takes into consideration the degradation of the concrete, and assumes two main concrete failure mechanisms which are cracking under uniaxial tension and crushing under uniaxial compression. The parameters required to define the plasticity model of concrete are dilation angle (ψ), the plastic potential eccentricity of concrete, the ratio of compressive stress in the biaxial state to the compressive stress in the uniaxial state (fbo / fco), the shape factor of yielding surface (K) and viscosity parameter. Table 3 presents the CDP required parameters that were used in this study [24-26]. Moreover, a value of 0.18 was selected for Poisson’s ratio in this study [27-29].
The stress-strain relationship of concrete under uniaxial compression was described using compressive strength test results (Table 1) and the equation proposed by Saenz [30], which has the following form:
 |
(2a) |
 |
(2b) |
| Dilation angle (ψ) | 31° |
| Eccentricity | 0.1 |
| biaxial/uniaxial ratio (fbo / fco) | 1.16 |
| k | 0.667 |
| Viscosity parameter | 0 |
 |
(2c) |
 |
(2d) |
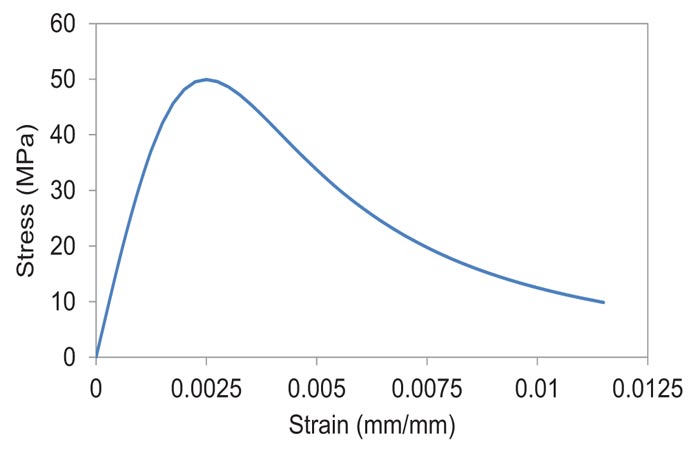
Where, Rσ=4 and Rε=4 may be used, σc is the effective stress, εc is the effective strain, Ec is the initial modulus of elasticity and ε0 is the concrete strain at peak stress which was assumed to be 0.0025. The curve of the stress-strain relation- ship for compression in this study is shown in Fig. (10).
The following two equations, which represent the ascen- ding and descending parts of the curve, have been used for the stress-strain relationship of concrete in tension [31-34].
 |
(3a) |
 |
(3b) |
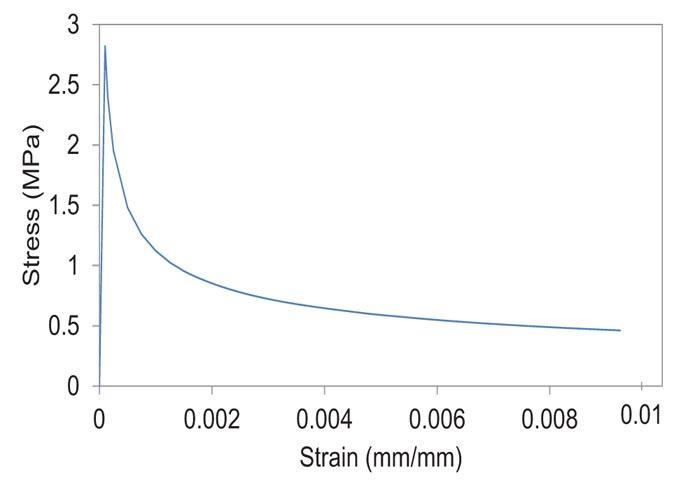
Where, εt is the concrete tensile strain, εcr is the concrete strain at peak stress (at cracking), assumed as 0.0001 in this study, and ft is the tensile strength of the concrete (peak stress). The direct tensile strength of concrete is 0.5 to 0.7 of its splitting tensile strength [35]. In this study, the direct tensile strength is assumed as 0.6 of the tested splitting tensile strength mentioned in Table 1, providing a result of 2.82 MPa. The tensile stress-strain curve for this study is shown in Fig. (11).
Damage parameters dc and dt are used to determine the degradation of concrete for compression and tension, respectively. In this study, the compression damage parameter dc is defined as the ratio of the concrete compression stress after crushing to the initial yield stress. Similarly, the tension damage parameter, dt is defined as the ratio of the concrete tensile stress after cracking to the ultimate tensile stress [26]. Moreover, a value of wc=0.8 has been used for the compressive stiffness recovery factor, assuming that compressive stiffness is mostly recovered upon crack closure as the load changes from tension to compression. The tensile stiffness recovery factor, wt=0 is used, assuming that tensile stiffness is not recovered as the load changes from compression to tension once the crushing of concrete is initiated.
3.3. Element Types and Mesh Generation
All solid members (concrete, anchorage plates and wedge plates) were meshed using eight nodes bricks type C3D8R, reduced integration and hourglass control, as shown in Fig. (12). These are first-order hexahedral elements that provide good results for minimum cost in three-dimensional analyses. A two-node, three-dimension truss element type T3D2 was used for the reinforcement (spirals and ties). The general size of the elements was 10 mm. The square shape of the anchorage plate with a circular hole at the center required good meshing techniques in order to keep the hexahedral element for this process. This issue led to the use of an element size of 7.5 mm in certain parts of the plate. Moreover, it was intended to keep the same meshing shape in the contact parts between the anchorage plate and the concrete, and between the anchorage plate and the wedge plate, which uses an element size of 7.5 mm in some parts of these members.
Before using the mesh size of 10 mm, a mesh sensitivity test was performed to find the effect of mesh size on the results. Under this test, mesh sizes of 20 mm, 15 mm and 10 mm were applied to the concrete and reinforcement for the control specimen (SP7). The case of mesh size of 10 mm had the closest load-displacement relationship and ultimate load compared to the experimental results. Based on these results, the mesh size of 10 mm was selected for the FEA in this study.
4. RESULTS AND DISCUSSION
The following sections present the experimental and numerical results that include the ultimate load, load-displace- ment behavior, load-strain behavior, bursting stresses, cracking pattern and failure mode of the specimens.
4.1. Ultimate Load
Table 4 presents values of the ultimate load of the specimens for both the experimental test and ABAQUS FEA. The first comparison of the ultimate load was made among the specimens that were designed to fail in the local zone. In every group, this included the three specimens that had tie reinforcement. The ultimate load for group G1 was between 1358.1 kN and 1372 kN for the three specimens that had tie reinforcement. This implies almost no change in the ultimate load for group G1 by changing tie bar size from ϕ4 mm to ϕ6 mm. This is justified because the spiral reinforcement of ϕ6 mm for this group provided strong lateral confinement for the local zone, and hence the additional confinement from ties had a negligible effect. This was not the case for group G2, reinforced with ϕ5 mm spirals, as the ultimate load increased with the increase in tie bar size. The ultimate load for this group increased from 1266.4 kN (SP7) to 1390 kN (SP5) by increasing the tie bar size from ϕ4 mm to ϕ6 mm. This represented an increase of 9.8% in the ultimate load of the specimens. The influence of tie bar size on ultimate load was even more in group G3 that included specimens with weak spiral reinforcement (ϕ4 mm). The ultimate load increased from 1190 kN (SP11) to 1341 kN (SP9) by increasing the tie bar size from ϕ4 mm to ϕ6 mm, representing an increase of 12.7%, which was more than the increase in group G2. These results of groups G1, G2, and G3 showed that the tie reinforcement influenced the ultimate load of the anchorage zone. This influence was more when the spiral bar size was less (almost 0%, 9.8%, and 12.7% for groups G1, G2, and G3, respectively). This indicated that the tie reinforcement provided additional confinement for the local zone, and this additional confinement was more for the specimens with originally less confined spiral reinforcement strength. Nevertheless, this issue did not apply to group G4 that includes specimens without spiral reinforcement. For this group, the maximum ultimate load was 1187.5 kN for specimen SP13 (tie bar size of ϕ6 mm), compared to the ultimate load of 1114.5 kN for specimen SP15 (tie bar size of ϕ4 mm), representing an increase of only 6.6%. This indicated that the tie reinforcement could not significantly improve the ultimate load of the anchorage zone when the spiral confinement of the local zone was not available.
The second comparison of the ultimate load was for the specimens that were designed to fail in the general zone. This includes the specimens without tie reinforcement (SP4, SP8, SP12 and SP16 shown in Table 4). The ultimate load and behavior of these specimens differ from the behavior of other specimens in these groups. As designed, these specimens did not include bursting stress reinforcement, and the general zone failed. This kind of failure was clear in the cracking and failure pattern of the specimens. All these specimens had a brittle failure, especially SP16 that had a sudden failure at ultimate load. The comparison of ultimate load among these four specimens is explained in more detail as group A4 later in this section.
The same specimens presented in Table 4 were rearranged as additional groups in Table 5 by fixing the tie bar size for each new group and changing the spiral bar size. Hence tie bar size is ϕ6 mm, ϕ5 mm, and ϕ4 mm for the groups A1, A2, and A3, respectively. Specimens in group A4 have no tie reinfo- rcement. For every new group in this table, the effect of spiral bar size on the ultimate load is investigated. The effect of spiral reinforcement was more clear for the groups of specimens with smaller tie bar size (ϕ4 mm compared to ϕ5 mm and ϕ6 mm). Increasing the spiral bar size increased the ultimate load by just 3.7% for group A1 (tie bar size ϕ6 mm), and 2% for group A2 (tie bar size ϕ5 mm). The same change in spiral bar size increased the ultimate load for group A3 (tie bar size ϕ4 mm) by 15.3%.

| Gr. | Sp. | Spiral | Tie | Exp. ult. | FEA ult. | PEXP/ |
|---|---|---|---|---|---|---|
| No. | No. | bar size | bar size | load PEXP | load PFEA | PFEA |
| - | - | (mm) | (mm) | (kN) | (kN) | % |
| G1 | SP1 | 6 | 6 | 1371 | 1356.5 | 101.1% |
| SP2 | 6 | 5 | 1358.1 | 1348.4 | 100.7% | |
| SP3 | 6 | 4 | 1372 | 1340 | 102.4% | |
| SP4 | 6 | 0 | 1134.4 | 1287.8 | 88.1% | |
| G2 | SP5 | 5 | 6 | 1390 | 1307.5 | 106.3% |
| SP6 | 5 | 5 | 1354 | 1293.6 | 104.7% | |
| SP7 | 5 | 4 | 1266.4 | 1268 | 99.9% | |
| SP8 | 5 | 0 | 1117 | 1213 | 92.1% | |
| G3 | SP9 | 4 | 6 | 1341 | 1235 | 108.6% |
| SP10 | 4 | 5 | 1331 | 1219.4 | 109.2% | |
| SP11 | 4 | 4 | 1190 | 1210.8 | 98.3% | |
| SP12 | 4 | 0 | 1085 | 1116.6 | 97.2% | |
| G4 | SP13 | 0 | 6 | 1187.5 | 990 | 119.9% |
| SP14 | 0 | 5 | 1177.6 | 985.8 | 119.5% | |
| SP15 | 0 | 4 | 1114.5 | 978 | 114.0% | |
| SP16 | 0 | 0 | 1098.6 | 927.2 | 118.5% |
| Gr. | Sp. | Spiral | Tie | Exp. ult. | FEA ult. | PEXP/ |
|---|---|---|---|---|---|---|
| No. | No. | bar size | bar size | load PEXP | load PFEA | PFEA |
| - | - | (mm) | (mm) | (kN) | (kN) | % |
| A1 | SP1 | 6 | 6 | 1371 | 1356.5 | 101.1% |
| SP5 | 5 | 6 | 1390 | 1307.5 | 106.3% | |
| SP9 | 4 | 6 | 1341 | 1235 | 108.6% | |
| SP13 | 0 | 6 | 1187.5 | 990 | 119.9% | |
| A2 | SP2 | 6 | 5 | 1358.1 | 1348.4 | 100.7% |
| SP6 | 5 | 5 | 1354 | 1293.6 | 104.7% | |
| SP10 | 4 | 5 | 1331 | 1219.4 | 109.2% | |
| SP14 | 0 | 5 | 1177.6 | 985.8 | 119.5% | |
| A3 | SP3 | 6 | 4 | 1372 | 1340 | 102.4% |
| SP7 | 5 | 4 | 1266.4 | 1268 | 99.9% | |
| SP11 | 4 | 4 | 1190 | 1210.8 | 98.3% | |
| SP15 | 0 | 4 | 1114.5 | 978 | 114.0% | |
| A4 | SP4 | 6 | 0 | 1134.4 | 1287.8 | 88.1% |
| SP8 | 5 | 0 | 1117 | 1213 | 92.1% | |
| SP12 | 4 | 0 | 1085 | 1116.6 | 97.2% | |
| SP16 | 0 | 0 | 1098.6 | 927.2 | 118.5% |
Group A4 in Table 5 included specimens without tie reinforcement, and as designed, had general zone failure. Results of this group allowed studying the effect of the spiral bar size on the ultimate load of the specimens when the failure was in the general zone. This comparison represented an investigation of the effect of local zone reinforcement on the general zone strength. By comparing the specimen SP4 with SP16, the increase in ultimate load was only 3.3% by using a spiral bar size of ϕ6 mm compared to the case without spiral reinforcement. Hence, there was a slight or no effect of the local zone reinforcement on the general zone strength and ultimate load of the anchorage zone when the failure was in the general zone.
The last two columns of Table 4 and Table 5 present results of the ultimate load of ABAQUS FEA, and the comparison with the experimental test. FEA results are very close to the experimental tests, and the percentage of experimental to FEA ultimate load is within the range of 98.3-109.2% for the specimens that had spiral and tie reinforcement. Moreover, the FEA showed similar results to the experimental tests regarding the effect of different variables on the ultimate load of the anchorage zone.
4.2. Load-displacement Relationship
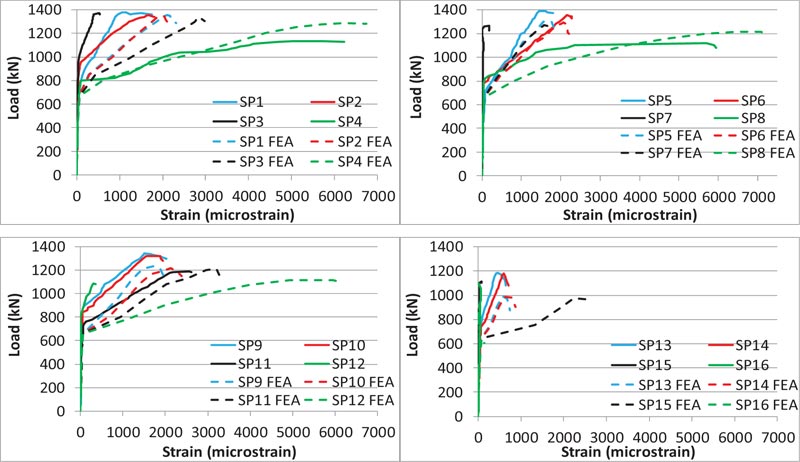
Figs. ( 13 and 14 ) show the load-vertical displacement relationship for the specimens in different groups. Initially, the specimens showed the same linear behavior and then approxi- mately the same non-linear relationship, especially for the specimens with a spiral reinforcement. Compared to the other specimens, the cases without spiral reinforcement (SP13, SP14, SP15, SP16) showed more brittle failure, especially for the specimen SP16 (without spiral and tie reinforcement) that had a sudden failure. Compared to the specimen SP16, the general zone ties for specimens SP13, SP14 and SP15 provided slight confinement for the local zone.
The curves also show some agreement between the experimental and FEA results, with the experimental values of displacement for most of the specimens slightly more than the finite element analysis, especially at the beginning stages. This is justified with respect to the reasons that are detailed in section 4.3.
It was observed in FEA that at ultimate load, the top turns of the spiral reinforcement were at yield, and then gradually, the other turns downward were yielding. This gave a flat relationship after the ultimate load for the specimens with spiral reinforcement compared to the specimens without spiral reinforcement.
4.3. Stiffness
It can be observed in Figs. (13 and 14) that FEA values of stiffness are greater than the experimental results. This difference is justified for many reasons that include the following:
• There are some differences between the FEA modeling and the experimental specimens. In FEA modeling, perfect homogenous materials are assumed for concrete, which could not be the case for the experimental specimens. FEA also assumes a perfect connection between the concrete and other parts of the model that include the reinforcement and steel plates. Moreover, micro-cracks produced by drying shrinkage would reduce the stiffness of the experimental specimens.
• For the experimental data, some secondary vertical displacement is added as a result of instruments setting, closing up with the anchorage devices, and secondary movement of the loading machinery. This additional displacement reduces the stiffness values for the experimental specimens.
There were some difficulties in measuring the total vertical displacement of the experimental specimens, which, as shown in Fig. (8), was determined by the difference of reading of two dial gauges, fixed at the top and bottom of the specimens. This, in addition to the secondary displacement mentioned before, has an effect on the precision which is expected when comparing the displacement, and hence the stiffness, among different experimental specimens, taking into consideration that the required displacement to be measured at the linear stage was parts of 1 mm.
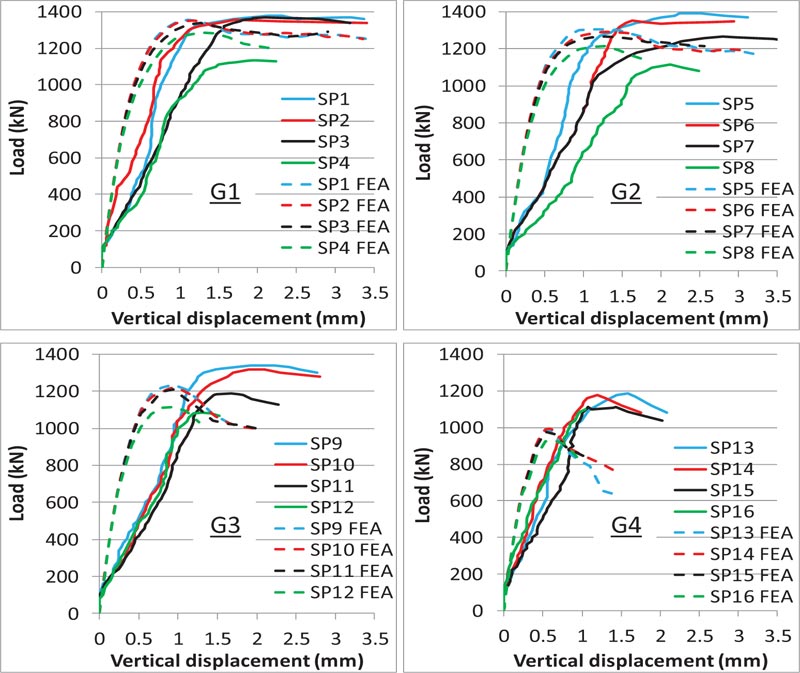
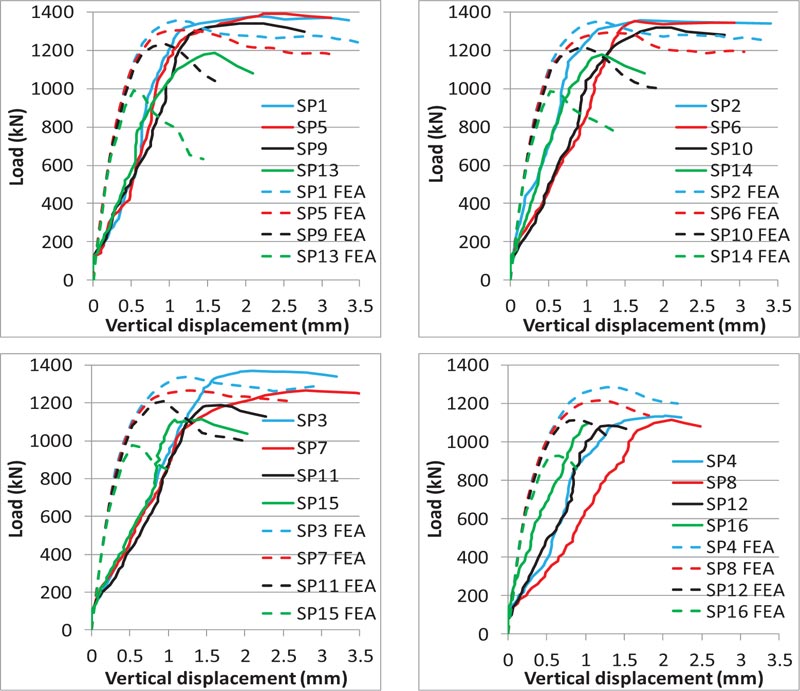
The groups G1 and G2 in Fig. (13) show greater stiffness for the specimens with stronger tie reinforcement in the general zone. In group G1, the specimens SP1 (with ϕ6 mm tie reinforcement) and SP2 (with ϕ5 mm tie reinforcement) have more stiffness than SP3 (with ϕ4 mm tie reinforcement) and SP4 (without tie reinforcement). In group G2, and for the same reason, the specimen SP5 has a greater stiffness than the other specimens in the group. Tie reinforcement resists the tensile bursting stresses in the general zone, and reduces cracks propagation, increasing the stiffness of the specimens. The effect of tie reinforcement on the stiffness of the specimen is more clear in groups G1 and G2 compared to the other groups. This is justified with respect to the reason that the local zone in these two groups is confined with strong spiral reinforcement (ϕ6 mm and ϕ5 mm). The local zone in these two groups will not crack at the linear stage, and hence will not affect the values of the stiffness of the specimens.
Considering the precision that is expected due to the points mentioned in this section, the other curves in Figs. (13 and 14) show a close stiffness among most of the experimental specimens of the same group, except SP8 in Fig. (14).
4.4. Load-strain Relationship
4.4.1. Ties
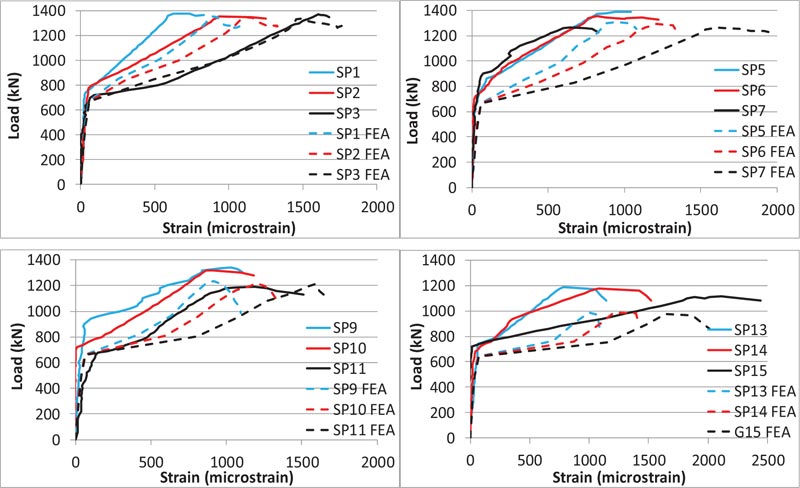
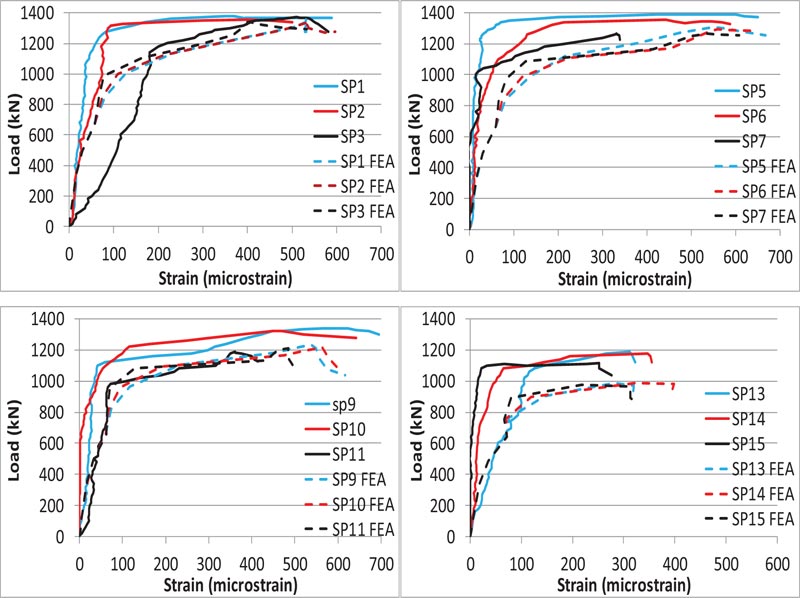
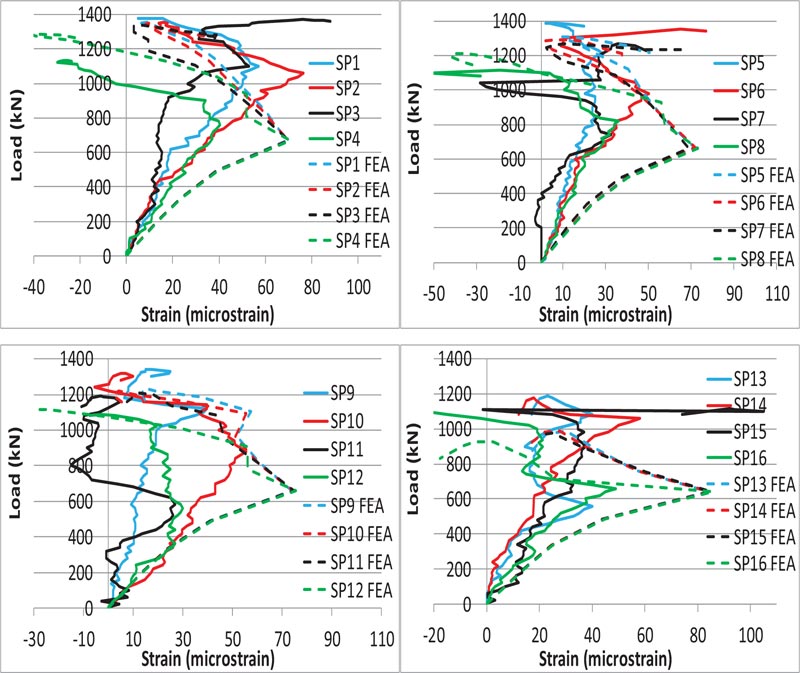
Load versus axial strain curves for the ties for the short and long direction are shown in Figs. (15 and 16), respectively. The strain considered was at the center of the second ties for both the short and long direction, which represented the critical location for the tensile stresses. There is a good agreement in these curves as observed from the FEA and the experimental results.
The yielding strain for ties was 2005 μm, 2478 μm and 2140 μm for the bar size of ϕ6 mm, ϕ5 mm, and ϕ4 mm, respectively. For the short direction, the range of the axial strain in ties at ultimate load was 625-1025 μm, 867-1080 μm and 1188-2112 μm for the tie bar size of ϕ6 mm, ϕ5 mm, and ϕ4 mm, respectively. Similarly, for the long direction, the range of the axial strain in ties at ultimate load was 311-608 μm, 400-450 μm and 251-510 μm for the tie bar size of ϕ6 mm, ϕ5 mm, and ϕ4 mm, respectively. Hence, for all specimens, the tie strain at ultimate load was less than the yielding strain, which indicated the local zone failure rather than bursting tensile failure in the general zone. Moreover, these experi- mental values, together with the FEA results, showed that tie strains at ultimate load for the short direction were greater than the long direction, which implies that the short direction of the studied specimens was more critical than the long direction for the tensile bursting stresses.
The experimental results for the short direction showed that the minimum tie strain at ultimate load was 625 micro-strain for the specimen SP1, which had the maximum reinforcement of ϕ6 mm for both the spirals and ties. For the same direction, the maximum tie strain at ultimate load was 2112 micro-strain for the specimen SP15, which had the minimum reinforcement of ϕ4 mm for ties, and had no spiral reinforcement.
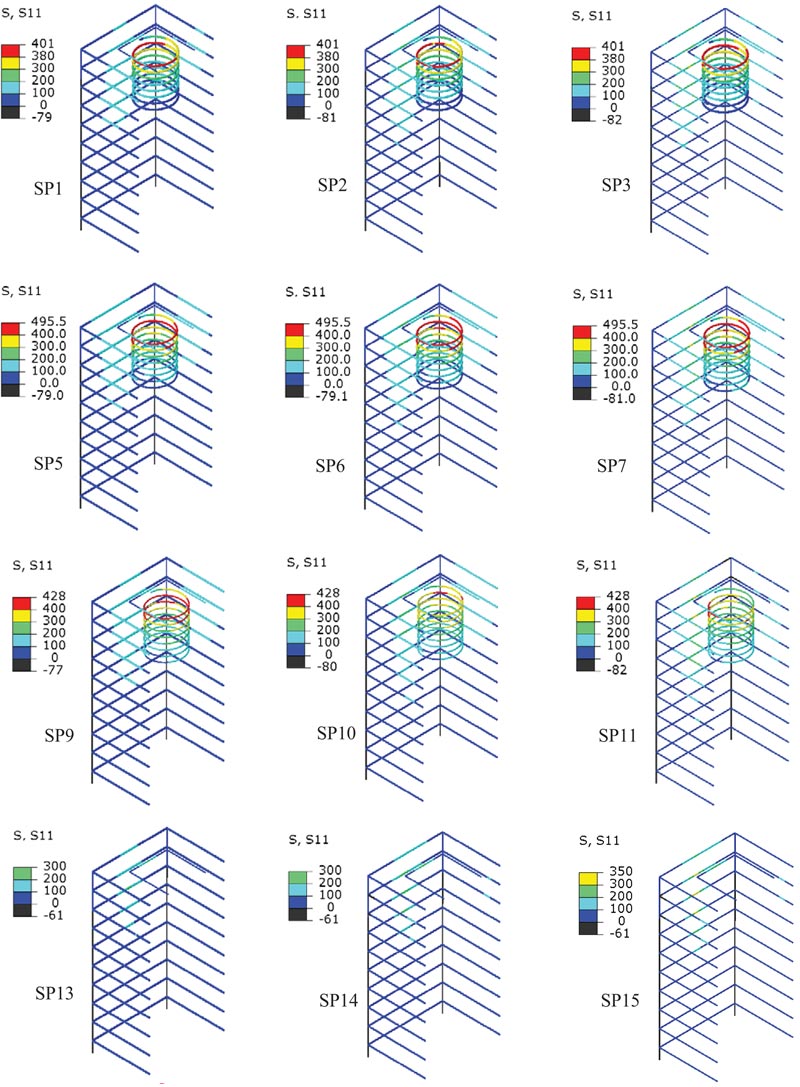
In order to have a clearer picture of the axial stresses distribution in ties and spirals at ultimate load, Fig. (17) shows the FEA results of this type of stress for all specimens that have tie reinforcement. S11 in Fig. (17) represents the axial stresses in ties and spirals. For all the specimens, tie axial stresses at ultimate load were less than the yielding stress of the reinfo- rcement of 401 MPa, 495.5 MPa and 428 MPa for the bar size of ϕ6 mm, ϕ5 mm and ϕ4 mm, respectively, a matter which well agrees with the experimental results. Meanwhile, the axial stresses in spiral reinforcements reached the yielding stress of 401 MPa, 495.5 MPa and 428 MPa for the bar size of ϕ6 mm, ϕ5 mm and ϕ4 mm, respectively. As designed, these two facts indicated the local zone failure rather than the general zone bursting stresses failure for all the specimens with tie reinforcement. These results well agree with the failure mode and cracking pattern of the specimens detailed in section 4.6.
4.4.2. Concrete
Figs. ( 18 and 19 ) show the load-strain relationship for concrete for the short and long direction, respectively. The experimental and FEA results are close.
According to the results, the strain at ultimate load in the short direction was more than the cracking strain of concrete (141μm), indicating a crack pass at the mid of this direction. Whereas, the maximum strain in the long direction was 95μm, which was less than the cracking strain of concrete, indicating no crack passed the specified location in the mid of this direction. These results agree well with the experimental cracking pattern of the specimens. For the short direction, the accuracy which must be expected regarding the comparison between the experimental and FEA results is that practically the cracks may not pass through the line of strain gauges for some specimens, causing some difference in their experimental and FEA curves.
4.5. Bursting Stresses
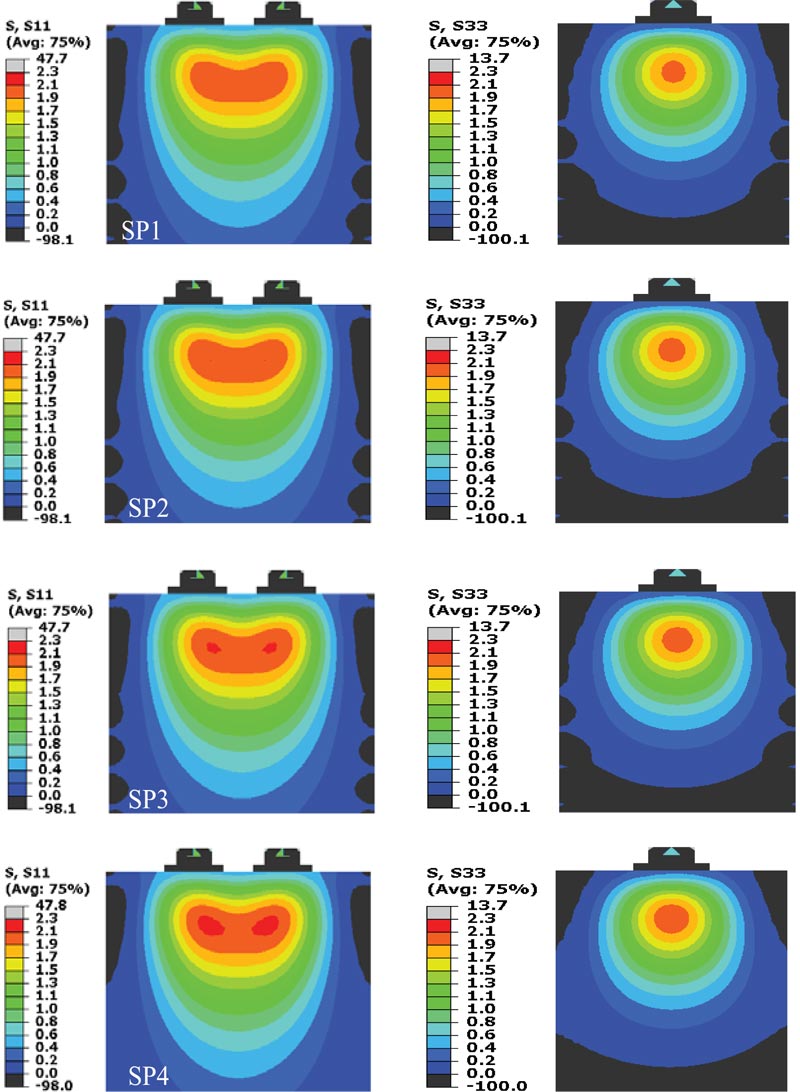
Fig. ( 20 ) shows the FEA bursting stress contours, in the elastic stage, at the surface of the models for both the long and short direction for the group G1. S11 and S33 represent the stresses Sxx and Szz, respectively. Bursting stresses for the long direction extend in the area between the two anchorage devices. Moreover, for both the long and short directions, the concentration of these stresses is in the general zone and within a depth close to the direction length. Previous studies [7, 8, 19] provided a similar distribution and location for these stresses. Bursting stresses distribution was almost the same for all specimens, which indicated that the studied variables had no effect on this kind of stresses at the elastic range. Only group G1 was included in Fig. (19) as the other groups had similar stress distribution.
4.6. Cracking Pattern
Fig. ( 21 ) shows the cracking pattern of the experimental specimens included in this study. ABAQUS FEA program does not have a tool to display the cracks extent of the model, but other parameters like plastic strain, logarithmic strain or tensile damage can be used as an indication of crack development. In this study, the tensile damage parameter DAMAGET has been used as an indication of crack propagation. For every specimen in Fig. (21), the first image is the tensile damage diagram from ABAQUS FEA, and the other three are the experimental cracking patterns in the long direction, short direction and top surface, respectively. For the FEA, the red color indicates that the tensile damage ratio is more than 80% in the elements. It can be observed that the cracking patterns of the experimental tests and FEA are very similar, and there is a good agreement between the two results regarding the cracks propagation and failure mode. Moreover, the cracking pattern of the first specimen (SP1) for both the experimental and FE results is presented in detail with labels. The same presented details apply to the cracking pattern of the other specimens, except for the specimens that failed in the general zone (SP4, SP8, SP12, SP16) and have a long crack in the short direction.
The experimental and FEA cracking patterns of the specimens can be divided into two main groups, as follows:
• Specimens that failed in the general zone as they had no tie reinforcement to resist the tensile bursting stresses in this zone. These specimens included SP4, SP8, SP12, and SP16. As mentioned in section 1.3, these specimens had large cracks running parallel to the duct and extending from the anchorage device, mainly in the short direction. For this group, the main crack in the short direction extended down to the base and divided the specimen into two parts, as a result of high tensile bursting stresses with no tie reinforcement.
• All other specimens that failed in the local zone. These specimens were designed to resist the tensile bursting stresses and failure in the general zone. The cracks in both the short and long directions were mainly concentrated in the upper and middle parts of these specimens. Compared to the specimens that failed in the general zone, the crack in the short direction of this group was shorter and did not extend to the base. The general zone of the specimens of this group was reinforced with ties that resisted the tensile bursting stresses and limited the extent of cracks.
Moreover, the following main points could be observed in the experimental and FEA cracking patterns of the specimens:
• For most of the specimens, the main crack in the short direction passes through the center of this direction. This matter well agrees with the strain value of concrete at ultimate load, measured in the center of the short direction, which was more than the cracking strain of concrete (section 4.4.2).
• A crack did not pass through the center of the long direction, a matter which well agrees with the experimental results in section 4.4.2, when the measured strains at this location were less than the cracking strain of concrete.
• The cracks start under the anchorage devices, at the loaded face of the specimens, which is subjected to very high stresses and extends down to the sides.
• Compared to the long direction, cracks in the short direction are longer and extend downwards. This issue agrees well with the experimental and FEA results presented in section 4.4.1, as the tie strains in the short direction were more than the tie strains in the long direction.
• For the same tie reinforcement, the extent of cracks increased with the decrease in spiral bar size. Hence, speci- mens of group G4 (SP13, SP14, SP15 and SP16), which are without spiral reinforcement, have more extents of cracks as compared to the other three groups.

CONCLUSION
From the experimental and analytical work performed in this study, fundamental behavioral understanding of the anchorage zone with two anchorage devices and the interaction between the local and general zone was obtained, and the following main conclusions were drawn:
1. For the specimens that failed in the local zone but had strong spiral reinforcement (ϕ6 mm), increasing the ties bar size of the general zone from ϕ4 mm to ϕ6 mm had no influence on the specimen strength.
2. For the specimens that failed in the local zone and had weak spiral reinforcement (ϕ4 mm), increasing the tie bar size of the general zone increased the local zone strength and ultimate load of the specimens. The ultimate load of the specimens increased by 12.7% by increasing the tie bar size from ϕ4 mm to ϕ6 mm. Nevertheless, the same increase in tie bar size of the specimens without spiral reinforcement increased the ultimate load by only 6.6%.
3. Tie reinforcement of the general zone provided additional confinement for the local zone. This additional confinement was more for the specimens with originally less confined spiral reinforcement strength (ϕ4 mm). Nevertheless, tie reinforcement could not significantly improve the ultimate load of the anchorage zone in case if the spiral confinement of the local zone was not available (specimens without spiral reinforcement).
4. For the specimens that failed in the general zone (specimens without tie reinforcement), there was a slight or no effect of the local zone reinforcement on the general zone strength and ultimate load of the specimens. The maximum increase in ultimate load, in this case, was only 3.3% by using a spiral bar size of ϕ6 mm compared to the case without spiral reinforcement.
5. Confinement of the local zone modifies the ductility of the specimens and prevents the brittle bearing and compression failure of this zone.
6. For the specimens that failed in the local zone, the cracks were concentrated at the upper and middle parts, while the specimens that failed in the general zone had large cracks running parallel to the duct starting from the anchorage device and extending down to the base of the specimen.
7. Ultimate loads of the experimental tests were very close to the ABAQUS FEA results. The percentage of experimental to FEA ultimate load was within the range of 98.3-109.2% for the specimens that had spiral and tie reinforcement.
8. Other experimental results, including relationships of load versus axial strain of the ties, concrete strain at the critical locations, crack propagation and failure modes, were in good agreement with the finite element analysis.
CONSENT FOR PUBLICATION
Not applicable.
AVAILABILITY OF DATA AND MATERIALS
The authors confirm that the data supporting the findings of this study are available within the article.
FUNDING
None.
CONFLICT OF INTEREST
The authors declare no conflict of interest, financial or otherwise.
ACKNOWLEDGEMENTS
Declared none.


