All published articles of this journal are available on ScienceDirect.

Comparison between Electrical Resistivity Tomography and Geotechnical Field Data for Characterizing Soil Profiles
Authors Info & Affiliations
Abstract
Background:
Electrical resistivity tests at a project site could be a valuable economical alternative to typical geotechnical soil exploration and a reliable source of data. In the present study, the soil at a constructed underground water tank site in Qassim Region – Saudi Arabia is investigated using the electrical resistivity testing method.
Objective:
The study aims to compare the results of traditional soil boreholes that were conducted at various stages of the project lifetime with the interpretation of soil resistivity test results.
Methods:
Eight soil boreholes were drilled at the water tank site to capture the nature of soil layers. The electrical resistivity of soil layers at the site is measured and used to investigate the ground subsurface of the project site. The geophysical software, ZondRes2d is utilized to analyze and interpret the collected data.
Results:
Both geotechnical soil boreholes and geophysical electrical resistivity tests revealed similar soil profiles with three main layers comprising of backfill material, clay with expansive nature, and weathered limestone and marl. The results of the electrical resistivity tests are also affirmative of available resistance values of different soils in the literature.
Conclusion:
The study shows that electrical resistivity testing is reliable in capturing the soil nature which presents an attractive tool for preliminary investigation of the soil-related problems of distressed structures.
1. INTRODUCTION
Soil resistivity measurements and calculations represent an important tool and a valuable part of soil subsurface exploration programs in civil engineering projects. Electrical resistivity is defined as the resistance to the flow of electrical current within a material. Typically, the direct-current (DC) resistivity method is utilized to determine the electric resistivity nature of the subsurface soil as explained by several researchers [1-4]. Electricity flow in the soil layer is largely electrolytic, established through the transport of ions dissolved in moisture. The electrical resistivity of a soil or rock mainly depends on several factors, such as the volume of interconnected pore water, porosity, and the amount of total dissolved solids. Although the fundamentals of soil electrical resistivity are well established, electrical resistivity tomography tests (ERT) are not widely implemented in civil engineering projects. Geotechnical field tests are time-consuming, destructive, and relatively expensive, yet these are commonly used. Electrical resistivity tomography (ERT) tests are non-destructive, easier, and relatively inexpensive as compared to conventional geotechnical field tests. Electric resistivity testing is typically used as a preliminary investigation step before launching the more comprehensive geotechnical investigation at the construction site. The reason for that is the extreme complexity and time-dependent variability of the geological subsurface conditions [5]. Therefore, the ERT, similar to other geophysical testing technology, such as seismic refraction, induced polarization, and multichannel analysis of surface waves, alone, may not imply an accurate full characterization of the soil profile at the site nor engineers can use its results to provide the necessary recommendations for foundation design and construction. ERT can be, however, used in a combination with typical geotechnical testing to enhance the results of typical site exploration techniques [6-9]. The implementation of non-destructive techniques, such as ERT, along with the conventional destructive techniques for drilling and extracting soil samples provides detailed geological information, including lithological layering and the existence of structural defects, such as faults and fractures [10-13].
Researchers have been trying to improve the ERT tool and therefore enhance its results to be more conclusive in describing the soil profile at the site. This has been done through two strategies; improving the electric resistivity technology itself and correlating the electrical resistivity results with various geotechnical properties of soil. The accurate interpretation of ERT results highly depends on the nature of the soil at the site. For instance, the salinity of the interstitial fluid of soil and its distribution represents a crucial problem in obtaining a reliable correlation between ERT results and geotechnical field data [14]. Moreover, electrical resistivity in clay is often anticipated to be lower than in sand soil layers due to the variation in ion exchange capacity of the clay soil [15]. Further attempts to improve the correlation between the results of soil exploration through ERT and geotechnical field data would significantly enhance pre and post-geotechnical investigations of project sites. Several studies have been carried out to examine the correlation between ERT results and geotechnical data for soil in the field. However, limited studies are available for comparing these results to the physical properties of soil but rather to the results of field testing, such as standard penetration test (SPT) [16-18]. The findings of these studies varied significantly from low to high correlations between ERT and SPT results. Braga et al. [19] presented one of the first attempts to relate the number of SPT blows and soil density with a weak exponential correlation of 0.3 determination coefficient. Sudha et al. [20] concluded that there is no universal relationship between soil density and the number of SPT blows, and a specific relationship between the two values must be determined for different locations. Reasonable correlations between soil electrical resistivity and geotechnical parameters of clay were obtained by Long et al. [21]. Furthermore, in an assessment of a bridge foundation site, Devi et al. [22] published soil density values that are linearly correlated with the number of blows in SPT. The linear regression technique was used to present the correlation, which showed that the fitted linear slopes were dependent on the lithology and the clay content [22].
In the present study, the results of electrical resistivity surveys were used to characterize the nature and properties of soil at the site of an existing underground water tank in the Al-Qassim Region, Saudi Arabia. The study compared the results of traditional soil boreholes that were conducted at various stages of the project lifetime to capture the nature of soil layers with the interpretation of soil resistivity test results.
2. METHODOLOGY
2.1. Study Location
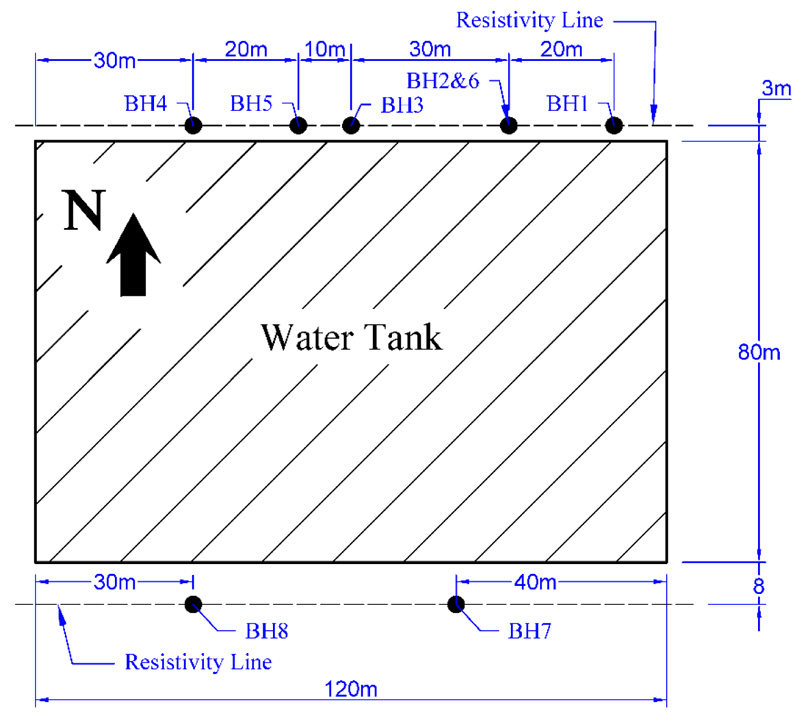
The project site under consideration is located in the Al-Qassim region of the Kingdom of Saudi Arabia. It covers an area of 120×80 m on which a large underground water tank is constructed, with the 120 m sides aligned in the east-west directions. The overall height of the tank is 6 m of which 4 m are below ground level. The tank consists of two main chambers, one on the north side and the other on the south side. Structural distress was noticed in the tank, which called for investigating the soil underneath.
2.2. Geotechnical Work
A total of eight boreholes (BH1-BH8) were drilled on the north and south sides of the tank, as shown in Fig. (1), to determine the natural and engineering properties of the soil profile at the water tank site. Four of these boreholes are 10 m deep and the other four are 15 m deep. Boreholes BH2, BH4, BH5, and BH6 were drilled in February, 2016, while boreholes BH3 and BH7 were drilled in March, 2021, and boreholes BH1 and BH8 were drilled in April, 2021.
The necessary geotechnical field and lab tests of soil samples collected from these boreholes were conducted. SPT was carried out in accordance with BS 1377-9:1990 [23] and representative disturbed and undisturbed samples were collected at various depths. These samples were used to complete the geotechnical investigation of the soil profile at the site.
2.3. Electric Resistivity Surveys
Electrical resistivity surveys were used to investigate the ground subsurface of the project site. The locations of survey lines were chosen at the north and south faces of the tank so that each line would coincide with the existing line of boreholes conducted at the project site, as shown in Fig. (1). The Dipole-Dipole array was used for the electric resistivity survey since it has relatively reliable horizontal coverage, considerably higher signal strength, and it is not very sensitive to electrical noise. The electrical imaging system was performed with a multi-electrode resistivity meter system. Such survey used a number of 48 electrodes placed in a straight line of 141 m in length at a constant spacing of 3 m. The 2-D electrical resistivity tomography (ERT) was performed with a multi-electrodes resistivity using Molisana Apparecchiature Elettroniche (MAE), advanced geophysics instruments, and MAE-X612 meter system. ZondRes2d (2021), a geophysical software, was utilized to analyze the collected data and interpret its results [24].
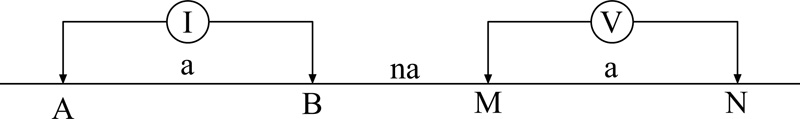
In the Dipole-Dipole resistivity survey, the basic idea was to use four electrodes arranged, as shown in Fig. (2). Using the value of the voltage and the current measured between electrodes M, N, A, and B respectively, the resistivity at point A () is calculated according to Equation 1. This configuration was repeated throughout the 48 electrodes and observed apparent resistivity data were recorded.
 |
(1) |
where V is voltage, I is current, n is an integer multiplier, and a is the distance between the dipole electrodes.
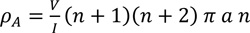
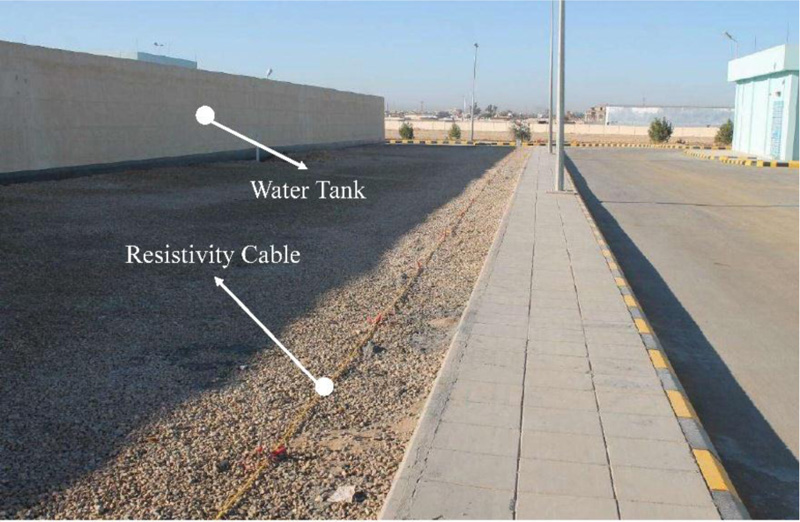
In this study, the MAE electrometer instrument was used to conduct the electrical resistivity survey, as shown in Fig. (3). MAE electrometer instrument was located at the midpoint between electrodes number 14 and 25. The MAE built-in software was run to start recording the resistivity data. Fig. (4) shows the north line of the electric resistivity survey at the site adjacent to the water tank. The recorded data were then inverted to resistivity images of the soil profile by ZondRes2d (2021) [24]. ZondRes2d provides an inverse model that estimates the actual subsurface structure based on the measured electrical resistivity values at the site.
3. RESULTS AND DISCUSSION
3.1. Geotechnical results
The field values of the standard penetration test (SPT) for soil samples collected from the boreholes at the site are given in Table 1 with N referring to the number of blows. The results from soil boreholes are as follows:
| Depth (m) | SPT “N” Field Values | |||||||
|---|---|---|---|---|---|---|---|---|
| BH1 | BH2 | BH3 | BH4 | BH5 | BH6 | BH7 | BH8 | |
| 0.00 | - | 25 | - | 23 | 24 | 26 | - | - |
| 1.50 | 8 | 8 | 9 | 5 | 5 | 6 | - | - |
| 3.00 | 32 | 2 | 31 | 3 | 2 | 4 | 100 | - |
| 4.50 | Refusal | 24 | 100 | 81 | 100 | 24 | 100 | Refusal |
| 6.00 | Refusal | 100 | 100 | 100 | 100 | 100 | - | - |
| 7.50 | - | 100 | - | 35 | 39 | 100 | - | - |
- At a depth of 1.5 m, the soil is medium in consistency and relative density at the location of boreholes No. 1 to No. 6.
- At a depth of 3.0 m, the soil is soft in consistency and loose in relative density at the location of boreholes No. 2, No. 4 to No. 6, while the soil is very stiff and dense at the location of the rest boreholes (i.e. boreholes numbers 1, 3, 7, and 8).
- At a depth of 4.5 m, the soil is hard and very dense in all boreholes, except for boreholes No. 2 and No. 6, the soil is very stiff and with medium density.
- From a depth of more than 4.5 m to the end of the depth of the boreholes, the soil is hard and very dense.
The laboratory test results of samples extracted from the site are given in Table 2, while the type of soil layer and their depths for the eight boreholes are listed in Table 3. The results in these two tables show that there is homogeneity and continuity in the sub-surface soil at the site, and in general, the soil at the studied tank site consists of three main layers:
- Backfill material: A layer of backfill consisting of poorly graded sand and silty clay mixed with gravel and pebbles, brown in color, with low to medium density. This layer appeared in almost all boreholes and extended up to a depth of 4.0 to 4.5 m from ground level.
- Gray stiff to hard clay with expansive nature: It appeared in 5 boreholes with a thickness of 2.0 m to 4.50 m. In this layer, clay percentage is 60% and plasticity index is 37% with a high potential for swelling.
- Light color interaction between highly weathered limestone and marl: It appeared in all boreholes, extending to the end of the 15 m depth boreholes and existing at the end of 10 m depth boreholes as well. The marl deposits are clay deposits that have a high percentage of salt and have the potential for high swelling too [25].
Within these three main layers comprising the soil profile at the site, a couple of pockets of lean clay mixed with sand appeared in BH3 and BH7, which did not appear throughout the soil profile.
3.2. Electrical Resistivity Testing Results
The electrical resistivity surveys were conducted for the north side of the tank in two stages almost two years apart, February, 2018, and October, 2020. For the south side of the tank, the electrical resistivity survey was conducted in February, 2021. The measurements of apparent resistivity were collected using MAE and advanced geophysics instruments, and the measured electric resistivity data were recorded by the MAE built-in software. These recorded data were then inverted to resistivity images through the ZondRes2d (2021) software, providing an inverse model that approximates the soil subsurface profile. The non-uniqueness and smoothing condition of the inverted results may impose some limitations. The inversion results, however, can give an excellent resistivity image of the soil. All three electrical resistivity surveys revealed that there are three distinct soil layers, as shown in Figs. (5-7). The limits of the underground water tank location are also highlighted in red dashed lines in these figures. For interpretation of the presented electrical resistivity images, Table 4 shows the ranges of electrical resistivity values for some soil types, according to Loke (2000) [26]. The interpreted electrical resistivity values were compared with the extracted soil samples from boreholes to corroborate and validate the results.
| Borehole Number | Sample Number | Depth (m) | Rock Description | Dry Density (g/cm3) | Unconfined Compressive Strength (kg/cm2) |
Uniaxial Strength of Rock (qu) MPa (kgf/cm2) |
|---|---|---|---|---|---|---|
| BH1 | 1 | 6.0 | Claystone | 2.214 | - | 7.39 (75.33) |
| 2 | 10.0 | Limestone | 2.526 | - | 27.17 (276.96) | |
| BH2 | 8 | 10.00 | Limestone | 2.43 | 373.5 | - |
| BH3 | 1 | 0.0 | Poorly graded sand with silt and gravel (Fill Materials) | 1.519 | - | - |
| 2 | 1.5 | 1.477 | - | - | ||
| 3 | 3.0 | 1.454 | - | - | ||
| BH4 | 7 | 9.00 | Limestone | 2.49 | 425.1 | - |
| BH5 | 6 | 7.50 | Limestone | 2.57 | 398.4 | - |
| 7 | 9.00 | Limestone | 2.69 | 324.8 | - | |
| BH6 | 8 | 10.00 | Limestone | 2.61 | 395.0 | - |
| BH7 | 1 | 0.0 | Fracture Rock With Silt | - | - | - |
| 2 | 1.5 | |||||
| 3 | 3.0 | |||||
| BH8 | 1 | 5.0 | Limestone | 2.294 | - | 5.0 (50.97) |
| 2 | 6.5 | Limestone | 2.681 | - | 6.65 (67.79) |
| - | The North Side of the Existing Water Tank | The South Side of the Existing Water Tank | ||||||
|---|---|---|---|---|---|---|---|---|
| Depth (m) | BH1 | BH2 | BH3 | BH4 | BH5 | BH6 | BH7 | BH8 |
| 1 | Fill Materials | Fill Materials | Poorly graded sand with silt and gravel (Fill Materials) | Fill Materials | Fill Materials | Fill Materials | Marl (Fracture Rock) | Clay stone |
| 2 | ||||||||
| 3 | ||||||||
| 4 | ||||||||
| 4.5 | Lean Clay with Sand | Lean Clay with Sand | ||||||
| 5 | Stiff to Hard Clay | Stiff to Hard Clay | Stiff to Hard Clay | Stiff to Hard Clay | Stiff to Hard Clay | |||
| 6 | Weathered Limestone | |||||||
| 7 | Marl (Fracture Rock) | |||||||
| 8 | Marl (Fracture Rock) | Weathered Limestone | Weathered Limestone | |||||
| 9 | Weathered Limestone | Weathered Limestone | ||||||
| 10 | Weathered Limestone | |||||||
| 11 | ||||||||
| 12 | ||||||||
| 13 | ||||||||
| 14 | ||||||||
| 15 | ||||||||
| Soil Type | Resistivity, Ωm |
|---|---|
| Clay | 0.1-50 |
| Marls | 2.0 - 50 |
| Sandstone | 8-100 |
| Limestone | 20-400 |
| Granite | 5000-10000 |
| Quartz | 100-2000000 |
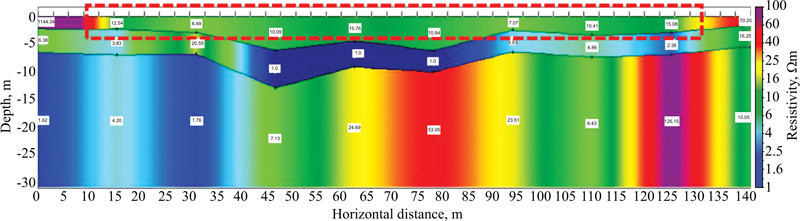
The electrical resistivity values for the cross-section of the soil profile of the north side performed in 2018 are shown in Fig. (5). In the middle layer, the measured resistivity values are the lowest compared to the top and bottom layers. The center portion of the soil profile of the middle layer showed resistivity values of less than 3 Ωm for a distance of around 50 m, which falls into the range of clay soil type. These measurements of electrical resistivity of low value indicate clay soil type, which matches well with the extracted samples from soil boreholes. The bottom layer shows resistivity values in the range between 1.76 Ωm to 59.05 Ωm, which falls within the range of the clay, marls, and limestone soil types. Limestone and marl soils were also characterized by boreholes tests at these layer depths, as shown in Table 3.
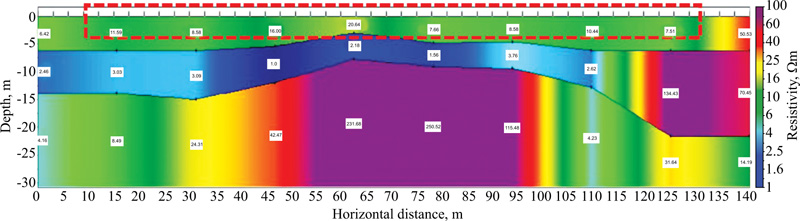
Electrical resistivity results that were performed in 2020 for the same cross-section at the north face of the tank are shown in Fig. (6). For the 2020 survey of the north side, the resistivity values in the top layer are close to those measured in 2018 with no major changes. For the middle layer, the low resistivity values in the middle portion of the layer extended toward the east side of the tank (i.e. at a horizontal distance from 0 to around 85m). The resistivity values in this region, which are less than 3 Ωm, fall in the range of the clay soil resistivity values. The reason for this change in soil resistivity values from the prior scan in 2018 might be attributed to a water leakage that occurred in this area of the tank. For the bottom layer, the resistivity values showed a considerable change with time in terms of an increase in resistivity values except for the range between 100 to 120 m. Nevertheless, these values fall within the range of the resistivity values of clay, marl, and limestone soils, and these types of soil were also confirmed by the soil samples from boreholes tests.
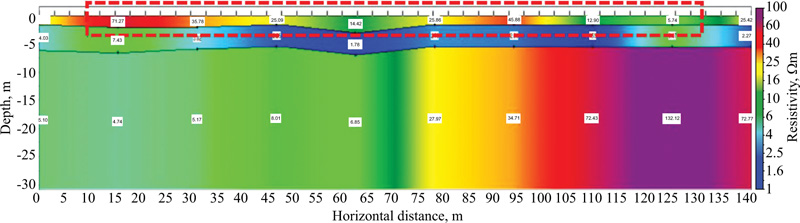
For the 2021 survey of the south side of the tank, electrical resistivity values for the cross-section of the soil profile are shown in Fig. (7). The resistivity values in the top layer are non-consistent to a certain extent throughout the overall width of 141 m as compared to the north face of the tank. The middle layer showed similar resistivity values to the surveys of the north side, ranging from 1.53 Ωm to 3.82 Ωm, with the lowest values at a distance between 50 to 75 m. For the bottom layer, resistivity values range from 5.17 Ωm to 72.43 Ωm, which fall within the range of the electrical resistivity values of clay, marl, and limestone soils.
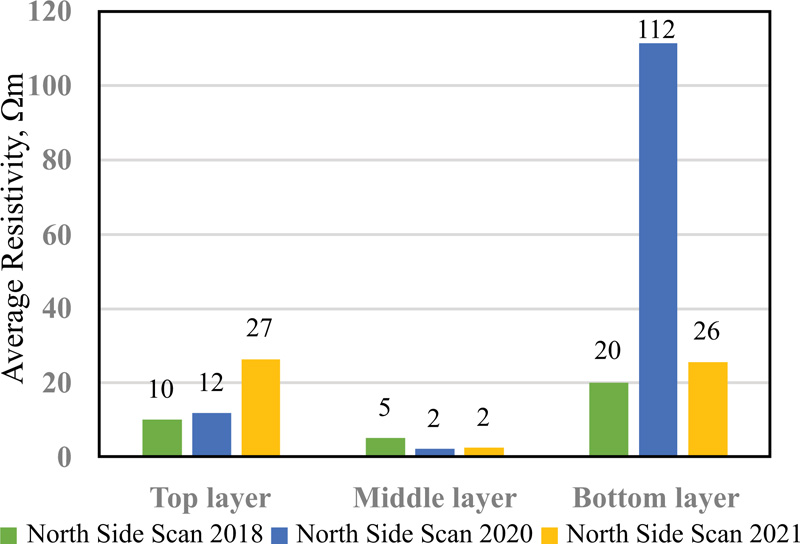
A summary of the ranges of all measured resistivity values beneath the water tank for all three soil surveys is given in Table 5, and average resistivity values for the three soil layers are compared in Fig. (8). The resistivity values summarized in Table 5 show reasonable agreement with those available in the literature [26], as shown in Table 4. Clay and marl deposits typically have resistivity values of 0.1 Ωm – 50 Ωm, and 2 Ωm – 50 Ωm, respectively. This is apparent from soil resistivity Figs. (5-7), showing the middle layer to yield resistivity values in this range. It is also affirmative of the results of the eight drilled boreholes at the site. Moreover, the middle layer shows resistivity values starting from 1 Ωm to 20.55 Ωm, which fall within the range of the electrical resistivity of the clay soil as characterized by the boreholes investigations. Limestone resistivity values range from 20 Ωm up to almost 400 Ωm, as shown in Table 4. The geotechnical investigation through the boreholes of the current location shows that the limestone is highly weathered, thus having low resistivity values (4.23 to 250.52 Ωm). Similarly, marl is expected to give resistivity values in the range between 2 to 50 Ωm, which compares well with the extracted samples from soil boreholes. Overall, the ranges of soil resistivity values, given in Table 4, are in acceptable agreement with the results of the eight soil boreholes shown in Table 3. Hence, these findings reflect the reliability of using electrical resistivity tests in conducting a preliminary investigation of the soil profile at a project site.
| Soil Layer |
North Side Survey (February2018) |
North Side Survey (October 2020) |
South Side Survey (February 2021) |
|---|---|---|---|
| Top Layer | 6.43 – 15.76 | 7.66-20.64 | 12.3-45.88 |
| Middle Layer | 1.0 – 20.55 | 1.0-3.76 | 1.53-3.82 |
| Bottom Layer | 1.76 – 59.05 | 4.23-250.52 | 5.17-72.43 |
CONCLUSION
In this study, a geotechnical investigation, with soil boreholes and lab tests, was conducted at various stages of a constructed underground water tank project. The results of this investigation were used alongside the results of electrical resistivity tomography to characterize the soil profile at the project site. Two lines of electrical resistivity tomography were selected to perform three surveys with consideration of the location of soil boreholes for comparison. Based on the results of the geotechnical investigation and the two lines of electrical resistivity surveys at the water tank site, the following conclusions can be drawn:
- Soil, according to boreholes results, is consist of three main layers, which are backfill material, gray stiff to hard clay with expansive nature, and light color interaction between highly weathered limestone and marl.
- Electrical resistivity findings showed that there are three distinct layers of soils with resistivity in the top layer ranging from 6.43 to 45.88 Ωm, the middle layer with the majority of resistivity values ranging from 1.0 to 4.86 Ωm, and the bottom layer with resistivity values ranging from 1.76 to 250.52 Ωm.
- The interpretation of the values from the soil resistivity tests at the site is in good agreement with the soil profile characterization from the geotechnical investigation.
- The study showed that electrical resistivity tomography explored well the interaction between expansive soil layers with limestone layers at two different stages of the water tank lifetime.
- Electrical resistivity tomography tests provide a valuable and economically feasible tool for two- dimensional preliminary characterization of the soil profile at project sites and assist in the proper locations of soil boreholes for further investigations.
LIST OF ABBREVIATIONS
| ERT | = Electrical Resistivity Tomography |
| DC | = Direct-current |
| SPT | = Standard Penetration Test |
CONSENT FOR PUBLICATION
Not applicable.
AVAILABILITY OF DATA AND MATERIALS
The data that support the findings of this study are available upon request from the corresponding author [S.M.A].
FUNDING
This study is funded by the Qassim University, represented by the Deanship of Scientific Research, under the number (9878-qec-2019-1-1-Q) during the academic year 1441 AH / 2019 AD.
CONFLICT OF INTEREST
The authors declare no conflict of interest. The funders had no role in the design of the study, collection, analyses, or interpretation of data, writing of the manuscript, or the decision to publish the results.
ACKNOWLEDGEMENTS
The authors would like to gratefully acknowledge the Qassim University, represented by the Deanship of Scientific Research, for financially supporting this research under the number (9878-qec-2019-1-1-Q) during the academic year 1441 AH / 2019 AD. The authors would like to thank the general directorate of water services in the Qassim region for facilitating the experimental work conducted on the project site.

