All published articles of this journal are available on ScienceDirect.

Do People Desire to Cycle More During the COVID-19 Pandemic? Investigating the Role of Behavioural Characteristics through a Structural Model
Abstract
Background:
Most cycling behaviour studies have defined it using objective variables and focused on normal conditions.
Objective:
This study applies latent class analysis to a sample of 375 survey respondents in Tehran, the Capital city of Iran, exploring the variables influencing cycling behaviour during pandemic covid-19.
Methods:
We made a statistical comparison among the data obtained from the questionnaires and the statistical data of the 2016 census. A structural equation modeling (SEM) was developed.
Results:
Fourteen indicators define three latent variables. Cycling behaviour is defined by these three latent factors and three indicators. This paper goes through each of the indicators and their impact on latent variables. The findings show that latent factors have a direct impact on cycling behaviour.
Conclusion:
Structural equation modeling (SEM) is a great tool for defining cyclist behaviour analysis that shows the positive and negative influence of variables on cycling rate during a covid-19 pandemic. There are some limitations in the area of this study in developing countries discussed in the paper.
1. INTRODUCTION
A cluster of cases of pneumonia was first identified in Wuhan, Hubei Province, China, that was named Covid-19 later in January 2020. On March 11th, World Health Organization (WHO) assessed that COVID-19 could be characterized as a pandemic. By the end of May 2021, more than 150,000,000 cases and 3.5 million deaths in terms of COVID-19 had been reported. Most countries set restrictions on people's movements (by private car or any other mode of transport) to prevent the spreading of disease in crowded areas, using the forms of lockdown, travel time limitations, etc., to slow down the pandemic peak and flatten the slope of the infection curve. A change in travel behaviour is anticipated due to restrictions proposed during the pandemic. In some countries like Iran, private car use has increased in terms of the pandemic to compensate for the poor public transport level of service. Recent studies [1, 2] emphasize motorized travel behaviour changes and bike-sharing during the pandemic [3]. But, there are a few studies about cycling behaviour changes during pandemics.
Social distancing has increased car use in Tehran, Iran, escalating congestion and air pollution problems. From November 21st, 2020, until January 20th,2021, the number of unhealthy days has increased to 44, compared to 18 days in the last year before the emergence of COVID-19 in Iran. Private cars constitute a majority of modal shares in Tehran; nevertheless, the public transport system is overcrowded, especially in peak hours which forces violations of social distancing. Tehran, the Capital city of Iran, has a bicycle infrastructure with an active bike-sharing system that is supposed to increase cycling in daily trips each year. Findings [4] reveal that demand for cycling may increase due to the fear of infection and interaction with others. Increased use of bicycles for daily trips would decrease private/public transport use, reduce air pollution, and prevent coronavirus propagation by observation of social distancing. This, along with several other advantages, has been the focus of several studies on active transportation, including cycling. Individual/household/ trip characteristics, built environment, seasonal and weather factors, and employment conditions have all been utilised to explain the reasoning behind active transportation [5, 6]. Some researchers [7] have divided variables that influence using active transport into objective and subjective variables. In the last decade, some studies have tried latent variables to increase precision and accuracy but have arrived at inconsistent results in terms of varied data sources and methodologies. Non-motorized transport has recently become more attractive, though influential latent variables on cycling during the Covid-19 pandemic still need to be examined.
This study aims to assess cycling behaviour during the Covid-19 pandemic. Section 2 presents a literature review on cycling behaviour and factors affecting cycling. Section 3 describes data derived from the surveys and the transport master plan of Tehran and the methodology adopted in this paper. Section 4 presents the structural equation model calibrated during this study, and section 5, concludes with a summary of findings and advice for policymakers and transportation professionals.
2. LITERATURE REVIEW
Only two studies about cycling behaviour during pandemics [8, 9] believe pandemics could reduce the cycling rate. This study separates shared bikes from private bikes. Their findings reveal a high perceived risk of infection to using shared bikes instead of private bikes. In general, using bikes faced an unprecedented ridership drop.
Other studies emphasize individual characteristics, environmental characteristics, trip characteristics, cycling facilities, and safety [10]. On the other hand, there are no studies about changes in cycling behaviour in terms of health measures and restrictions like lockdowns. Although, we know that Bicycling offers many societal advantages. From a health perspective, it increases physical activity and prevents disease [11]. The most important factors influencing cycling behaviour will be reviewed in the following. Some studies state that individuals from 18 to 24 years old have no desire for cycling [12], while many others state the opposite [12-16]. It was indicated that the likelihood of bicycling increases among adolescents (12-18 years old) while having more snack occasions per week [17]. Gender has an impact on bicycling rates. Males are more likely than females to ride bicycles [14, 18-25], while other research disagrees [12, 17]. According to several surveys, most bikers who commute to work are men [26, 27]. Obesity is one of the reasons that make cycling difficult. Martin discusses obesity and how it affects the possibility of bicycling [28]. Some studies [29-33] state that travel time negatively impacts cycling, and because of higher travel time by cycling -compared to private cars travel time in a specific direction- cycling likelihood may drop. On the other hand, a decrease in travel time by the expansion of facilities may increase bicycle use [34]. The increased travel distance reduces the likelihood of bicycling use [5, 20, 25, 26, 32, 33, 35, 36]. Another research [37] found that short distances increase bicycle use and reduce total vehicle kilometers in Belgium. Other studies propose that recreational and social trip purposes greatly influence the likelihood of bicycling [20, 38], but others may not confirm this [12].
Rietveld and Daniel found that using the bicycle is low in low-population density areas because, in such areas, there might be fewer opportunities to make short trips [39]. Other studies expressed that an increase in population density increases the likelihood of cycling [36, 40-42], especially cycling for work purposes [26].
Home location is a significant built environment factor. Individuals who live in rural regions are less likely to use bicycles for their trips [27]. Moreover, those who live in the suburbs use bicycles more often than those who live in urban areas [43]. Moreover, traffic flow-related variables (e.g., noise, emissions, etc.) can play an important negative role in the likelihood of bicycling [37, 44], though this needs further investigation. Rietveld and Daniel suggest that physical effort plays a big role in bicycle use (e.g., slopes, frequent stops) [39]. Many other studies emphasize on disadvantages of hilliness/slopes on the likelihood of bicycling [16, 45], but it depends on the physical strength of each person.
Another study found that cyclists using personal bikes were more likely to wear a helmet than cyclists using shared bikes, although the incidence of helmet use was very low for all cyclists [46].
Rain and low temperatures significantly influence the chance of riding a bicycle for work [24]. Rainy weather has a greater detrimental influence on cycling than windy weather, according to another research [34]. Dell’olio et al. describe that only 0.3% of urban journeys are made by bicycle in a medium-sized city like Santander, Spain, because of its abundant rainfall [47]. They mentioned the negative effects of low temperature on cycling.
Employment status influences the likelihood of using a bicycle; that is, students and unemployed individuals would use a bicycle more often for their trips [48-51]. Moreover, bicycle use decreases as the working hours rise [52, 53].
The variables discussed above are objective, but it is proved that some subjective variables also influence active transport; that is where the latent variables and their indicators come into account. Latent variables cannot be measured directly and need indicators to estimate them. Many studies, especially in the last decade, worked on these variables. Taylor and Mahmassani introduced bicycle security and cost importance as new latent variables influencing the utility of bicycle use [19]. Titze et al. talk about the positive influence of convenience [54, 55]. Social norm [43] and cycling ability [14, 56] are other variables in the field of bicycling. Another research [57] shows that being anti-car has a favourable impact. In the subject of active transportation, certain additional factors are found, including the positive experience of riding, the future vision of bicycling, and the good experience of cycling. Structural equation modelling (SEM) in conjunction with confirmatory factor analysis is one of the most effective approaches to model both explanatory and latent variables. It attaches coefficients to path relationships and thus gives a more precise indication of the interrelationships between variables. SEM studies are significant in the social and psychological sciences, although it has not been extensively developed to model the bicycle mode choice problem [7]. Sigurdardottir et al. were the first researchers who studied choosing the bicycle as an alternative travel mode using SEM models. They combine behavioral attitudes, subjective norms associated with the behaviour, and perceived volitional control associated with the behaviour leading them to form behavioral intentions [57]. This study addresses the gap by understanding that latent variables and objective factors influence the cycling behaviour during the pandemic. A model can be developed for normal situations and pandemics.
3. METHODOLOGY
In this section, sampling, data collection, and objective and subjective variables are introduced to examine the model, and the modeling process using the structural equation model (SEM) is presented.
3.1. Case Study and the Survey
This study was conducted in Tehran, the capital city of Iran, the country's most populated city. According to the census data of 2016, there are more than 4.500.000 people over 18 years old in this city, which is the age group selected for this study. By October 2021, more than 600.000 people were infected, and more than 13.000 people had died from covid-19 alone. It shows the importance of studying cycling behaviour to help with the reduction of the number of individuals exposed to Covid-19.
Most individuals in this city choose to drive their automobiles for various reasons, including convenience, privacy, and the bad public transportation system. Another factor for the lack of bicycle use in Tehran is the city's position in the Alborz mountain range's foothills and the steep slope in the city's northern parts. According to the purpose of this study, a survey was prepared that includes individual characteristics, including age, gender, marital status, and level of education, in addition to subjective indicators. For more participation rate, the language of the survey was both English and Persian, and respondents had two options to choose the language of the survey. Those who knew English well could use the English format, and others chose their native language form of Persian. A reward was made for the attraction of respondents to respond to the survey, and one respondent won the reward.
Regarding the limitations caused by the spread of the coronavirus, the questionnaire was established online, and respondents could access the survey form with any device that could connect to the internet. 44 people were contacted directly, and about 3450 individuals were invited by text message. The final participation rate was about 11% —which is a suitable sample size according to Cochran's formula [58] for the population of the city— leading to information from 383 individuals in two weeks of January 2021. 8 survey forms were answered incompletely and omitted in the final review stage. The data compared with the data of the 2016 census, as shown in Table 1, confirms that the collected sample is a good representative of the target population as the sample is nearly close to the census data of the city.
| - | Number | Percent(%) | Percent(%) in 2015 | |
|---|---|---|---|---|
| Gender | Male | 210 | 56 | 49.76 |
| Female | 165 | 44 | 50.24 | |
| Marital status | Single | 158 | 42 | 26 |
| Married | 217 | 58 | 74 | |
| Age | 18-29 | 6 | 2 | 24 |
| 30-39 | 122 | 33 | 27 | |
| 40-49 | 157 | 42 | 18 | |
| 50-60 | 66 | 18 | 16 | |
| >60 | 24 | 5 | 15 | |
| Education | Diploma | 30 | 8 | NA |
| Bachelor | 170 | 45 | NA | |
| Master | 127 | 34 | NA | |
| PhD | 48 | 13 | NA | |
| Car ownership | Have car | 254 | 68 | NA |
| Do not have | 121 | 32 | NA | |
This study's percentage of male respondents (56%) is higher than that of the 2016 census (49.8%) because men have more work trips than women in the city. Older people have a lower ability to work with the internet, and answering the online survey form decreases (That may be the reason for the lower number of older (5% for 60+) respondents in this study compared to the 2016 census data). The low response rate in the 18 to 29 age group (2%) may be due to the lack of public participation at these ages.
All questions were answered based on the current situation in the Covid-19 pandemic. The next section provides an analysis of data collected in the survey process.
3.2. Defining Constructs of the Model
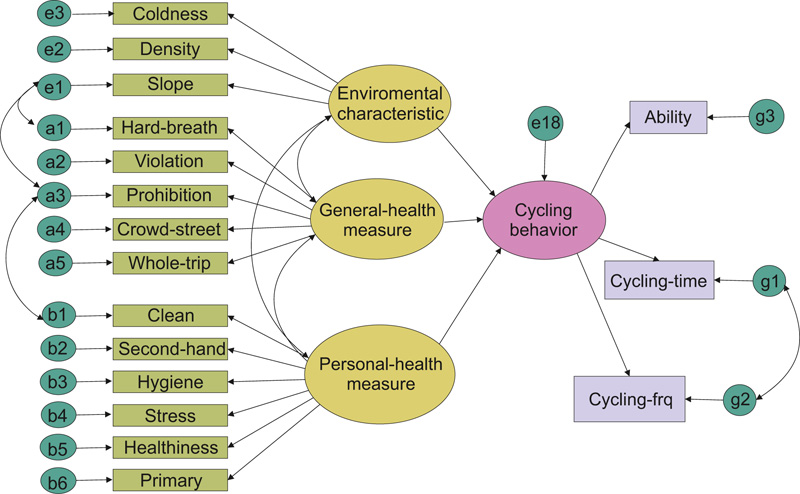
It is necessary to examine several unobserved latent variables to determine which structural equation modeling (SEM) can do it to understand the cycling behaviour during Covid-19. SEM may evaluate two types of variables: observable and latent variables, as well as error terms, which are vital for this research but are restricted by other analytical methods [59]. The observed class represents your data, variables for which you have collected scores and entered them in a data file. Latent variables in SEM generally correspond to hypothetical constructs or factors, which are explanatory variables presumed to reflect a continuum that is not directly observable [60]. The main latent variable in this study is cycling behaviour, which should be explained through three categories of variables, including environmental characteristics, general-health measures, and personal-health measures. Three indicators, the Ability level of cycling, Average cycling time, and Average cycling frequency in a day, are used to define cycling behaviour. A total of 17 indicators were used to define variables that could indicate the effect of Covid-19 on how cycling behaviour changes (e.g., the effect of coldness on the spread of Covid-19). Three variables were used to define environmental characteristics, including coldness, density, and slope, five for general-health measures, and six for personal-health measures. The government implemented general-health measures, e.g., restricting private car use at night (10 pm-4 am). All these variables are evaluated using SEM. “SEM is, without question, one of the most popular methodologies in the quantitative social sciences. Its popularity can be attributed to the sophistication of the underlying statistical theory, the potential for addressing important substantive questions, and the availability and simplicity of software dedicated to structural equation modeling” [61]. All variables listed in Table 2 show the questions and abbreviation of each variable and the definition for each. Some of the questions may seem convoluted and multidimensional, likely causing unnecessary interpretation problems because of their nature of the questions. A guideline is attached to each question to better understand the questions by the questioner. Confirmatory factor analysis (CFA) is the second generation of statistical analysis techniques used to analyze the interrelationships between multiple variables in a model. A collection of simple or numerous regression equations may be used to depict interrelationships among variables. In modelling, the confirmatory factor analysis approach combines quantitative data with causal or correlational assumptions. The investigation is carried out in two stages. A measurement model comes first, followed by a structural model [62]. Respondents were asked to comment on each topic in five options from strongly agree to strongly disagree (Likert scale), and one error term was set to each variable. The whole modeling process is done by AMOS 24.
| Variable Definition (Five-Point Ordinal Scale from Strongly Agree to Strongly Disagree) | Abbreviation |
|---|---|
| What is your level of ability to cycle? | Ability |
| How much is your average cycling time in a day | Cycling-time |
| How much is your average cycling frequency in a day | Cycling-frq |
| Environmental characteristics | |
| I think cold temperature causes more Covid-19 to spread | Coldness |
| I think the higher the population density, the higher the transmission of the Covid-19 | Density |
| I think the slope keeps me from using the bike | Slope |
| General-health measures | |
| I do not use a bicycle due to the difficulty of breathing through a mask while cycling | Hard Breath |
| Cycling violates social distance | Violation |
| Prohibition of private car usage on daily trips will increase using the bicycle | Prohibition |
| Social distancing causes more private car use, and I do not cycle in heavy traffics | Crowd Street |
| Cycling is part of my trip, and I have to travel the rest of the way by public transport, but due to social distancing, I prefer to travel the whole trip by car. | Whole Trip |
| Personal-Health Measures | |
| If the company disinfected shared bikes after each use, I would use them | Clean |
| I do not use devices that someone else has used before | Second hand |
| I think people who use shared bikes are not hygienic | Hygiene |
| Cycling reduces my stress during the Covid-19 | Stress |
| Cycling is a way to increase health and wellness | Healthiness |
| Cycling is the primary exercise | Primary |
| Un-Standardized Beta | S.E. | P | Standardized Beta | |||||
|---|---|---|---|---|---|---|---|---|
| Cycling behaviour | ← | Environmental characteristics | 0.281 | 0.074 | *** | 0.232 | ||
| Cycling behaviour | ← | Health measures | 0.237 | 0.211 | 0.26 | 0.307 | ||
| Cycling behaviour | ← | Personal-health measures | 0.375 | 0.195 | 0.055 | 0.479 | ||
| Slope | ← | Environmental characteristics | 1 | - | - | 0.597 | ||
| density | ← | Environmental characteristics | 1.541 | 0.134 | *** | 0.875 | ||
| coldness | ← | Environmental characteristics | 1.259 | 0.112 | *** | 0.788 | ||
| Whole-trip | ← | General-health measure | 1 | - | - | 0.756 | ||
| Crowd-street | ← | General-health measures | 1.124 | 0.055 | *** | 0.851 | ||
| Prohibition | ← | General-health measures | 1.004 | 0.065 | *** | 0.771 | ||
| Violation | ← | General-health measures | 0.838 | 0.064 | *** | 0.663 | ||
| Hard-breath | ← | General-health measures | 0.782 | 0.064 | *** | 0.624 | ||
| Main-way | ← | Personal-health measures | 1 | - | - | 0.778 | ||
| Healthiness | ← | Personal-health measures | 0.968 | 0.057 | *** | 0.803 | ||
| Stress | ← | Personal-health measures | 1.119 | 0.061 | *** | 0.856 | ||
| Hygiene | ← | Personal-health measures | 0.904 | 0.056 | *** | 0.77 | ||
| Second-hand | ← | Personal-health measures | 1.015 | 0.064 | *** | 0.766 | ||
| Clean | ← | Personal-health measures | 0.856 | 0.061 | *** | 0.686 | ||
| Ability | ← | Cycling behaviour | 1 | - | - | 0.657 | ||
| Cycling-time | ← | Cycling behaviour | 1.27 | 0.095 | *** | 0.854 | ||
| Cycling-frq | ← | Cycling behaviour | 1.325 | 0.105 | *** | 0.795 | ||
4. THE CYCLING BEHAVIOUR MODEL
The questionnaire's validity and convergent validity were tested using factor load indices and SEM, while the variables' reliability was assessed using combined reliability tests and Cronbach's alpha. The minimal quantity of factor load in this investigation was found to be at least 0.4. In addition to Cronbach's alpha, the composite reliability method was used to measure reliability. Since Cronbach's alpha criterion is a traditional criterion for determining the reliability of a structure, the partial least squares method uses a more modern criterion than alpha called the composite reliability, and its value in this study is more than 0.7, which indicates the appropriate internal stability for the measurement model [63, 64].
Fig. (1) shows the final cycling behaviour model with 39 variables and a degree of freedom of 108. For identification, one of the indicators for every latent variable was set equal to an unstandardized coefficient of 1 [65]. Some errors are correlated with each other. The reason is the statistical software suggestions for a better model fit. Although, this does not significantly change the results of model fit tests. An error term is attached to each indicator. Table 3 shows the unstandardized and standardized values for the direct effects of variables on each other and the significance of those effects. All relationships are significant at the 10 percent error level (p-value < 0.1).
Numerous goodness-of-fit measures were considered, which can be seen in Table 4. The root-mean-square error of approximation (RMSEA) for the final model was 0.077, less than the maximum acceptable value of 0.08, and the normalized fit index (NFI) is 0.87, which is acceptable with a little tolerance. Other goodness-of-fit measures were all acceptable.
| Indexes | Acceptable Range | Results |
|---|---|---|
| Goodness-of-fit | >.90 | 0.92 |
| Root mean square error of approximation | <.08 | 0.077 |
| comparative fit index | >.90 | 0.94 |
| Tucker Lewis index | >.90 | 0.92 |
| adjusted goodness-of-fit | >.50 | 0.86 |
5. RESULTS AND DISCUSSION
After exploring numerous possible correlations among the model's variables, the final model was created. In terms of the numerous variables that have been constructed, the final model has the best goodness of fit. At the ten percent error level, the model's associations were all significant, with satisfactory goodness-of-fit findings. Three indicators, ability, cycling-time, and cycling-frq, provide a trustworthy representation of latent variable cycling behaviour through confirmatory factor analysis and the final model. Cycling time (Beta=0.854) has the highest effect on the other two indicators. All variables affect cycling behaviour with direct effects, which are discussed in this section. Age and gender were excluded from the model because of insignificant direct/indirect effects on the model results.
Our findings reveal that personal-health measures directly influence higher cycling by individuals during the pandemic (Beta=0.479). Among numerous variables measuring the personal-health measures, the idea 'cycling reduces my stress during Covid-19' could be a means of giving more attention to personal health in Covid-19 time (Beta=0.856) that is one of the most important subjects in developing countries.
General-health characteristics directly help explain cycling behaviour (Beta=0.307). The latent variable General-health measures estimates with a positive coefficient on the whole trip, crowd-street—prohibition, violation, and hard breath. The high loading factor of the crowd-street indicator implies that lower traffic density in streets causes increased cycling during the pandemic. Furthermore, respondents believe that crowded streets are against social distancing. Individuals believe that the prohibition of private car usage on daily trips will increase the use of bikes during Covid-19.
Based on the results, environmental characteristics can help cycling behaviour during Covid-19. Density is the main indicator to measure environmental characteristics (Beta=0.875). Individuals feel that the higher the population density, the greater the risk of Covid-19 transmission, regardless of whether they are walking or riding (active transport). High density significantly impacts pandemic cycling among the other environmental factors included in this research. According to the results, personal-health measures' latent factor serves to positively explain cycling behaviour (Beta=0.375). Findings reveal that second-hand indicator (I do not use devices that someone else has used before) positively influences the latent variable personal-health measures that confirm the idea in the introduction section that using shared bicycles reduces during covid-19.
The model eventually excluded age, gender, marital status, education, and car ownership through confirmatory factor analysis (CFA).
Last but not least, a strong connection between the ability to cycle and cycling behaviour is determined. The increased ability to cycle would increase the utility of cycling (Beta=0.657).
CONCLUSION
This article intended to contribute to the literature by (1) investigating cases such as identifying latent variables affecting cycling behaviour during Covid-19; (2) identifying three variables based on several questions, structural equation modeling and a major latent variable; (3) examining the effect of individual subjective factors as well as environmental characteristics, general-health measures and personal-health measures and effect of socio-economic characteristics; (4) providing an insight into the case of cycling during Covid-19 in Iran as a developing country which has not been well addressed in previous researches.
In the structural equation modeling, three latent variables were defined that connected with the main latent variable (cycling behaviour). The SEM showed that all variables directly affect the cycling behaviour, and using variables with the indirect effect would cause an imprecise model. The cycling behaviour model was presented utilizing unobserved latent factors that underlie the observed variables using structural equation modeling. From the final model, we concluded that general-health measures have a powerfully negative effect on cycling behaviour. As such, the stricter the general-health measures, the less inclined people are to ride a bike. The final model concluded that three indicators measuring a major latent variable make a model with acceptable goodness-of-fit for cycling behaviour. From the final model, it was understood that with developing the public transport systems, the use of bicycles even for part of a trip could increase (an indicator of the whole trip).
Interestingly, it was found that using shared bicycles has decreased due to the observance of general-health measures. This finding suggests that more use of shared bikes can be achievable by disinfecting shared bicycles after each use of commuters.
One of the policies that might be offered based on the findings is to emphasize the value of riding time, which can be achieved by improving bicycle lanes and safety, resulting in shorter trip times and more cycling. Another major challenge is improving shared bike users' cleanliness to boost their faith in these bikes. Another point derived from the results is that by lowering the density of cars, we could expect to have more cycling. This article shows that political decisions, such as social distancing restrictions, can greatly impact cycling behaviour and reduce bicycle use. People's sensitivity to health issues can affect cycling behaviour, especially on shared bicycles which was the most important achievement of this article.
This study has some considerable limitations. The first is the small number of participants in the survey, which may affect the research results. The second is limited literature studies on this subject, especially in developing countries. Another important limitation is the representativeness of the paper which could be more convincing, but due to pandemic limitations, we could not have a face-to-face survey.
According to the topics, this issue can be re-examined in another country with different situations. Other issues, including the impact of culture and religion on cycling behaviour, may be investigated in future research.
LIST OF ABBREVIATIONS
| SEM | = Structural Equation Modeling |
| WHO | = World Health Organization |
AVAILABILITY OF DATA AND MATERIALS
Not applicable.
FUNDING
None.
CONFLICT OF INTEREST
The authors declare no conflict of interest, financial or otherwise.
ACKNOWLEDGEMENTS
Declared none.

