All published articles of this journal are available on ScienceDirect.

Performance of Bridge Envelope During Earthquake Using Finite Element and Artificial Neural Network Techniques
Abstract
Background:
Bridges are one of the most critical parts of a transportation network that may be damaged during earthquakes and it is necessary to have a prediction model for bridge responses under seismic loads that can be extended to other situations. Soil stiffness significantly affects load distribution when soil, piles, abutment, and superstructure all act as a combined system to resist lateral loading on a bridge.
Methods:
A two-dimensional (2D) model of integral abutment bridge (IAB) with soil springs around piles and behind the abutments for 18.3m, 35.4m, and 64.5m spans respectively, was developed with finite element (FE). The input variables were bridge span, backfill height, soil stiffness behind abutment, and soil stiffness around piles. Also, Artificial Neural Network (ANN) was examined for pile lateral force, pile displacement, pile head moment, girder axial force, and abutment moment.
Results:
Using FE the prediction of critical response for medium span (i.e., 123.6m) and large span (i.e., 249m) by ANN was performed. Findings show that backfill stiffness has an important effect on lateral displacement. The best performance was related to high stiffness backfill with intermediate clay around the pile.
Conclusion:
Stiffness of clay around the pile has an important effect on lateral displacement, pile lateral force, pile bending moment, girder axial force, and girder bending moment at the abutment.
1. INTRODUCTION
One of the most significant aspects of transportation networks is bridges. Prior to and after earthquakes, they play a critical role in keeping communication networks running smoothly. Damage to bridges caused by earthquakes can have significant physical and economic consequences on the transportation sector [1, 2]. However, the majority of highway bridges throughout the world fail to achieve current seismic detailing standards required by regulations and recommendations [3, 4]. Numerous highway bridges have been damaged by large earthquakes in recent decades, resulting in millions of dollars in insurance claims [5]. A change in structural behavior, such as a loss of stiffness, is what constitutes damage to a bridge structure. The objective of structural damage detection is to determine the extent of a structure's damage based on structural behavior changes [6]. IABs are more complicated to analyze since all parts of the bridge must be treated as a unified system, as well as soil-structure interaction (SSI) [7, 8]. IAB has achieved a wide spectrum of appeal over the last several decades since it is more durable and cost-effective in terms of serviceability and maintenance. Because comprehensive evaluation and up-to-date material on IAB are still missing from the archive, the authors couldn't pass up the chance to summarize it in a technical note [9]. Numerous researches have handled the SSI effects as a case-by-case issue under different ground movements. As a result, it's not yet firm if SSI will have a substantial impact on the seismic risk assessment of bridges when they're subjected to different magnitudes of earthquake risks [10-13]. Existing approaches for determining the dynamic properties of bridge foundations include methods such as linear or nonlinear, static or dynamic lumped springs and supporting soils; a linked 2D/3D finite element technique to model the complete soil-foundation-bridge system; and distributed dynamic soil (p-y) springs to account for nonlinear interactions at each soil layer as well as depth-varying ground movements [14-17]. During seismic analysis of bridges, many types of interactions must be addressed, such as soil-foundation-pier, deck-abutment, and abutment-embankment. Strong coupling between soil conditions and spatially varying ground movements has a significant impact on longer bridges. For bridges with deep foundations, soil-foundation-pier interaction may consist of soil-pile or pile-soil-pile (i.e., pile-group) interaction, but for shallow foundations, a simpler method based on wave propagation formulas may generally be used [18, 19]. Some analyses take into account the interaction between the bridge's abutments and approach embankments, with the effect being more obvious in the case of integrated abutments. The soil deterioration under increasing shear deformation, as well as the relevant boundary conditions, were fully studied [20, 21].
Burdette et al. [21] examined the reaction of integrated abutments supported by steel H-piles and prestressed concrete piles in an experimental investigation. When the pile deflection did not exceed the design limit of 25.4 mm specified by the Tennessee Department of Transportation, an embedment length of 0.3 m between the steel pile and the abutment was determined to be sufficient to maintain abutment integrity and keep the steel piles in the elastic range. Significant cracking of the pile–abutment interface was seen beyond this limit, which was more widespread in stiffer soils but did not result in the loss of integrity even in highly stiff soils. When the deflection at the ground surface neared 25.4 mm, the prestressed concrete pile broke immediately below the pile–abutment contact, significantly reducing section stiffness but having little effect on overall behavior. The existing deflection limit was subsequently determined to be cautious, and a value of 38 mm appeared to be more appropriate [22-24]. More study is needed to better understand how structures act when subjected to earthquakes. Further research is being carried out to determine the much-needed performance of structures under seismic stress from various points and orientations. Structural damage detection is one of the most essential parts of evaluating structural systems and promising their long-term safety. This topic is connected to the fact that in many countries, the number of damaged or deteriorating structures is quickly increasing [25, 26].
Artificial Neural Networks (ANN) are used in the framework to generate probabilistic seismic demand models based on reaction data from experimentally verified finite element models. The basic linear and nonlinear relations in a dataset are represented using ANN, a statistical approach for function approximation. The advantages of applying ANN models rather than traditional techniques for generating seismic demand models (i.e., power functions generated from linear regressions in the log-log space) are thoroughly explored [27-29]. ANNs were utilized by several researchers to identify, locate, and quantify deterioration in bridge constructions. In a numerical simulation of a two-dimensional, nine-bay truss construction, Modarres et al. [30] employed MLP neural networks to identify and localize damage, assuming that damage happens in only one element at a time. Gu et al. [31] used neural networks to carry out damage recognition under variable temperatures. Simulated data from a finite element model of the bridge was used to train the neural networks.
ANN and LEFM-based fatigue reliability analysis and truck weight limits of steel bridges after crack detection were studied by Li et al. [32]. They found that the suggested framework can enhance the fatigue reliability assessment process in terms of accuracy and efficiency. Also, the method of setting gross vehicle weight limits can effectively control the fatigue failure probability to be within 2.3% according to the desired remaining service time and the detected crack size.
Martinez et al. [33] examined data mining models for the prediction of bridge future conditions with ANN. The decision their tree model showed acceptable predictive results (within 0.25% mean relative error) when predicting the future BCI. Also, the prediction of bridge deck condition rating based on artificial neural networks is considered by Nguyen & Dinh [34]. They showed that the obtained ANN can be used to develop the deterioration curve of the bridge deck, which helps visualize the condition rating of a deck, and accordingly the maintenance need, during its remaining service life. Soleimani & Liu [35] indicated that ANN-based PSDMs can be further used in estimating the probability of structural damage in the fragility and risk assessment process.
The goal of this paper is to show how a neural network-based methodology can be used to describe and detect simulated and real-world structural systems. The bridge observed in this study is a single-span bridge including a concrete girder from medium (123.6 m) to large (249 m) span domain. Loads for the FE models included time history displacement. The input data to ANNs as used for prediction critical response of IABs are dependent on parametric study results. The network was trained using time history analysis results for several variables. i.e., span, backfill height, soil stiffness behind abutment, and soil stiffness around the pile to get the prediction response for short and medium span critical response.
2. MATERIALS AND METHODS
A complete IAB is a structure in which the superstructure of the bridge is directly related to its substructure. 2D numerical model takes into consideration the superstructure transverse and the symmetry of the longitudinal centerline. Interaction analysis of the soil base structure is advantageous for the actions of IAB subjected to seismic forces. Soil abutment interaction, soil pile interaction, the connection of abutment back wall and the connection of pile abutment are crucial factors leading to modelling. First, a model formalized for a pile that has been implemented in the bridge in order to verify software is used in this study. Then, p-y curves of the pile at various heights below the ground are measured. The model formulization of backwall follows the same procedure. The next critical phase of model formulization process is the connection between backwall and abutment. Therefore, (M-ϕ) diagram is applied to draw (M-θ) diagram which is the necessary software for model formulization of non-linear behavior of connection. After all these steps, a comprehensive model of FE will be generated and it will be possible to perform parametrical research on this model.
2.1. Finite Element Modeling (FEM)
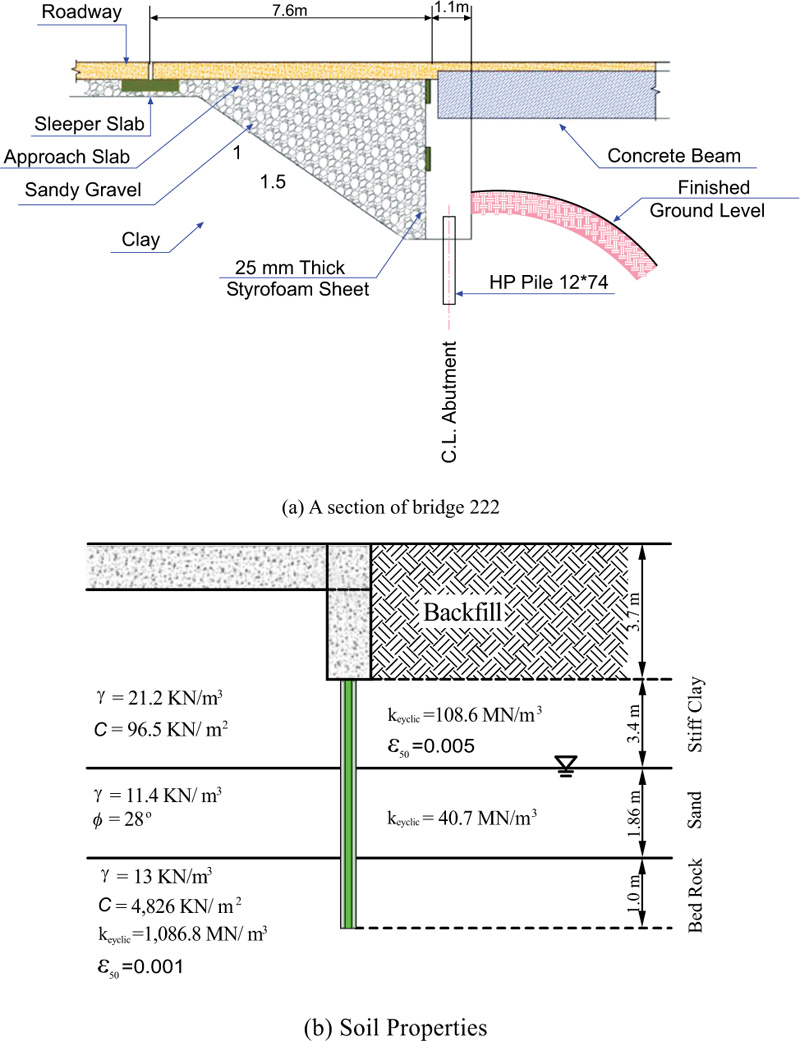
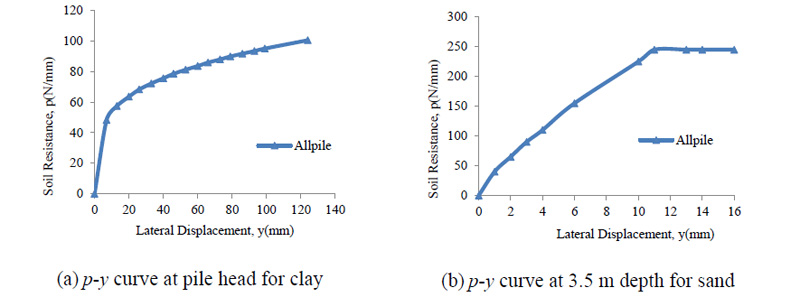
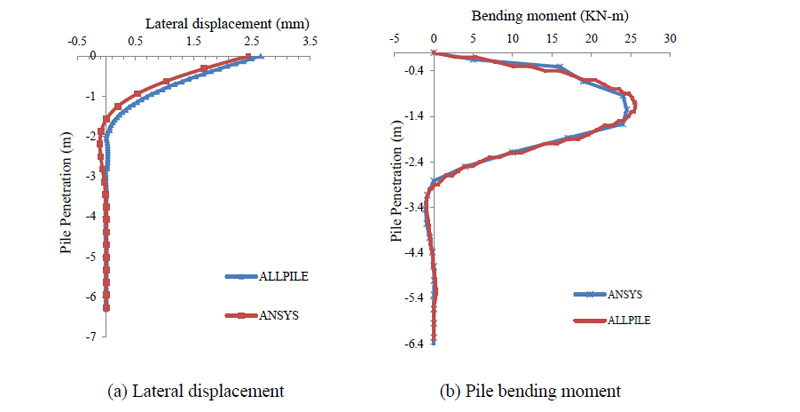
Soil pile and soil abutment interactions, known as soil structure interactions (SSIs), are related to geotechnical behavior, while abutment backwall and pile abutment connections are related to the yielding of structural connections. SSI generally has a more influential parameter than the yielding of structural connections, because soil exhibits nonlinear and hysteretic behavior even over a small range of deformations. In addition, the yielding of structural connections may never occur in a lifetime of bridge structures, if properly designed. The classical p-y curve technique is assumed to deliver a load-deformation curve of laterally loaded SSI behaviours. p-y curves are generated using the COM624P developed by Wang and Reese [36]. The p-y curve technique is one of the SSI examination methods based on the modulus of the subgrade reaction approach. The substitution of nonlinear p-y curve springs in the governing equation was done instead of using a traditional linear winkler spring. Lateral analysis in AllPile (AP) software utilizes the finite difference method for the modeling of SSI. In lateral loading, the pile shaft deflects and exerts pressure on the adjacent soils, resulting in the generating of lateral resistance (pressure) between soils and pile. By integrating lateral pressure, shear, moment, rotation and deflection, an analysis of the pile and soil interaction and behavior is obtained. Also, for validation of FE software (i.e., ANSYS) and AP software, one pile of implemented IAB is chosen and modelled with FE software by p-y curves taken from AP software; then the output of FE and AP is compared. Fig. (1a) shows bridge 222, Pennsylvania which is used in this research. Also, soil parameters were taken from Bridge 222 soil profile for clay above water table and sand, displayed in Fig. (1b). Samples of p-y curves generated by AP software are presented in Fig. (2). Both AP and FE softwares display highly similar responses to the lateral force on the pile head. Therefore, it may be concluded that it is possible to expect acceptable responses for SSI within the bridge piles. As shown in Fig. (3) maximum displacement was 2.44 mm by FE software and 2.65 mm by AP, while the maximum moment is 24.5 kN-m by FE and 25.6 kN-m by AP. FE software predictions of pile behavior are similar to AP with percentage differences of 8% and 8.5%, for maximum displacement and maximum moment respectively. Element length in the FE pile model is relatively coarse (33 mm) compared to the length used in AP (30 mm). Therefore, some small differences in moments at a depth of approximately 3 mm are expected to appear, where a short distance of two adjacent inflection points occurs.
| Bridge | Spans | Spans Length (m) | Bridge Length (m) | Abutment Height (m) |
|---|---|---|---|---|
| 222 | 1 | 18.9 | 18.9 | 2.82 |
Table 1 presents a summary of IAB structure in this research. The abutment is supported by a single row of weak axis-oriented steel piles by HP12×74. In FE, BEAM3 element was used to combine a composite slab and four girder sections. This beam member was subdivided into 10 pieces, all located on a composite elastic neutral axis. An elastic modulus of girders was used as a reference modulus, so that slab and parapet widths were transformed using corresponding modulus ratios. AASHTO LRFD [37] was used to determine a concrete modulus of elasticity based on a girder’s concrete strength of 55.2 MPa. Table 2 reviews the material properties of the superstructure.
| Bridge | Area | Modulus of Elasticity Mpa |
Moment of Inertia | m |
|---|---|---|---|---|
| 222 | 4.37 | 35536 | 1.432 | 1.098 |
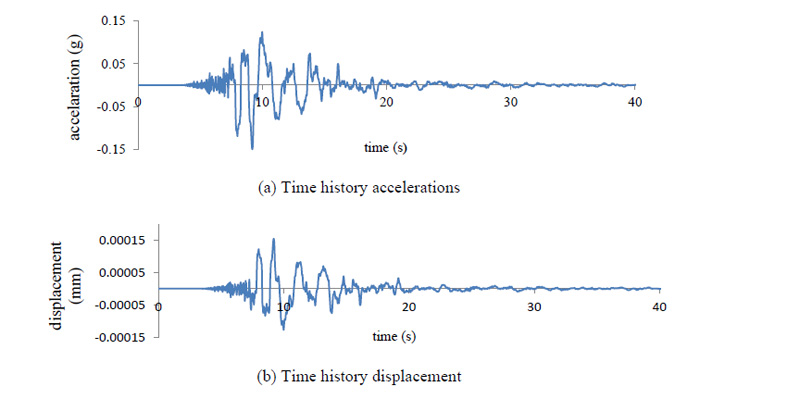
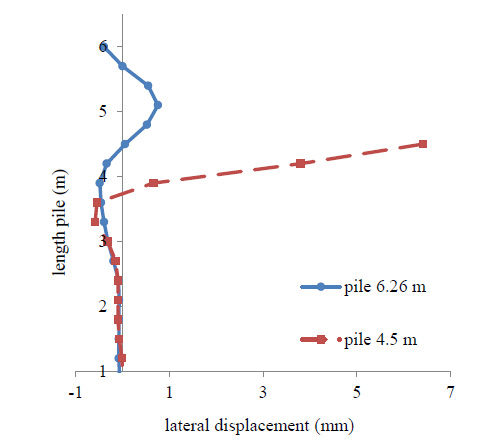
Fig. (4) shows time history accelerations and displacement at the height of 2m below the surface of the soil profile. When time history analysis is performed and convergent results are obtained, structure reaction at the selected time can be seen. The output which is investigated in this study includes lateral displacement on pile head, bending moment at pile head and axial force in girder. As shown in Fig. (5), the highest lateral deflection of the piles along the length is always at the interface of the pile abutment. The pile deflection at the top of pile with 6.26 m length is 0.397 mm and pile deflection at the top of pile with 4.5 m length is 6 mm. In time history analysis for each time, applied particular displacement on structures and behavior of the structure is checked at that time. The largest lateral displacements above and below the abutment walls during the time history analysis are presented in Table 3 for abutments, showing how generally the maximum wall lateral displacements are greater at the bottom and well matched with the pile deflection. Consequently, essentially all lateral and longitudinal loads applied to the superstructure of such bridges are transmitted directly to abutment embankments. It is obvious that the stiffness of the soil to the rear of the abutment and in the vicinity of the piles affects the pile deflection, which is reduced when the soil stiffness is reduced. The highest positive and negative moments in head of piles for the duration of the time history analysis are presented in Table 4. It appears that there is a normal reduction in the girder moments along the bridge, within the span due to stiffness of the soil at the back of the abutment and in the area surrounding the piles, like the pile deflection and abutment displacement.
| Case | Abutment 1 | Abutment 2 | ||
|---|---|---|---|---|
| Top | Bottom | Top | Bottom | |
| Bridge 222 | 0.397 | -6 | -0.397 | 6 |
| Case | Moment of Pile Head (kN-m) |
Girder Axial Force (kN) |
|---|---|---|
| Bridge 222 | 23 | 154 |
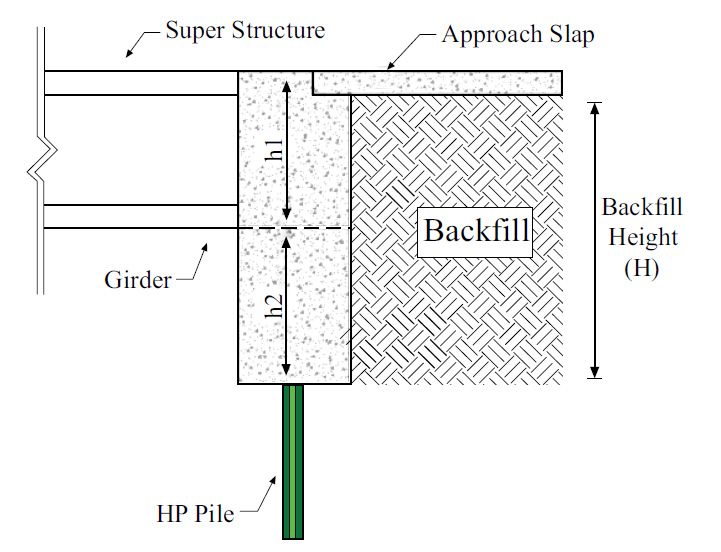
An adopted common IAB foundation configuration consists of a single row of steel HP piles supporting a cast in place and wall type abutment and backwall with MPa supporting girders. Bridge span (L) and height of backfill (H) are the two structural bridge dimensional parameters considered in the parametric analysis. To portray short to medium bridges, bridge spans were chosen. Backfill heights were chosen to reflect medium to high abutments of the stub type. The bridge spans considered were 18.3, 34.5, and 65.4 m. The overall backfill height from the bottom of the abutment pile cap to the bottom of the approach slab is expressed by H. For each IAB, the level of the roadway was retained, while the abutment below the height of the girder seat was shown in Fig. (6) for various bridge lengths. As a conclusion of this convention, the construction joint between abutment and backwall has different elevations as the bridge span changes.
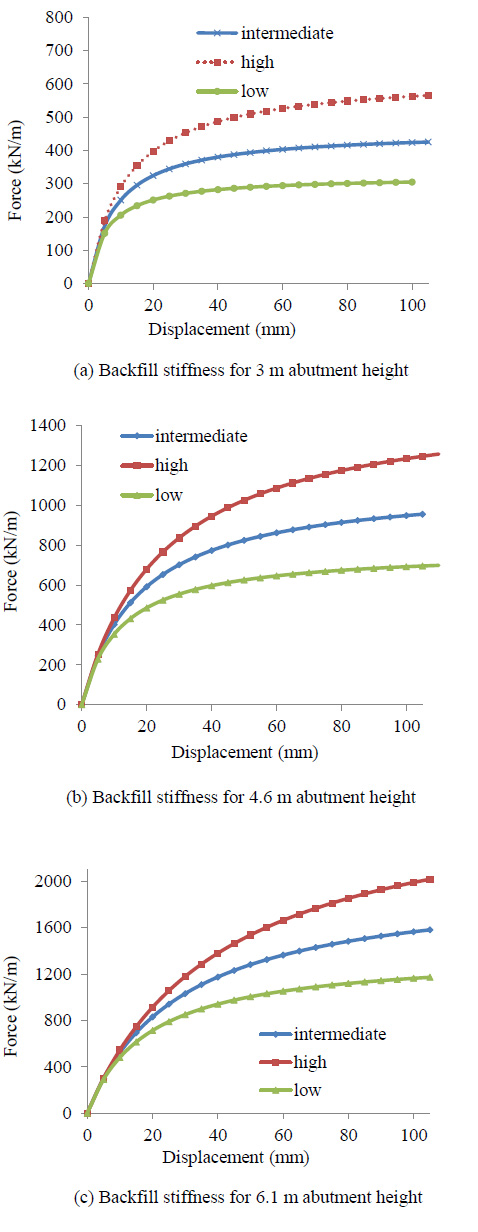
Backfills behind abutments, due to soil density, exert lateral loads during bridge contraction while backfills also exert resistances during bridge expansion. Thus, the abutment backfill limitation was recognized based on friction angle and soil density which correspond to load and resistance of backfill, respectively. On the other hand, soil layers around supporting piles only resist bridge loads and movement. Characteristics and variations of typical backfill soil properties shown in (Table 5). Density and friction angle of backfill soils of field-tested bridges were all the same, and these parameters were assumed as mean values. For the subgrade modulus, field measurements were examined using abutment displacement and backfill pressure. As mentioned earlier, p-y curves were obtained from AP and shown in Fig. (7).
| Property | Unit | High | Intermediate | Low |
|---|---|---|---|---|
| Density | 19.3 | 18.7 | 18.2 | |
| Angle of friction | Degree | 37.4 | 34 | 30.6 |
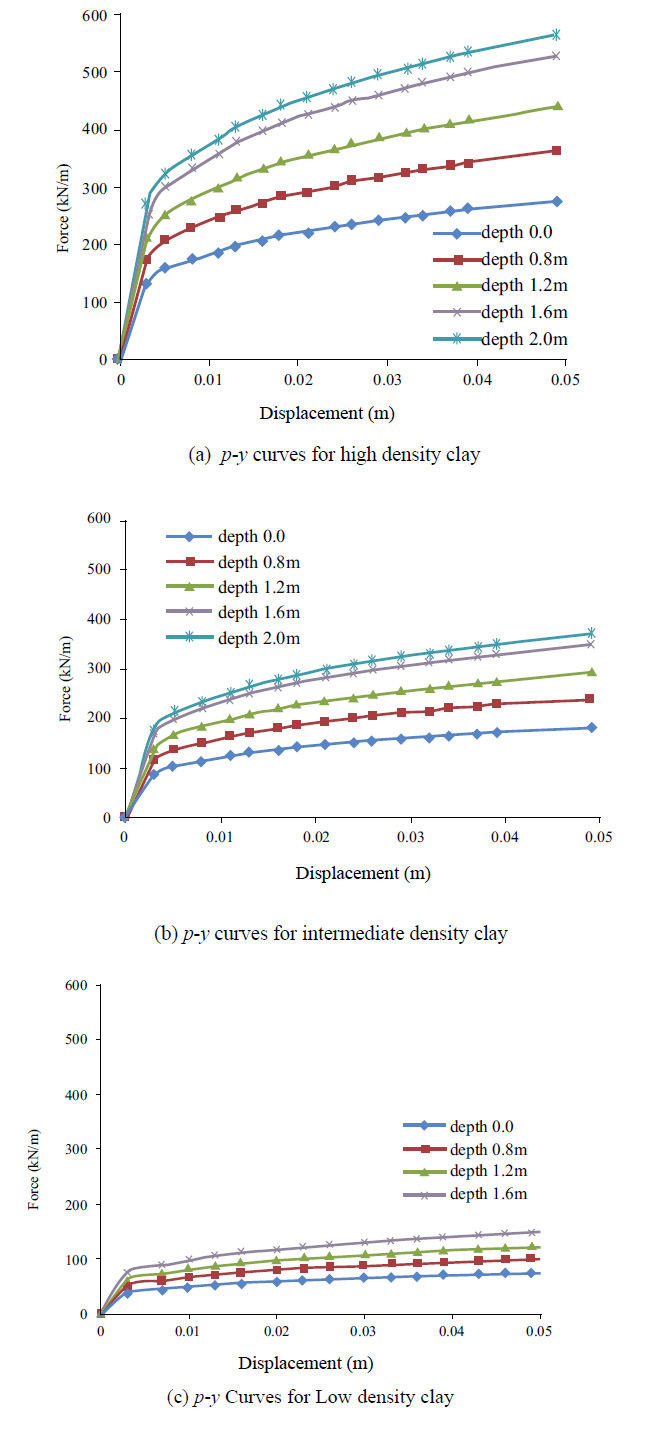
HP 1274 piles with yield strength of 345 MPa were used for the parametric study. In the present study, piles were assumed to be driven up to 18.9 m below the surface. Soil pile interaction properties also considered various overburden pressure and soil properties. Three different high and low values for soil pile interaction settled to the different overburden pressures. The assumed high and low soil stiffness properties for clay are shown in Table 6. Intermediate values were established from the average of high and low values. Furthermore, clay with high, intermediate, and low stiffness p-y curves are shown in Fig. (8).
| Property | Units | High | Intermediate | Low |
|---|---|---|---|---|
| Clay density | 22 | 19 | 16 | |
| Elastic modulus | 353 | 271 | 190 | |
| mm | 0.13 | 0.20 | 0.25 |
| Case ID |
Bridge Span (L) m |
Backfill Height (H) m |
Backfill Stiffness (B) | Clay Stiffness around Piles (P) |
|---|---|---|---|---|
| 1 | 18.3 | 3.0 | High (h) | High (h) |
| 2 | Intermediate (i) | |||
| 3 | Low (l) | |||
| 4 | Intermediate (i) | h | ||
| 5 | i | |||
| 6 | l | |||
| 7 | Low (l) | h | ||
| 8 | i | |||
| 9 | l | |||
| 10 | 4.6 | h | h | |
| 11 | i | |||
| 12 | l | |||
| 13 | i | h | ||
| 14 | i | |||
| 15 | l | |||
| 16 | l | h | ||
| 17 | i | |||
| 18 | l | |||
| 19 | 6.1 | h | h | |
| 20 | i | |||
| 21 | l | |||
| 22 | i | h | ||
| 23 | i | |||
| 24 | l | |||
| 25 | l | h | ||
| 26 | i | |||
| 27 | l | |||
| 28 | 35.4 | 3.0 | h | h |
| 29 | i | |||
| 30 | l | |||
| 31 | i | h | ||
| 32 | i | |||
| 33 | l | |||
| 34 | l | h | ||
| 35 | i | |||
| 36 | l | |||
| 37 | 4.6 | h | h | |
| 38 | i | |||
| 39 | l | |||
| 40 | i | h | ||
| 41 | i | |||
| 42 | l | |||
| 43 | l | h | ||
| 44 | i | |||
| 45 | l | |||
| 46 | 6.1 | h | h | |
| 47 | i | |||
| 78 | l | |||
| 49 | i | h | ||
| 50 | i | |||
| 51 | l | |||
| 52 | l | h | ||
| 53 | i | |||
| 54 | l | |||
| 55 | 64.5 | 3.0 | h | h |
| 56 | i | |||
| 57 | l | |||
| 58 | i | h | ||
| 59 | i | |||
| 60 | l | |||
| 61 | l | h | ||
| 62 | i | |||
| 63 | l | |||
| 64 | 4.6 | h | h | |
| 65 | i | |||
| 66 | l | |||
| 67 | i | h | ||
| 68 | i | |||
| 69 | l | |||
| 70 | l | h | ||
| 71 | i | |||
| 72 | l |
| Case ID |
Bridge Span (L) m |
Backfill Height (H) m |
Backfill Stiffness (B) | Clay Stiffness around Piles (P) |
|---|---|---|---|---|
| 73 | 64.5 | 6.1 | h | h |
| 74 | i | |||
| 75 | l | |||
| 76 | i | h | ||
| 77 | i | |||
| 78 | l | |||
| 79 | l | h | ||
| 80 | i | |||
| 81 | l |
2.2. Artificial Neural Network Pattern
The unit in each layer (
Several input parameters were chosen to provide for the training of the network, specifically the bridge span, backfill height, stiffness of soil behind abutment and soil stiffness around pile. Each input neuron represents a separate attribute in the train datasets station for example from the bridge span. The number of input variables is 4, consisting of bridge span, backfill height, soil stiffness behind abutment, and soil stiffness around piles. The number of outputs is five, consisting of pile lateral force, pile displacement, pile head moment, girder axial force, and abutment moment. The training setting for two hidden layers. In this parametric study, three levels of span 18.3, 35.4 and 64.5 were selected to train to the prediction of response with another longer span (i.e., 123.6 m and 245 m).
3. RESULTS AND DISCUSSION
This study performed 81 sets of parametric investigations of IAB’s using FEM and ANN methods. The considered parameters include bridge span, backfill height, backfill stiffness, and stiffness clay around the pile are listed in (Table 7). Critical responses of pile head moment, pile head lateral load, girder axial force, pile head movement and pile head abutment moment were determined.
3.1. FE Results
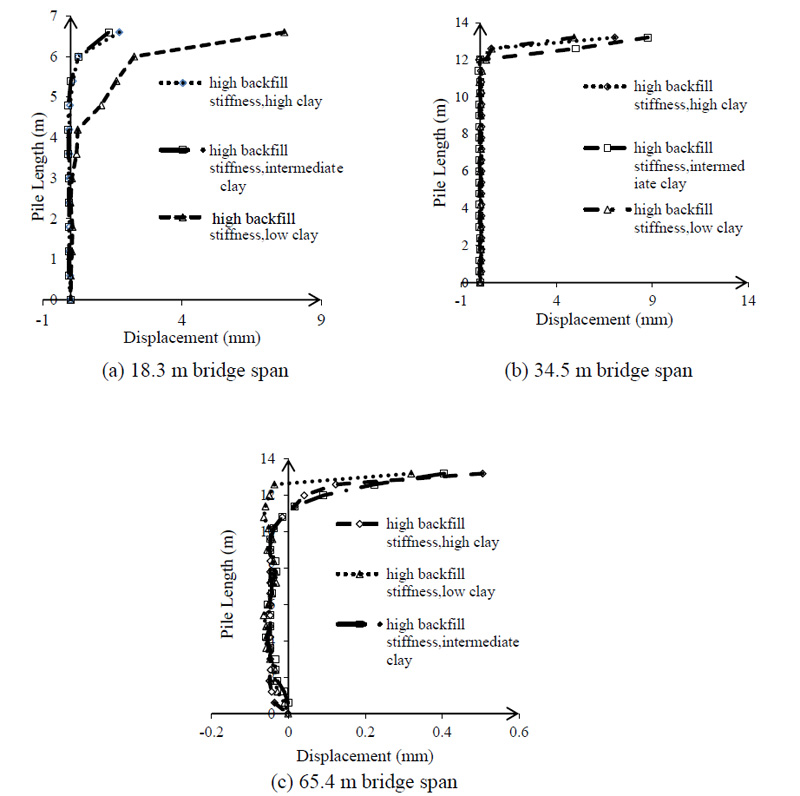
The domain is selected in line with the proper range. For the purpose of determining the effect of bridge span on critical lateral displacement of bridge following time history analysis under seismic loads, three spans were selected as shown in Table 8. The lateral displacement shown by the change in the span of the bridge. Time history analysis was applied in all pile displacement cases and pile displacement for three groups of spans. In Fig. (9a), three bridges with the same 18.3 m span were analyzed and the lateral displacements were compared together. Bearing in mind the conditions of equality to stiffness of backfill, case 2 with intermediate stiffness clay around the pile shows better performance and with less lateral displacement. This process is repeated in Fig. (9b & c), which illustrates that generally the best performance is related to clay with low stiffness. If lateral displacement provides a favorable condition, IAB has better performance.
| ID Case | Bridge Span (m) | Clay Stiffness Around Pile |
|---|---|---|
| 1 | 18.3 | High |
| 2 | 18.3 | Intermediate |
| 3 | 18.3 | Low |
| 28 | 34.5 | High |
| 29 | 34.5 | Intermediate |
| 30 | 34.5 | Low |
| 55 | 65.4 | High |
| 56 | 65.4 | Intermediate |
| 57 | 65.4 | Low |
The maximum average positive moment, increased the studied cases with span 18.3 m to 32.13 kN-m, whereas for span 34.5 m it was 42.38 kN-m and for span 65.4 m it was 71.13 kN-m. The maximum average negative moment, and increase in the studied cases with 18.3 m was -30.5 kN-m, 34.5 m it was -42.38 kN-m, while for 65.4 m span it was -79.13 kN-m. Most of the pile-yielding cases were IABs with 65.4 m. With the increase in bridge span, both compressive and tensile girder axial forces, increase considerably. The maximum average compressive girder axial force increases between the studied cases with span 18.3 m and 65.4 m were 389.7 kN and 795.1 kN, respectively. Also, the maximum average tensile girder axial force increases between the studied cases with span 18.3 m and 65.4 m were 250.0 kN and 522.1 kN, respectively. As bridge span increases, both positive and negative girder bending moment at the abutment, significantly increases. The average positive moment increase in the studied cases with span 18.3 m was 366.5 and for 65.4 m it was 548.8 kN-m. In addition, the average negative moment increase in the studied cases with span 18.3 m was -268.6 kN-m and for 65.4 m it was -591.7 kN-m. In Table 9, the results of the time history are reviewed.
Table 9.
| ID Case | Pile Head Lateral Force (kN) |
Pile Head Displacement (mm) |
Pile Head Moment (kN-m) |
Girder Axial Force (kN) |
Abutment Moment (kN-m) |
|---|---|---|---|---|---|
| 1 | 12.5 | -1.75 | 37.9 | -345.5 | -689.3 |
| 2 | 10.5 | -1.54 | 35.7 | -351.3 | -633.1 |
| 3 | 7.8 | -7.68 | 32.8 | 218.3 | -597.9 |
| 28 | -30.8 | 5.03 | -49.2 | -437.4 | -815.0 |
| 29 | 35.5 | 8.7 | -48.8 | -441.1 | -869.4 |
| 30 | 25.9 | -4.9 | 38.5 | 367.1 | 948.4 |
| 55 | -45.1 | 0.5 | -67.6 | -528.4 | 1235.2 |
| 56 | -40.6 | 0.4 | -55.249 | -535.5 | 1357.2 |
| 57 | -37.2 | 0.2 | -53.4 | -587.3 | -987.1 |
Considering the conditions of equality to the stiffness of soil around the pile with high stiffness, backfill stiffness has an important effect on lateral displacement. Best performance is related to high stiffness backfill with high clay around the pile. The backfill stiffness is rarely influential on pile lateral force. The backfill stiffness does not affect the efficacy of the pile bending moment, as it does not have any influential effect on the girder bending moment. The domain of stiffness soil around pile changes in this parametric study is from high to low stiffness in properties that are determined in detail in Table 10.
| ID case | Bridge length | Soil stiffness clay |
|---|---|---|
| 4 | 18.3 | High |
| 5 | 18.3 | Intermediate |
| 6 | 18.3 | low |
| 31 | 34.5 | High |
| 32 | 34.5 | Intermediate |
| 33 | 34.5 | low |
| 58 | 65.4 | High |
| 59 | 65.4 | Intermediate |
| 60 | 65.4 | low |
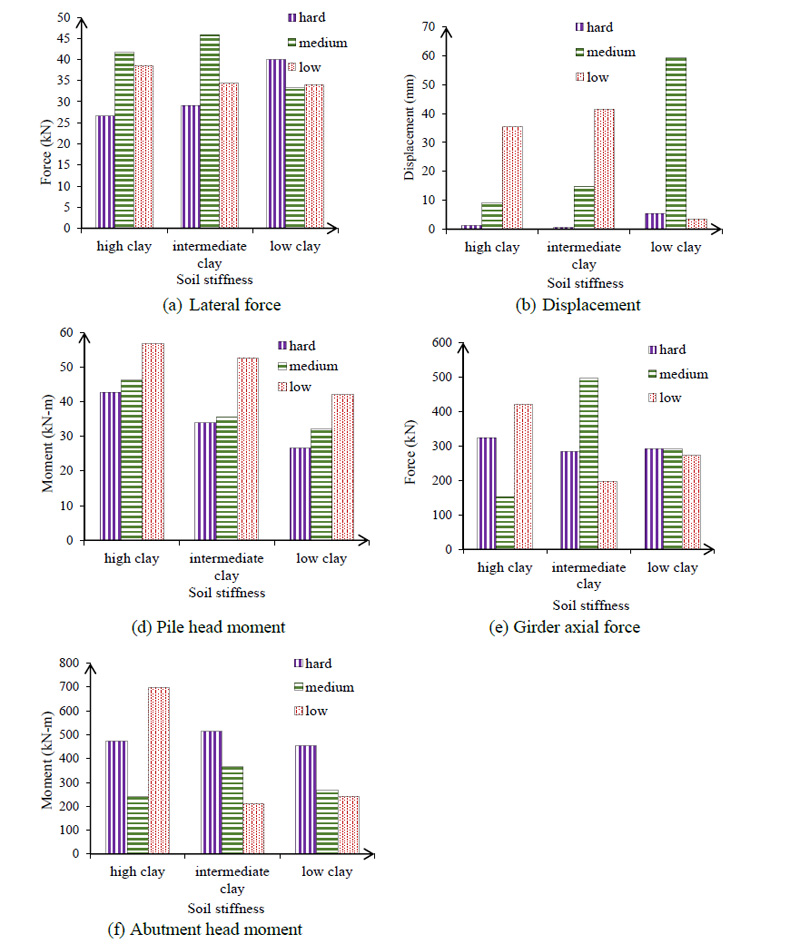
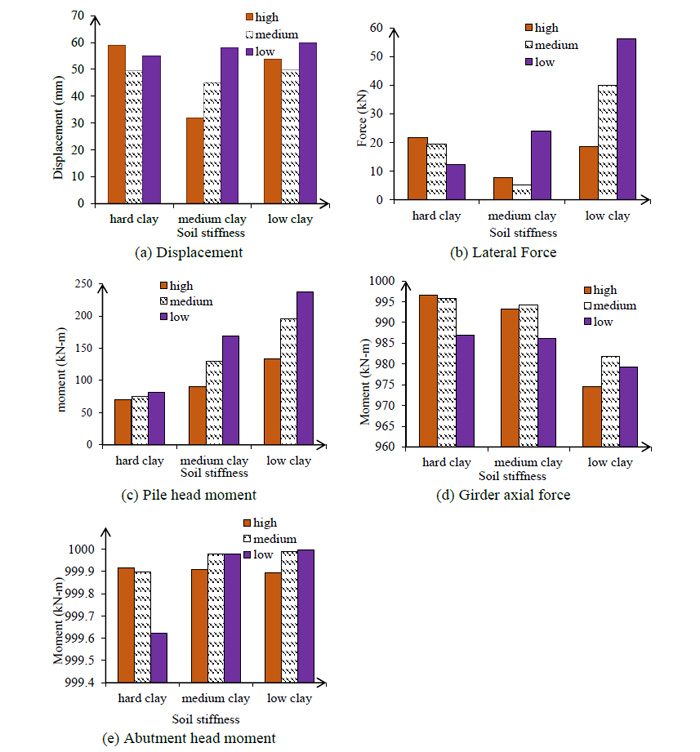
The results of the time history analysis are presented in Table 11. Fig. (10) shows the absolute value of outputs relative to the seismic load applied in the longitudinal direction as a parametric modeling case considered 34.5 m span and 4.6 m height of backfill by stiffness soil around the pile and backfill stiffness. When soil stiffness around the pile is high and subjected to ground motions, the maximum lateral force in the longitudinal direction obtained is 26.6 kN for the case where the backfill stiffness is hard. However, for clay stiffness that is intermediate and low analyzed using the same ground motions and scales and including the soil pile interaction behavior in the structural models, maximum lateral force is obtained as 29.12 and 40 kN respectively. The differences between maximum displacements obtained from high, intermediate and low clay stiffness around pile are 37.8% and 85.6% respectively as shown in Fig. (10b). The upper level represents the maximum envelope and the lower level is the minimum envelope of outputs for 81 sets that were modeled.
Table 11.
| ID Case | Pile Head Lateral Force (kN) |
Pile Head Displacement (mm) |
Pile Head Moment (kN-m) |
Girder Axial Force (kN) |
Abutment Moment (kN-m) |
|---|---|---|---|---|---|
| 4 | 11.31 | 0.23 | 39.1 | 343.0 | 514.0 |
| 5 | 11.0 | 4.4 | 35.8 | -23.2 | -199.8 |
| 6 | 7.5 | 3.9 | -27.6 | 509.0 | -188.7 |
| 31 | 23.6 | -0.88 | 45.4 | 358.6 | 210.4 |
| 32 | 25.4 | -9.2 | 34.7 | -391.2 | -583.8 |
| 33 | -21.6 | 15.2 | -32.0 | -391.2 | -301.1 |
| 58 | -49.7 | 28.0 | -77.6 | 1055.4 | -473.2 |
| 59 | 41.7 | -0.33 | 64.7 | 817.6 | 675.0 |
| 60 | -37.9 | 23.5 | -62.7 | 730.9 | -416.8 |
3.2. ANN Results
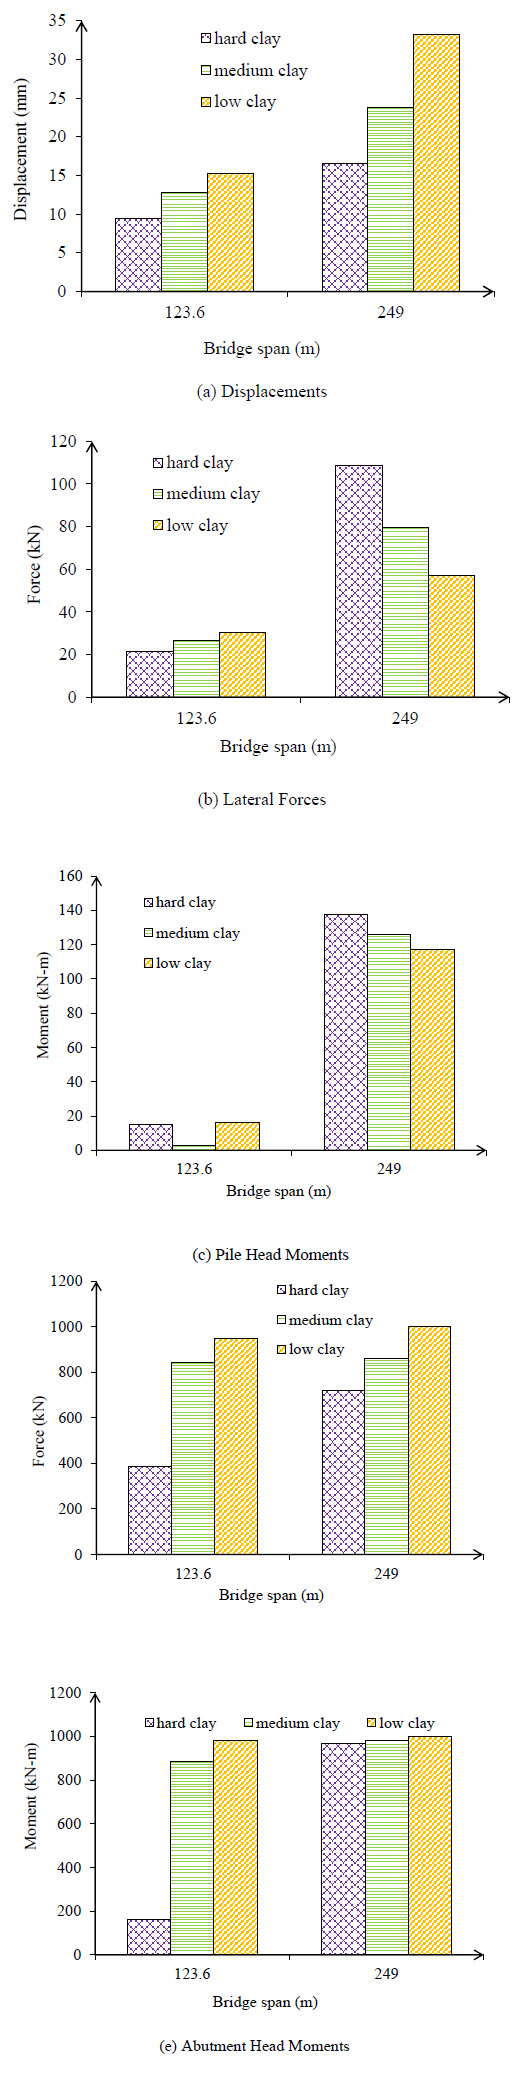
ANN (i.e., Visual Gene Developer) was used to perform response prediction for pile lateral force, pile displacement, pile head moment, girder axial force and abutment moment. Fig. (11) shows the absolute value of outputs forecast relative to the seismic load applied in the longitudinal direction including the stiffness soil around the pile. As shown in Fig. (11a), the absolute value of displacement with considered stiffness of soil around pile for 123.6 m span with hard, medium and low-density clay, is 9.42, 12.78, 15.32 mm respectively and for 246 m span is16.56, 23.76, 33.20 mm. When the bridge span is increased, pile lateral force significantly increases. The lateral force for 249 m span with hard stiffness soil around the pile predicted by ANN was 108.84 kN. As bridge span increases, both compressive and tensile pile head moment, considerably increase (Fig. 11b). With a comparison between two bridge lengths, the girder axial force increases between the studied cases with a span of 123.6 m and 249 m and the absolute values for medium clay are 26.86 kN and 108.84 kN, respectively. The absolute value for girder axial force changes 336.79 kN between 123.6 and 249 m span for hard clay (Fig. 11d). As bridge span increases, both positive and negative abutment head moment, increases as depicted in Fig. (11c). Based on the parametric results as input to Visual Gene Developer, the abutment head moment is forecast at 162.63 kN-m for 123.6 m span and 968 kN-m for 249 m span in the hard clay. The results of the Artificial Neural Network analysis are presented in Table 12.
| ID Case |
Bridge Length (L) m |
Backfill Height (H) m |
Backfill Stiffness (B) |
Sand Stiffness around Piles (P) |
Pile Head Displacement Dp |
Pile Lateral Force Fp |
Pile Head Moment Mp | Girder Axial Force Pg |
Head Abutment Moment Mge |
|---|---|---|---|---|---|---|---|---|---|
| 1 | 123.6 | 3 | 19.3 | 22 | 9.42 | -21.27 | -15.01 | 384.19 | 162.63 |
| 2 | 123.6 | 3 | 19.3 | 19 | 12.79 | -26.87 | 2.84 | 842.44 | 886.95 |
| 3 | 123.6 | 3 | 19.3 | 16 | 15.33 | -30.32 | 16.29 | 949.28 | 981.09 |
| 4 | 123.6 | 3 | 18.7 | 22 | 9.62 | -17.64 | -13.66 | 312.53 | 147.23 |
| 5 | 123.6 | 3 | 18.7 | 19 | 11.51 | -23.82 | -3.90 | 708.83 | 722.37 |
| 6 | 123.6 | 3 | 18.7 | 16 | 14.33 | -28.79 | 11.02 | 919.41 | 961.19 |
| 7 | 123.6 | 3 | 18.3 | 22 | 11.29 | -14.86 | -4.43 | 499.51 | 563.63 |
| 8 | 123.6 | 3 | 18.3 | 19 | 11.45 | -20.74 | -4.00 | 648.30 | 677.01 |
| 9 | 123.6 | 3 | 18.3 | 16 | 13.40 | -26.81 | 6.17 | 872.72 | 923.21 |
| 10 | 123.6 | 4.6 | 19.3 | 22 | -10.17 | -21.64 | 69.84 | 996.63 | 999.92 |
| 11 | 123.6 | 4.6 | 19.3 | 19 | -49.50 | -19.42 | 75.77 | 995.73 | 999.90 |
| 12 | 123.6 | 4.6 | 19.3 | 16 | -108.88 | -12.25 | 80.99 | 987.01 | 999.62 |
| 13 | 123.6 | 4.6 | 18.7 | 22 | -94.28 | -7.66 | 90.96 | 993.22 | 999.91 |
| 14 | 123.6 | 4.6 | 18.7 | 19 | -145.70 | 5.05 | 129.54 | 994.21 | 999.98 |
| 15 | 123.6 | 4.6 | 18.7 | 16 | -158.65 | 24.09 | 168.38 | 986.10 | 999.98 |
| 16 | 123.6 | 4.6 | 18.2 | 22 | -153.92 | 18.57 | 133.91 | 974.60 | 999.89 |
| 17 | 123.6 | 4.6 | 18.2 | 19 | -159.58 | 39.99 | 195.66 | 981.85 | 999.99 |
| 18 | 123.6 | 4.6 | 18.2 | 16 | -159.95 | 56.08 | 236.92 | 979.30 | 1000.00 |
| 19 | 123.6 | 6.1 | 19.3 | 22 | -159.99 | 77.23 | 283.66 | 980.56 | 1000.00 |
| 20 | 123.6 | 6.1 | 19.3 | 19 | -159.99 | 76.17 | 287.71 | 986.37 | 1000.00 |
| 21 | 123.6 | 6.1 | 19.3 | 16 | -159.99 | 74.40 | 288.41 | 988.52 | 1000.00 |
| 22 | 123.6 | 6.1 | 18.7 | 22 | -159.99 | 80.61 | 274.59 | 946.16 | 1000.00 |
| 23 | 123.6 | 6.1 | 18.7 | 19 | -159.99 | 79.13 | 279.75 | 967.40 | 1000.00 |
| 24 | 123.6 | 6.1 | 18.7 | 16 | -159.99 | 76.96 | 284.52 | 980.95 | 1000.00 |
| 25 | 123.6 | 6.1 | 18.2 | 22 | -159.99 | 83.30 | 265.05 | 862.71 | 999.99 |
| 26 | 123.6 | 6.1 | 18.2 | 19 | -159.99 | 81.78 | 270.68 | 919.17 | 1000.00 |
| 27 | 123.6 | 6.1 | 18.2 | 16 | -159.99 | 79.49 | 277.57 | 960.00 | 1000.00 |
| 28 | 249 | 3 | 19.3 | 22 | 33.209 | -108.84 | -137.71 | 999.97 | -1000 |
| 29 | 249 | 3 | 19.3 | 19 | 23.761 | -79.49 | -126.14 | 999.99 | -999.99 |
| 30 | 249 | 3 | 19.3 | 16 | 16.56 | -57.02 | -117.42 | 1000 | -999.54 |
| 31 | 249 | 3 | 18.7 | 22 | 33.20 | -108.82 | -137.70 | 999.97 | -1000 |
| 32 | 249 | 3 | 18.7 | 19 | 23.99 | -80.20 | -126.41 | 999.99 | -999.99 |
| 33 | 249 | 3 | 18.7 | 16 | 16.32 | -56.26 | -117.134475 | 1000 | -999.47 |
| 34 | 249 | 3 | 18.3 | 22 | 33.05 | -108.35 | -137.52 | 999.97 | -1000 |
| 35 | 249 | 3 | 18.3 | 19 | 24.20 | -80.86 | -126.67 | 999.99 | -999.99 |
| 36 | 249 | 3 | 18.3 | 16 | 16.21 | -55.91 | -117.00 | 1000 | -999.44 |
| 37 | 249 | 4.6 | 19.3 | 22 | 35.12 | -114.77 | -140.09 | 999.948 | -1000 |
| 38 | 249 | 4.6 | 19.3 | 19 | 35.93 | -117.26 | -141.09 | 999.92 | -1000 |
| 39 | 249 | 4.6 | 19.3 | 16 | 33.43 | -109.55 | -137.99 | 999.97 | -1000 |
| 40 | 249 | 4.6 | 18.7 | 22 | 32.03 | -105.20 | -136.26 | 999.98 | -999.99 |
| 41 | 249 | 4.6 | 18.7 | 19 | 33.88 | -110.92 | -138.55 | 999.97 | -1000 |
| 42 | 249 | 4.6 | 18.7 | 16 | 30.97 | -101.92 | -134.96 | 999.99 | -999.99 |
| 43 | 249 | 4.6 | 18.2 | 22 | 28.50 | -94.25 | -131.92 | 999.99 | -999.99 |
| 44 | 249 | 4.6 | 18.2 | 19 | 31.65 | -104.02 | -135.79 | 999.98 | -999.9999 |
| 45 | 249 | 4.6 | 18.2 | 16 | 28.81 | -95.21 | -132.30 | 999.99 | -999.99 |
| 46 | 249 | 6.1 | 19.3 | 22 | 23.81 | -79.64 | -126.20 | 999.99 | -999.99 |
| 47 | 249 | 6.1 | 19.3 | 19 | 35.66 | -116.45 | -140.76 | 999.93 | -1000 |
| 48 | 249 | 6.1 | 19.3 | 16 | 40.06 | -130.00 | -146.23 | 999.49 | -1000 |
| 49 | 249 | 6.1 | 18.7 | 22 | 18.09 | -61.79 | -119.2698 | 1000 | -999.81 |
| 50 | 249 | 6.1 | 18.7 | 19 | 29.72 | -98.03 | -133.42 | 999.99 | -999.99 |
| 51 | 249 | 6.1 | 18.7 | 16 | 37.842 | -123.16 | -143.47 | 999.82 | -1000 |
| 52 | 249 | 6.1 | 18.2 | 22 | 15.387 | -53.33 | -116.00 | 1000 | -999.09 |
| 53 | 249 | 6.1 | 18.2 | 19 | 23.640 | -79.11 | -125.9937 | 999.9997 | -999.993 |
| 54 | 249 | 6.1 | 18.2 | 16 | 34.43 | -112.65 | -139.23 | 999.962 | -1000 |
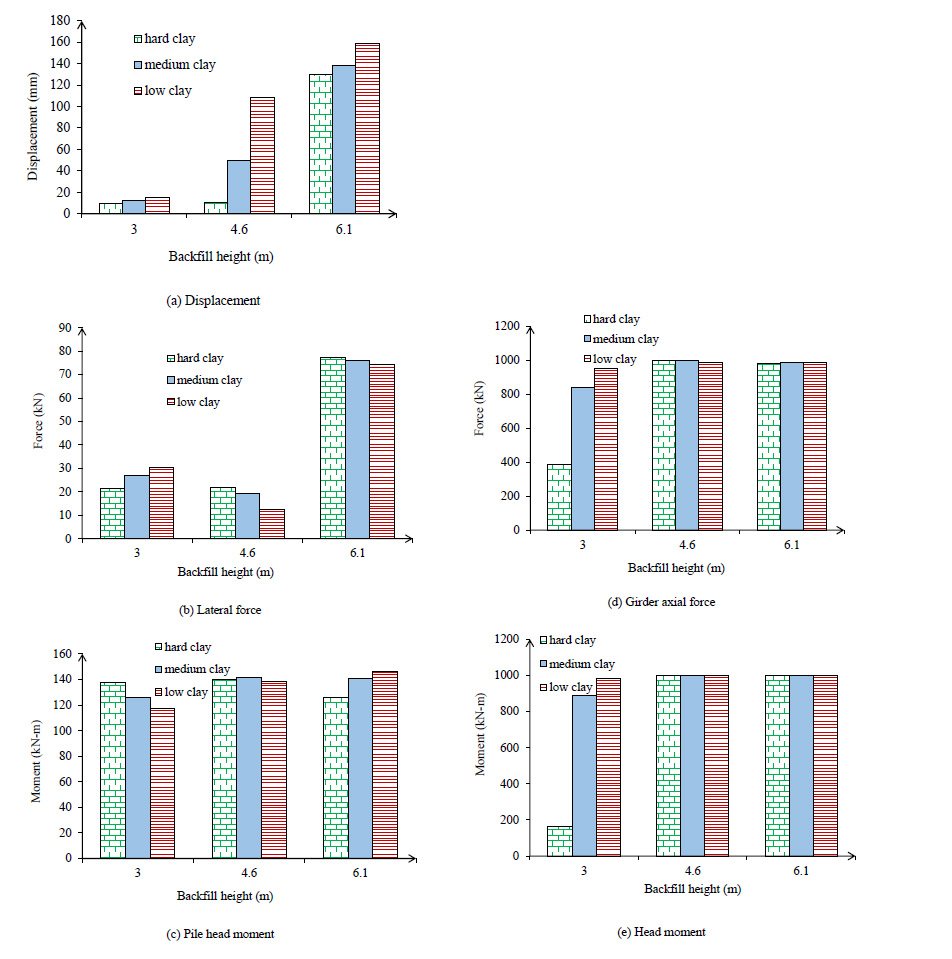
3.2.1. Prediction of Critical Response for Backfill Height
As shown in Fig. (12a), by changing the height of the abutment with the company span of the bridge, structural stiffness increased, but this factor is not related to the lateral displacement. For 123.6 m span when the backwall height is 3.0 m subjected to ground motions, the maximum lateral displacement in the longitudinal direction is found to be 12.78 mm for the case where stiffness soil around the pile is hard. However, for backwall heights 4.6 and 6.1 m and using the same ground motions and including the soil pile interaction behavior in structural models, lateral force is predicted as 8.16 and 139.99 mm respectively. The pile lateral force for 123.6 m span was predicted for 3.0 m height of backfill 21.27 kN, for 4.5 m is 21.63 kN and for 6.1is 77.23 kN. Pile head moment for 123.6 m span is illustrated in Fig. (12b). In this figure, changing backwall height from short to tall makes no meaningful change in the bending moment value. The pile head moment for 123.6 m and 3.0 m height with hard density soil around pile forecast is 15 kN-m. The girder axial force for 123.6 m span and hard clay around the pile is 384.18 kN. This comparison is between 123.6 m span and parametric study cases with 18.3, 34.3 and 65.4m spans. With the comparison between ANN results and time history analyses in the parametric study, backfill height influences abutment head moment. An increase of backfill height decreases abutment head moment and the moment decrease between 3.0 m and 6.1 m was 85 kN-m in 123.6 m span.
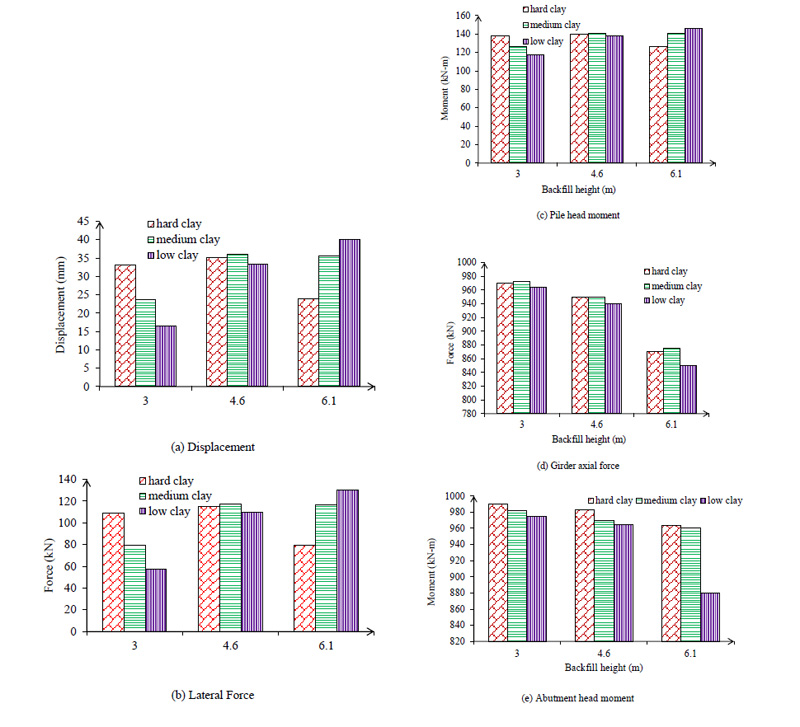
The pile lateral displacement predicted for 249 m span and 3.0 m height of backfill is 33.20 mm, for 4.5 m is 35.12 mm and for 6.1 is 23.81 mm. In 249 m length similar to 123.6 m height of abutment is not related to lateral force. For 249 m spans as shown in Fig. (13a) when backwall height is 3.0 m subjected to ground motions, the maximum lateral force in a longitudinal direction obtained is 108.84 kN for the case where stiffness soil around pile is hard. However, for backwall heights 4.6 and 6.1 m and using the same ground motions and including the soil pile interaction behavior in structural models, lateral force is predicted at 114.77 and 79.64 kN respectively. Prediction of pile bending moment for 249 m span showed no relation between pile head moment and backfill height. The pile moment for 3.0 m height with hard density soil around pile is 137.71 kN-m Fig. (13b). The girder axial force predicted for 249 m span and hard clay around pile is 999.97 kN. This comparison is between 249 m span and parametric study cases with 18.3, 34.3 and 65.4m spans. The maximum girder axial force reduction between 6.1 m and 3.0 m was -152 kN (see Fig. 13(c)). With a comparison between ANN results and time history analysis in the parametric study, backfill height influences abutment head moment as shown in Fig. (13d). An increase in backfill height decreases the bending moment at the abutment and the bending moment decrease between 3.0 m and 6.1 m predicted 114.02 kN-m in 249 m span.
3.2.2. Prediction of Critical Response for Backfill Stiffness
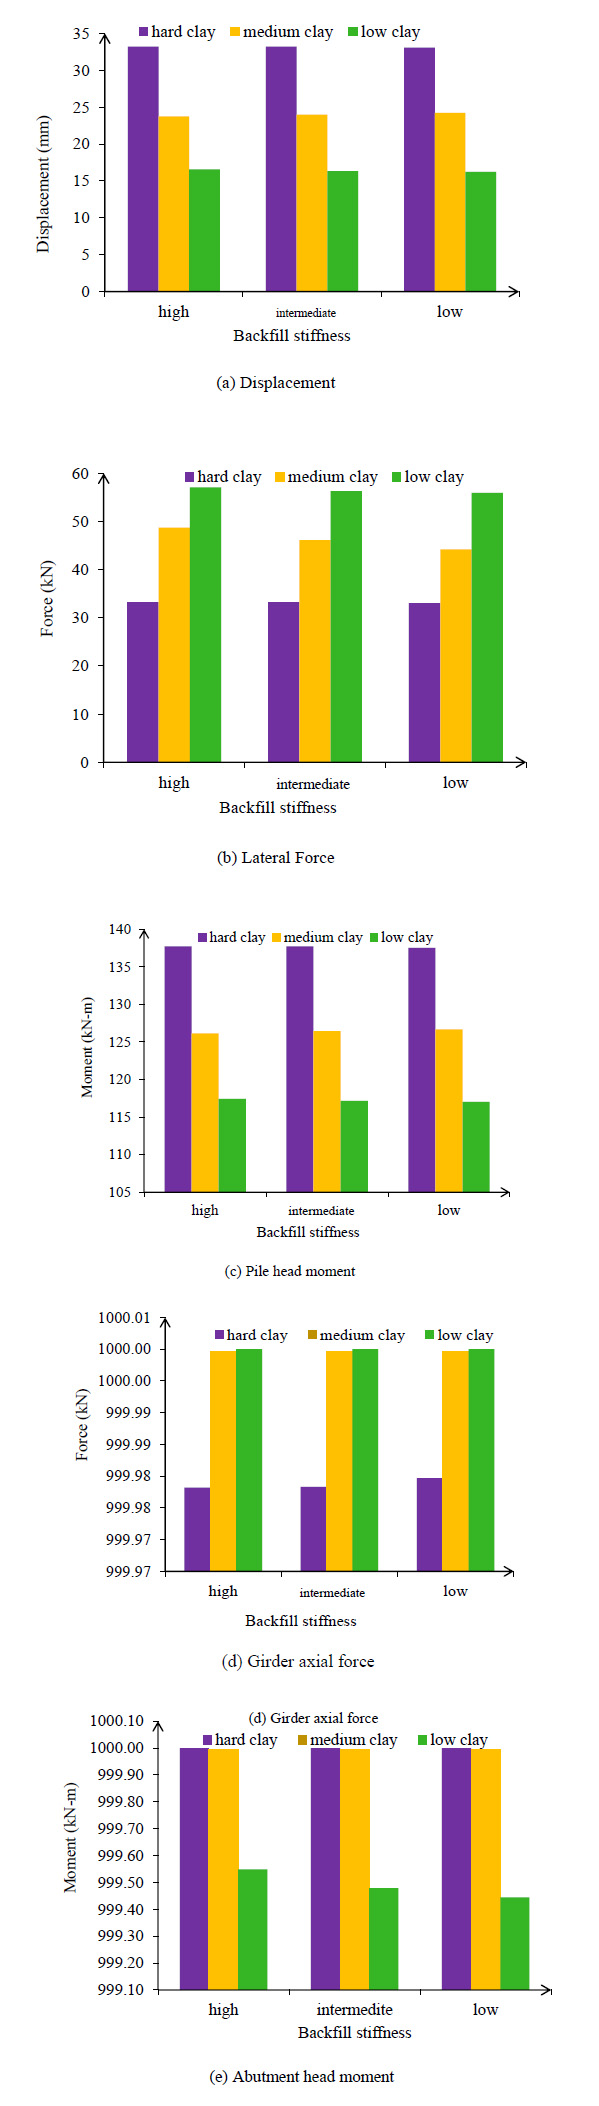
For 123.6 m span, lateral displacement, lateral force, bending moment and abutment moment are shown in Fig. (14). The pile lateral force change between low and high stiffness was 3.94 kN. Backfill stiffness has a low influence on pile lateral force at the pile head. The pile head moment change between low and high stiffness was predicted at 1.16 kN-m. The girder axial force forecasted with low stiffness backfill and low clay around the pile was 800 kN. The girder axial force predicted by ANN for 123.6 m was 910 kN (Fig. 14d). As mentioned earlier, backfill stiffness does not influence abutment head moment which (Fig. 14e) confirms. Girder bending moment forecasted for low stiffness backfill with low clay around pile was 880.23 kN-m.
For 249 m span prediction of lateral displacement, lateral force, bending moment and abutment moment are shown in Fig. (15). As predicted by ANN and depicted in (Fig. 15a), backfill stiffness has an influence on pile lateral force. The pile lateral force predicted with high clay stiffness around the pile and high compacted backfill was 33.82 kN. Also, backfill stiffness has a high influence on pile lateral force at the pile head (Fig. 15b). As shown in Fig. (15d) the girder axial force forecasted between low and high was 73.95 kN. Girder moment forecast with high stiffness around pile was 1000 kN-m for 249 m length (Fig. 15e).
3.2.3. Prediction of Critical Response for Soil Stiffness Variable
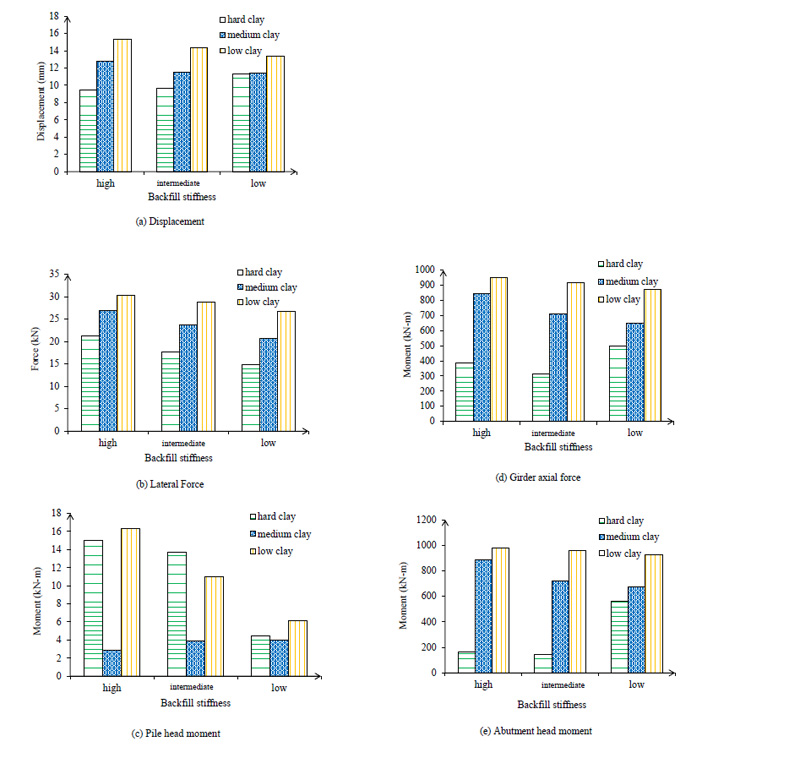
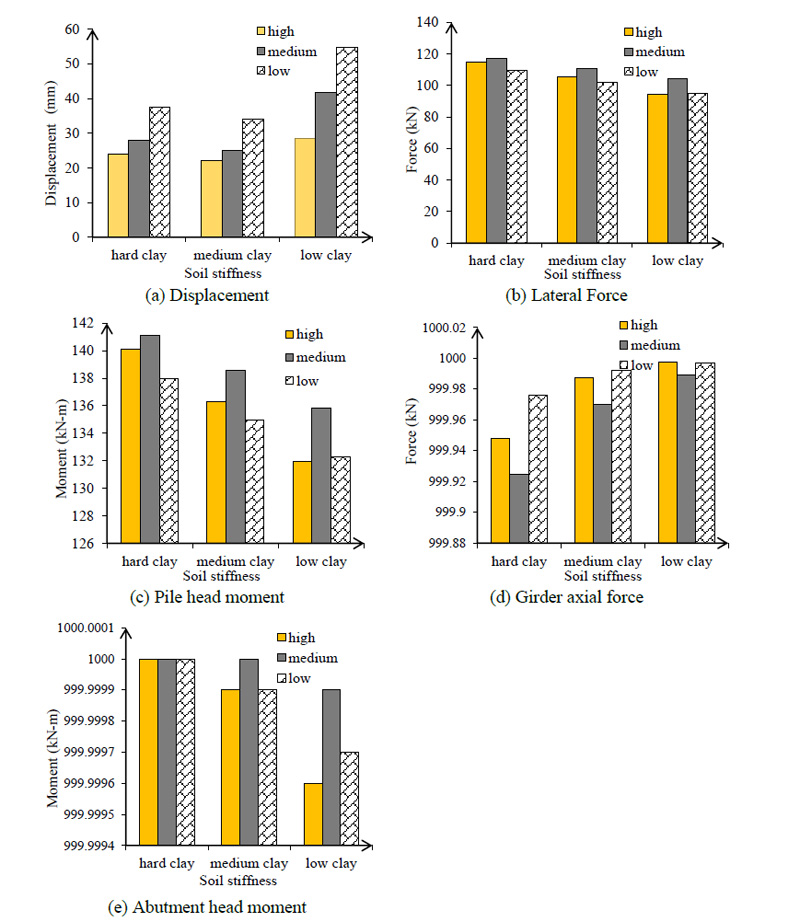
The effect of soil stiffness around pile on the critical response of bridge after ANN analysis, 4.6 m backfill height was selected for IAB (Figs. 16 and 17). The results show that soil stiffness around piles reduces pile lateral displacement. The absolute lateral force prediction for low clay backfill around the pile was 58.07 kN (Fig. 16b). The pile head moment increase between low and high stiffness was 160.23 kN-m for 123.6 m length (Fig. 16c). The maximum pile lateral force addition with high clay stiffness was 118 kN (Fig. 17c) and the pile head moment increase between low and high stiffness was 9 kN-m for 249 m length (Fig. 17c). As shown in Fig. (17d) the maximum girder axial force predicted by ANN was 999.92 kN. Finally, the bending moment predicted between low and high clay stiffness was 1000 kN-m.
CONCLUSION
It is necessary to have a prediction model for IAB responses under seismic loads that can be extended to other situations. This research utilized ANN method to predict critical responses to find a relation between nonlinear variables in the parametric study. A model was formulized for a pile that has been implemented in the bridge in order to verify FE used in this study. Although the seismic response of the bridge system considered is inherently a 3D problem, in the first analysis step, a 2D representation of the foundation soil was used by assuming plane strain conditions. For a more complete and quantitatively more accurate analysis, a 3D model is clearly needed. Afterward, p-y curves of the pile in various heights below the ground were measured. This verification experiment has been thoroughly done in accordance with experimental results and has provided positive expected results. The key components of the numerical model included soil pile interaction, abutment backfill interaction, and construction joints. The use of ANN critical IAB responses has been investigated for pile lateral force, pile displacement, pile head moment, girder axial force, and abutment moment. Based on the analytical results several conclusions were drawn:
- Densely compacted backfilling behind the abutments is generally recommended, since it reduced the pile deflection, the abutment displacement, the girder moments, and particularly the pile moment.
- An increase in soil stiffness around piles increases bridge bending moment, pile lateral force, and pile moment and reduces pile head displacement.
- Dynamic loads (i.e., earthquake), and relative displacement plays a significant role in the response of this particular bridge. In other words, designers should consider the structural response in piles under dynamic loadings.
- The longitudinal earthquake creates big moments in the superstructure thus the stiffness of the superstructure should be controlled by the designer.
LIST OF ABBREVIATIONS
| 2D | = Two-dimensional |
| IAB | = Integral Abutment Bridge |
| FE | = Finite Element |
| ANN | = Artificial Neural Network |
| SSIs | = Soil Structure Interactions |
CONSENT FOR PUBLICATION
Not applicable.
AVAILABILITY OF DATA AND MATERIALS
Not applicable.
FUNDING
This research received no specific grant from any funding agency in the public, commercial, or not-for-profit sectors.
CONFLICT OF INTEREST
The authors declare that they have no competing interests.
ACKNOWLEDGEMENTS
Declared none.

