All published articles of this journal are available on ScienceDirect.

Shear Buckling Analysis of Corrugated Web Steel Plate Girder with Random Material Properties
Authors Info & Affiliations
Abstract
Background:
The non-linear finite element method with initial geometric imperfection is compulsory to capture the shear buckling behavior of the Corrugated Web Steel Plate Girder (CWSPG). These initial geometry imperfections can come from the slender structure that cannot maintain its perfect shape or lousy quality during the assembly process. Most researchers generate the initial geometry imperfection from the elastic buckling modes that may not represent the randomness in the geometric imperfection. Therefore, there is a need to develop a method to generate random initial geometry imperfection without carrying out elastic buckling modes from the analysis.
Objectives:
This paper investigated the shear buckling behavior of CWSPG using non-linear finite element analysis and proposed a method to generate the initial geometric imperfection using the random material imperfection.
Methods:
The random material properties for each meshed element follow a statistically random normal distribution of the material yield strength. The initial geometric imperfection is generated from the first second-order analysis with random material properties (using the in-house 3D-NLFEA package) to the point where the expected buckling shape is obtained. The final deformed geometry from the first second-order analysis is then scaled down to be used as the initial geometric imperfection.
Results:
The proposed method requires the scaling value such that the first buckling load from the available experimental test result and the one from the numerical model are at the same level. The proposed method was able to capture the shear buckling behavior of the CWSPG and was sensitive to the element’s size. The minimum size of the element required normalized with the element thickness was found to be less than four to maintain the accuracy for both the peak and residual load of the CWSPG specimen.
Conclusion:
The proposed method shows excellent agreement in predicting the peak load and the post-buckling behavior of the available test results. Therefore, the proposed method can be used as an alternative method to capture the buckling load of the CWSPG specimen.
1. INTRODUCTION
The use of Corrugated Web Steel Plate Girder (CWSPG) in bridge constructions can reduce the girder weight, eliminate the use of transverse stiffener, and give a better architectural impression. The web plate of the CWSPG only carries pure shear forces, and due to geometry advantages, the web configurations also provide better shear resistance against local buckling and thus increase the girder shear strength capacity. Up to date, there are plenty of experimental tests available in the literature for the CWSPG girder along with the existing theoretical formulations to predict the shear strength of the CWSPG. On the other hand, three-dimensional non-linear finite element analysis (FEA) has also been used to predict the shear strength of CWSPG. However, the use of FEA requires the initial geometric imperfection to be determined where it can significantly affect the first peak buckling load prediction of the CWSPG buckling shear strength [1]. Therefore, more research on how non-linear FEA is effectively and accurately used should be carried out.
Usually, in non-linear buckling analysis, only geometric imperfection is considered. This geometric imperfection is acquired from the elastic buckling analysis (using the perfect shape of the girder), which may consist of several buckling modes. The selected buckling modes (one or more combined) are then scaled down to the maximum measured deformation of the unloaded girder and are used as the initial geometric imperfection. However, the initial geometric imperfection shape may not well match the tested specimen.
During the assembly process, several causes can trigger the formation of the initial geometric imperfection. Some of these causes are the web plate thickness and the unrestrained length of the web plate. The smaller the web plate thickness, the higher the geometric imperfection. The same goes for the unrestrained length of the web plate, when it becomes longer, the slenderness of the web increases and can also lead to larger geometric imperfection. On the other hand, bad workmanship during the assembly process can also cause a localized geometric imperfection. For example, when the welding process is not done correctly, localized geometry imperfection and non-uniform formation of residual stresses can be formed [2-4]. Hence, it is important to highlight the presence of stress-related imperfection in the numerical model.
In this paper, a unique approach to estimating the initial geometric imperfection is presented. The initial geometric imperfection is obtained from the 2nd order non-linear analysis with random material properties. This random material imperfection sets different material properties for each solid element. The distribution of random material properties follows a statistically normal distribution. The purpose of using random material properties is to break the structural symmetry. It will be shown later that the use of random material properties to generate the initial geometric imperfection can also be used to predict the buckling capacity of the CWSPG.
2. LITERATURE REVIEW
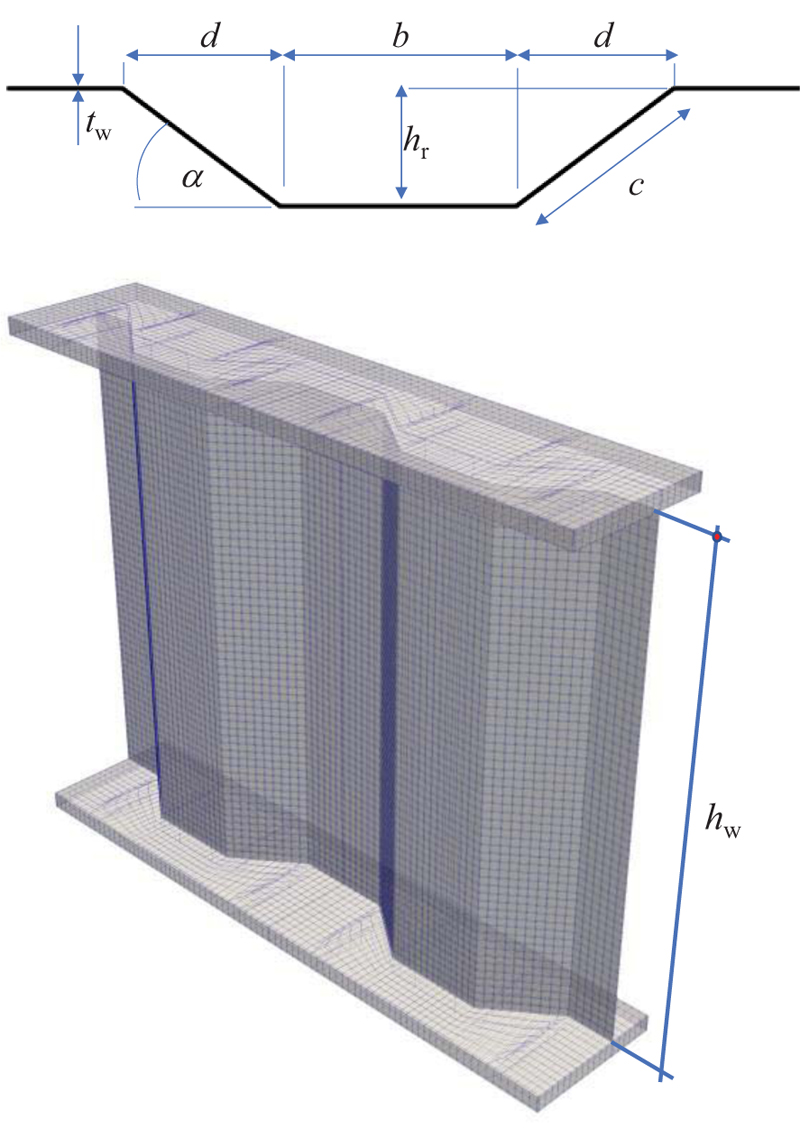
The literature review section is divided into two sub-sections: the existing shear strength formulation of the CWSPG and the existing numerical simulation used to predict the buckling strength of the CWSPG. Before further discussion in the literature review, it is important to maintain the same framework of the CWSPG that is being discussed. Fig. (1) shows the shape and configuration of a typical trapezoidal CWSPG, which is being investigated in this paper. As shown in Fig. (1), the web panel consisted of horizontal and inclined panels. In Fig. (1) is the longitudinal fold width, c is the diagonal fold width, hr is the corrugation depth, α is the corrugation angle, tw is the web thickness, and hw is the web height.
2.1. The Shear Strength of The Corrugated Web Girders
The shear strength of the corrugated girders is affected by the buckling modes of the web plate in the girder. Local and global shear buckling modes further govern these buckling modes. The global buckling modes often require more than one-fold to buckle and are extended diagonally over the height of the web. On the other hand, local buckling modes only involve one-fold that buckled. However, as the load continues, the buckled shape can propagate and yield multiple buckled modes. When both local and global buckling modes interact with each other, this buckling mode is called the interactive buckling mode. Sause and Braxtan [5] noted that the parameter that controls both the local and global buckling modes are the slenderness of the individual web and the slenderness of the overall web girder, respectively. Further, Sause and Braxtan [5] also noted that the full capacity of the local shear buckling strength can be utilized by ensuring the angle of the inclination fold is higher than 30° [6].
The formulations to predict the shear strength of corrugated web girders, which incorporates the three possibilities of buckling modes, are also well established. Sause and Braxtan [5] provide a deep investigation of the existing formulation to predict the shear strength of the CWSPG. The proposed shear strength formulation proposed by Sause and Braxtan [5] was calibrated using the test results from Elgaaly et al. [7], Lindner and Aschinger [6], Peil [8], Gil et al. [9], Driver et al. [1] and Moon et al. [10].
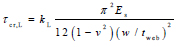
The elastic local buckling stress (τcr,L) can be estimated using the plate stability theory (see Driver et al. [1], Yi et al. [11], Sause and Braxtan [5]) and is:
 |
(1) |
where kL is the local shear buckling coefficient, Es is the Young’s modulus of the steel material, w is the maximum fold width (maximum value of b and c), v is the Poisson’s ratio of steel material, and tweb is the thickness of the corrugation web plate. The boundary conditions and the fold aspect ratio affect the local shear buckling coefficient (kL). For a simply supported edge, the value for kL can be taken equal to 5.34, while for fixed edges, the value for kL can be taken as 8.98.
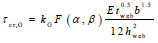
The global buckling stress (τcr,G) for the CWSPG can be predicted by:
 |
(2) |
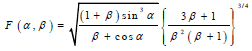
in the above, b is the longitudinal fold width, hweb is the web height, kG is the global buckling coefficient, and F(α,β) is the coefficient, which is the function of the web corrugation geometry. The expression for F(α,β) is:
 |
(3) |
where α is the corrugation angle and β is the ratio of b to c. The value for kG varies between researchers. Elgaaly et al. [7] use the value between 31.6 to 59, while Easley [12] uses the value between 36 to 68.4. The lower limit of kG is attributed to the web simply supported by the flanges, while the upper limit of kG is attributed to the web's fixed support conditions.
The interactive buckling mode formulation (τcr,L+G) follows the proposed equation from Sause and Braxtan [5] due to its conservativeness and is:
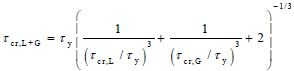 |
(4) |
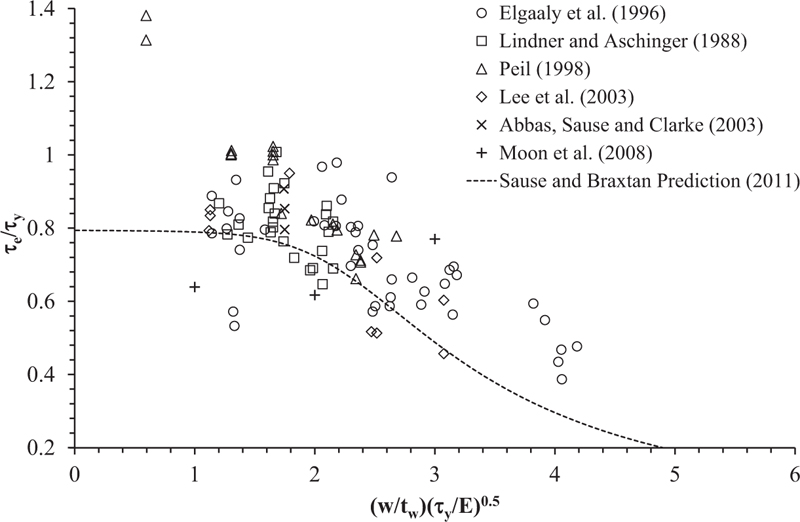
in Eq. (4), τy is the pure yield strength of the web. (Fig. 2) shows the normalized predicted shear strength of the CWSPG using Eq.(4) and is plotted together with the available test results in the literature [6-8, 10, 13, 14]. In Fig. (2), Eq.4 was plotted with a dashed line. (Fig. 2) shows that the shear strength prediction using Eq.(4) (dashed line) was conservative and only considered eighty percent of its yield strength. The scatter in the test data is related to the imperfections, which may vary between the specimens. Although some tests from [6, 7, 10] were found below the line, the majority of the test result was higher than the shear strength prediction using Eq.(4) (dashed line).
2.2. Previous Numerical Study using Nonlinear Finite Element Analysis
This section highlights the previous numerical simulation to predict the shear strength of the CWSPG girder. This section’s discussion aims to show the methods using finite element analysis to predict the shear strength of the CWSPG, including the imperfection method to initiate its buckling behavior.
Driver et al. [1] use ABAQUS finite element package to predict the shear strength of CWSPG. A thin shell element with reduced integration was used in the modeling. Both elastic Eigen-based buckling analyses and non-linear buckling analyses were carried out. Driver et al. use the scaled deformation obtained from linear buckling modes as the initial geometric imperfections. Up to a hundred percent of the web thickness scaled deformation of the lowest buckling modes were investigated. From Driver’s study, the shear strength was greatly affected by the initial geometric imperfections.
The previous study has investigated that the prediction of the shear capacity of the CWSPG using a classical plate buckling theory overestimates the shear strength capacity of the tested CWSPG specimen [1]. To verify the test results numerically, Driver’s and coworkers also investigate the shear strength of CWSPG using finite element analyses (FEA). The study found that the shear buckling mode was sensitive to the given initial geometry imperfection.
Elgaaly et al. [7] used ABAQUS with the eight-node thin-shell element (S8R5) for the corrugated web plate and three-node Timoshenko beam element to model the flanges and the stiffeners. The bilinear elastic-perfectly plastic model was used for the steel material constitutive model. Both local and global buckling modes are generated to create the initial imperfections. Four mesh size of the web plate was examined, and it can be concluded that as the mesh size becomes smaller, the failure load becomes asymptotic. Furthermore, Elgaaly et al. [7] also studied the effect of the imperfection magnitude on the prediction of the failure load. As the imperfection increased, the first peak buckling load capacity decreased.
Yi et al. [11] used ABAQUS with the eight-node thin shell element integrated using reduced integration to model only the portion of the corrugated web plates. Only four elements per panel were used in the simulation. Yi et al. [11] used the same method as Driver et al. [1] to generate the initial geometry imperfection. Unfortunately, there is no information given for the initial geometry imperfection amplitude.
Eldib [15] used ANSYS with a thin shell element (shell 63) to simulate the corrugated web panels with end stiffeners. The mesh size is set to six elements per panel. The connection between the corrugated web, the flange, and the stiffener was set to hinge to gain lower shear strength of the corrugated web girder. This study mentioned that flanges and stiffeners only have a little effect on the shear buckling strength.
Hassanein and Kharoob [16] studied the shear strength of CWSPG using ABAQUS with an S8R5 shell element. The joint behavior at the juncture between the web and flanges is modeled based on the previous investigation [17]. The initial geometric imperfection was generated using the linear superposition of the selected buckling eigenmodes. The modified RIKS [18] arc-length method in ABAQUS can be used to handle the snap-back behavior. The steel material was modeled using elastic-plastic material for steel with linear hardening variables. There is no information on the initial imperfection amplitude used in the model.
Aggarwal et al. [19] did numerical studies using ABAQUS with the main objective of determining the local shear buckling coefficient (kL). A thin shell element (S4R and S8R) was used. The initial geometric imperfection was initiated based on the first eigen buckling mode. To avoid mesh distortion at the web-flange boundary, individual mesh for each web and flange was executed. TIE master-slave constraint was then used to interact with the not-connected nodes between the web and the flange.
From the numerical studies discussed in this section, the authors conclude some important points as follows:
- Initial geometric imperfection was mandatory to initiate the buckling shape of the CWSPG girder [1, 7, 11, 15-17, 19].
- Initial geometric imperfection can be prepared by scaling the amplitude of the selected buckling modes obtained from the elastic eigen buckling analysis. If more than one buckling mode were used, the superposition method could be used [1].
- The predicted shear strength of the CWSPG with the same configurations was affected by the elements' size, the initial geometric imperfection deformed shape, and the amplitudes [1, 7].
- The behavior at the junction between the web and the flanges can also affect the predicted shear strength of the CWSPG [16, 17].
3. METHODOLOGY
3.1. Three-Dimensional Non-Linear Finite Element Analysis (3D-NLFEA) Package
This section shortly describes the non-linear finite element package used in this paper. The Three-Dimensional Non-Linear Finite Element Analysis (3D-NLFEA) package is a high-performance computer program developed by the first and the third authors mainly to study the confinement effect and localization in concrete material [20, 21]. For this research, the authors extended the 3D-NLFEA capabilities to be able to do random material, initial geometric imperfections, and 2nd order analysis.
3D-NLFEA uses SALOME 9.2.0 and ParaView 9.5.0 for the pre- and post-processor phases, respectively. 3D-NLFEA has a couple of features that are used in this research. Instead of using a full tangent stiffness matrix, a Tangent Stiffness Like Projection Method (TSLPM, Piscesa [22]) is used. The TSLPM method projects the final displacement increment from the previous step as the initial increment in the current step. During the sub-step iteration, the elastic stiffness matrix with Process Modification [23] is used to satisfy the force equilibrium.
3D-NLFEA uses the eight-noded solid hexahedral element with the BBar [24] element formulation. The numerical integration of the element stiffness matrix in the BBar element formulation is based on selective integration, where a reduced integration is used for the hydrostatic part, and full integration is used for the deviatoric part of the B-matrix. Although it is not discussed in the paper, the authors have investigated the standard eight-node hexahedral formulation to capture the non-linear buckling problems for the CWSPG girder, which resulted in a stiffer response after the buckling load is reached.
3.2. Second-Order Analysis in 3D-NLFEA
This section described how imperfections of the 2nd order analysis and random material properties are used in the 3D-NLFEA software package. The 2nd order analysis in 3D-NLFEA works by always updating the geometric nodal coordinate for each sub-step iteration to satisfy the global force equilibrium. When the force error in the non-linear iterations is within the acceptable tolerance limit, the final geometric coordinate for the current step will coincide with the final displacement plus the geometric coordinate obtained from the previous load step. It should be noted that when the steel web plate is buckled and undergoes large deformation, no body contact detection algorithm is used.
3.3. Random Material Properties Imperfection
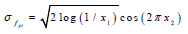
Basiński and Kowal [25] noted that the random variation in the material strength plays an important role related to the web shear resistance of many existing studies on the corrugated web plate girder [7, 12, 26]. This random material imperfection will break the symmetry of the structural model such that the asymmetric pattern of the buckling mode can be obtained. For that purpose, the random material properties imperfection is prepared for each discretized element in the model. Therefore, each element in the model will have a slightly different material strength. However, for simplicity, each gauss point within an element shares the same material strength. To generate the random material properties, an algorithm that deploys the Box-Muller transform method [27], a pseudo-random number sampling method specially written to generate independent, standard, and normally distributed pairs, is used. The expression of the Box-Muller transform method for the random generation of the yield strength is as follows:
 |
(5) |
 |
(6) |
 |
(7) |
where fyi is the yield stress for each ith meshed element, fym is the mean yield stress, σfy is the standard deviation around the mean yield stress, and x1 and x2 are the generated random number which varies from zero to unity. It should be noted that the mean yield stress is not the same as the characteristic yield strength (fy) of the material. The mean yield strength can be computed as [28]:
 |
(8) |
where a is the standard deviation multiplier that reflects the material probability of failure, σfy is the standard deviation of the material, and Ωfy is the material coefficient of variation. By taking the material probability of failure equal to 5%, the constant value for a is 1.64.
The same approach can also be used for Young’s modulus of the steel material by replacing the yield strength notation with the material elastic modulus. Although it is more reasonable to have this input data obtained from many test results of the material, for simplicity and testing of the proposed method, the variation of the material properties is set to 2% for all the modeled specimens.
3.4. Detailed Sequence of The Proposed Method
To predict the buckling load using the proposed method, two steps are required. The first step is to find the corresponding initial geometric imperfection using the 2nd order analysis and the random material properties imperfection. In most cases, before the buckling shape was obtained, the load-deflection curve always coincided with the load where the shear stress of the web reaches its yield limit, and after that, a sudden drop in the load-carrying capacity occurred. Once the sudden drop in load carrying capacity occurs, any points after that point can be used as the initial geometric imperfections. Using the deformed shape at the point where the displacement is three times the yield displacement as the initial geometric imperfection is advisable.
In the second step, the initial geometric imperfection is then scaled down with respect to the web thickness. The scaled magnitude can be described as the ratio of the amplitude of the initial geometric imperfection to the web thickness. The scale itself plays a very important role in predicting the buckling loads of the CWSPG girder. A trial-and-error method with various imperfection scales should be carried out to get the correct result. It should be noted that many researchers have investigated this magnitude scale for imperfection. However, it cannot be generalized for all CWSPG specimens because many factors affect the scale magnitude for the imperfection, such as the element type and the mesh sizes.
3.5. Modelling of Corrugated Web Steel Plate Girder in 3D-NLFEA
3D-NLFEA uses SALOME 9.3.0 [29] for the pre-processor phase. In SALOME 9.3.0, groups for the element and boundary conditions (nodes) are created. The groups are then exported to Microsoft Excel files to apply geometric and material imperfections for further process. Once the boundary conditions and the imperfections are applied, 3D-NLFEA then reads the input data to execute the non-linear finite element analysis, which incorporates both geometric and material nonlinearities.
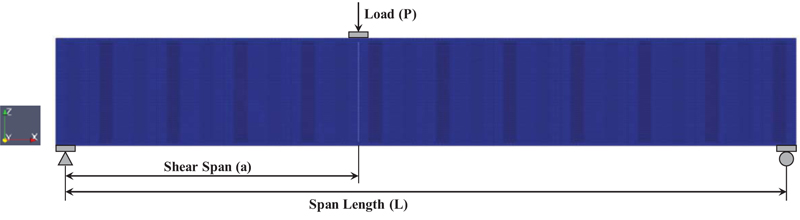
There are four CWSPG specimens taken from the literature modeled in this paper. One specimen from Driver et al. [1] (specimen G7A/G8A), one specimen from Moon et al. [10] (specimen MI2), and two specimens from Nie et al. [30] (specimen S2-2 and S2-3). Fig. (3) shows the typical simply supported CWSPG beam model with a point load applied at the distance of shear span (a) from the left-hand side. Plate stiffeners are used to avoid local buckling at the supports and at the point load location. These plate stiffeners are also necessary to ensure the load is uniformly distributed to the web plate of the girder.
Table 1 shows the geometry parameters of the selected specimens from the literature, which consisted of the basic geometry dimension of the CWSPG. Table 2 shows the geometry parameters for the trapezoidal corrugated web of the specimens. The steel material for specimen G7A/G8A was made of high-performance (HPS 485) grade steel with a mean yield strength of 465 MPa. Specimen MI2 had a steel yield strength of 296 MPa, which was obtained from the test results. Specimen S2-2 and S2-3 had the mean yield strength for the steel web plate equal to 385.5 MPa, while the mean ultimate strength for the steel web plate is 461.2 MPa.
| Specimen | Flange | Corrugated Web | Span Length | |||
|---|---|---|---|---|---|---|
| bf (mm) | tf (mm) | a (mm) | h (mm) | a/h | L (mm) | |
| G7A/G8A | 450 | 50 | 4500 | 1500 | 3.00 | 11000 |
| MI2 | 300 | 30 | 2800 | 2000 | 1.40 | 5200 |
| S2-2 | 200 | 20 | 1200 | 360 | 3.33 | 2850 |
| S2-3 | 200 | 25 | 1200 | 460 | 2.61 | 2850 |
| Specimen |
b (mm) |
d (mm) |
α (°) |
hr (mm) |
2b+2d (mm) |
tw (mm) |
|---|---|---|---|---|---|---|
| G7A/G8A | 300 | 200 | 36.9 | 150 | 1,000 | 6.00 |
| MI2 | 220 | 180 | 22.6 | 75 | 800 | 4.00 |
| S2-2 | 80 | 64 | 37.0 | 48 | 288 | 0.90 |
| S2-3 | 80 | 64 | 37.0 | 48 | 288 | 0.90 |
| Specimen | Nodes | Elements | Free DOF | Le/tw |
|---|---|---|---|---|
| G7A/G8A1* | 57,456 | 32,760 | 169,380 | 6.67 |
| G7A/G8A1+ | 122,470 | 61,502 | 359,870 | 4.17 |
| MI2 | 105,334 | 56,100 | 310,559 | 5.00 |
| S2-2 | 390,943 | 201,934 | 1,165,862 | 3.00 |
| S2-3* | 283,213 | 147,751 | 842,981 | 4.00 |
| S2-3+ | 487,698 | 251,819 | 1,454,189 | 3.00 |
Table 3 shows the number of nodes, elements, and Degree-Of-Freedoms (DOF) used to model the selected specimens. For specimen G7A/G8A and specimen S2-3, there are two different mesh sizes reported. Each mesh size corresponds to different ratios of element length to the element thickness (Le/t). The purpose of using different mesh sizes is to investigate the effect of mesh size on the behavior of the load-deflection curve when it softens. It is expected that as the element size becomes smaller, the residual strength of the modeled specimen also lowers. If the hypothesis about the residual strength was true and was affected by mesh size, a localization limiter [31-34] should be applied in the model to maintain similar results with different mesh sizes.
Based on the authors’ investigation, it was found that the ratio of Le/t should be less than equal to four to predict both the buckling loads and the post-buckling behavior correctly. It should be noted that the suggested value for Le/t is only valid for the eight-node hexahedral element with BBar element technology as investigated in this paper.
4. RESULTS AND DISCUSSION
4.1. The Initial Geometric Imperfection Analysis Results
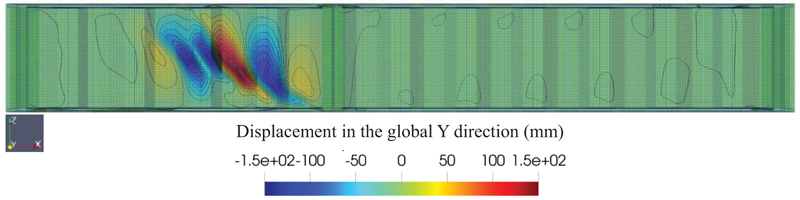
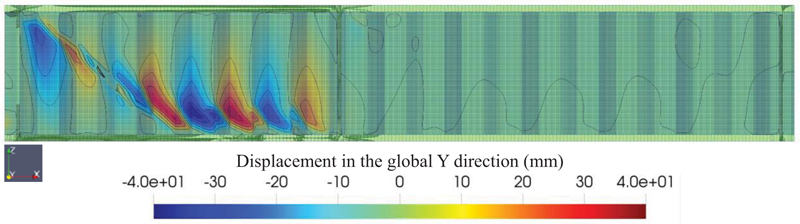
As discussed before, the proposed method utilized a two-step analysis. The first deals with the preparation of the initial imperfection, while the second one will do the 2nd order non-linear geometric analysis to capture the buckling load of the girder with given initial imperfections. Fig. (4) shows the typical initial imperfection obtained from the 1st second-order analysis with random imperfection for G7A/G8A+ specimen (with tiny mesh sizes). The web buckling initiated from the bottom flange and traveled to the next corrugated web. However, as observed in Fig. (4), it was found that the extension of the buckled shape did not extend to the top flange. The buckling shape was similar to the investigation with different mesh sizes, but the residual stress prediction differed. The specimen with a smaller mesh size has a lower residual load level. This will be discussed later.
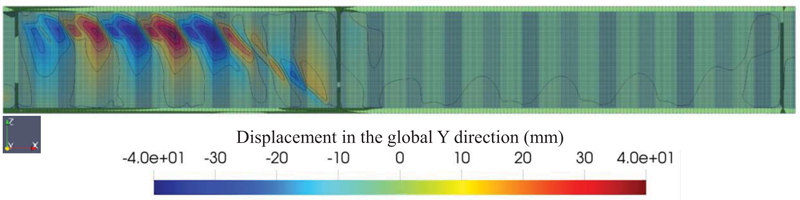
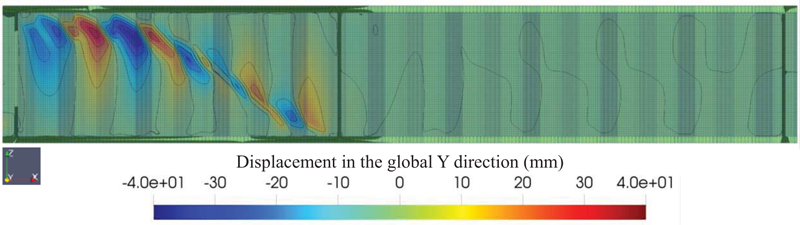
In contrast with the model specimen S2-2 (Fig. 5), the buckling in the web was initiated at the bottom flange and quickly extended beyond the multiple corrugation web towards the top flange. Furthermore, the web that buckled below the top flanges continues to propagate to the left support by having different outward-inward directions for each corrugation web. This finding was consistent with the buckled shape of the tested specimen. The same finding was observed for model specimen S2-3 (Fig. 6), meshed with a maximum mesh size of 3.6 mm. However, there are differences in the S2-2 model specimen. The propagation of the web buckling below the top flange had a longer buckling propagation extension compared to the S2-3 model specimen. This was caused by higher beam depth in the S2-3 model specimen compared to the S2-2 model specimen. Furthermore, the inclination angle of the diagonal buckling extension between the S2-2 and S2-3 specimens was not equal. The model specimen with S2-3, which has a higher beam depth, shows a lower inclination angle compared to the S2-2 model specimen.
Another interesting finding is that as the mesh size for specimen S2-3 was set to a smaller value (2.7 mm), the buckled shape changed, as shown in Fig. (7). In Fig. (7), the buckled shape initiated at the top left corner, propagating in the diagonal direction to the bottom flanges. Further, the buckling extends to the middle span. Different buckling shapes for model specimen S2-3 with different mesh sizes could be attributed to the random generation of the material properties. Therefore, it can be concluded that a different number of random generations may end up with different buckling shapes.
4.2. Buckling Load and Post-Buckling Behavior of CWSPG using The Proposed Method
The buckling load and the post-buckling behavior can be investigated using the 2nd order non-linear FEA with the initial geometric imperfection obtained from the previous step. The final deformed shapes of the selected specimen are shown in Fig. (8) (specimen G7A/G8A+), (Fig. 9) (specimen S2-2), (Fig. 10) (specimen S2-3*), and (Fig. 11) (specimen S2-3+). It can be seen from those figures that the final deformed shapes are similar to the initial geometric imperfection. It should be noted that in the second 2nd order non-linear analysis, the random material properties are also included in the analysis. A trial and error method for the amplitude value of the initial geometric imperfection was carried out to obtain the correct buckling load based on the available test data.
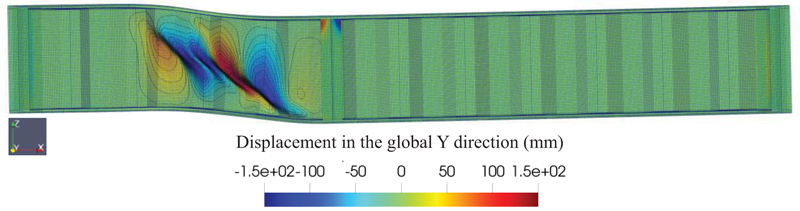
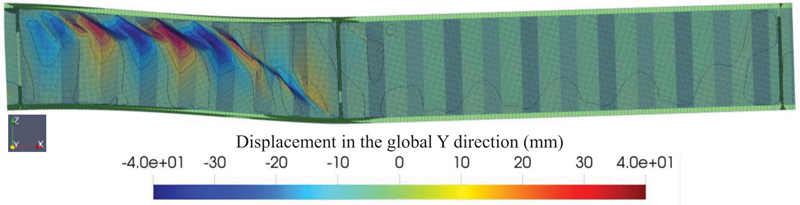
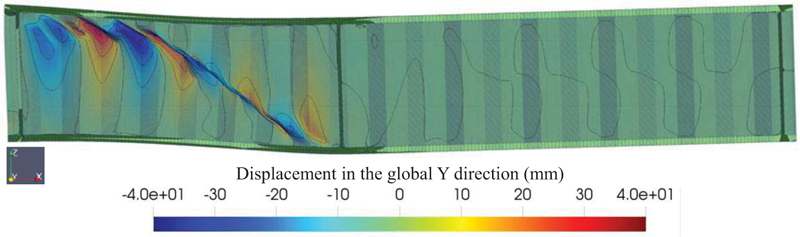
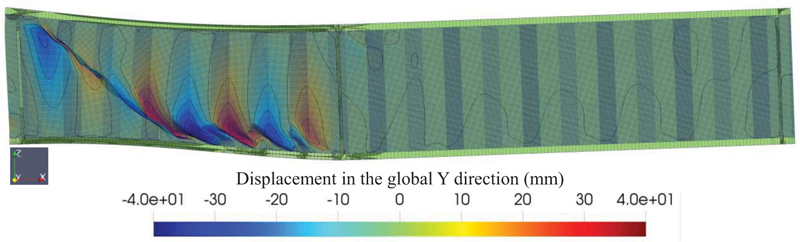
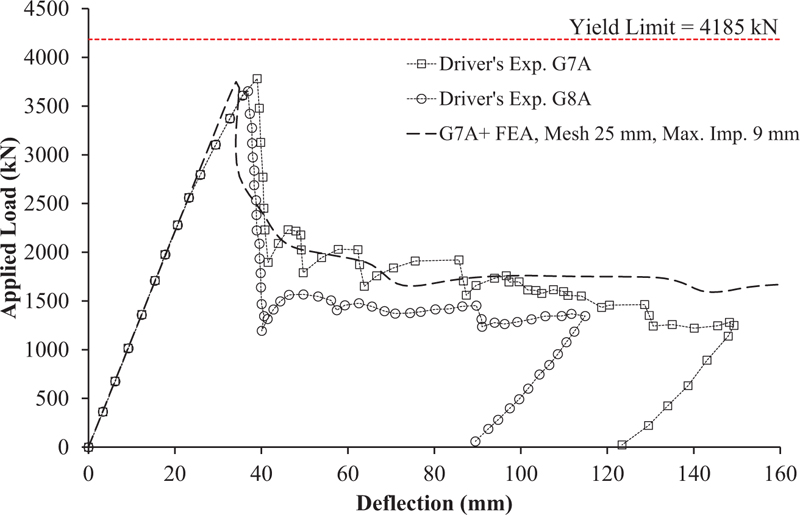
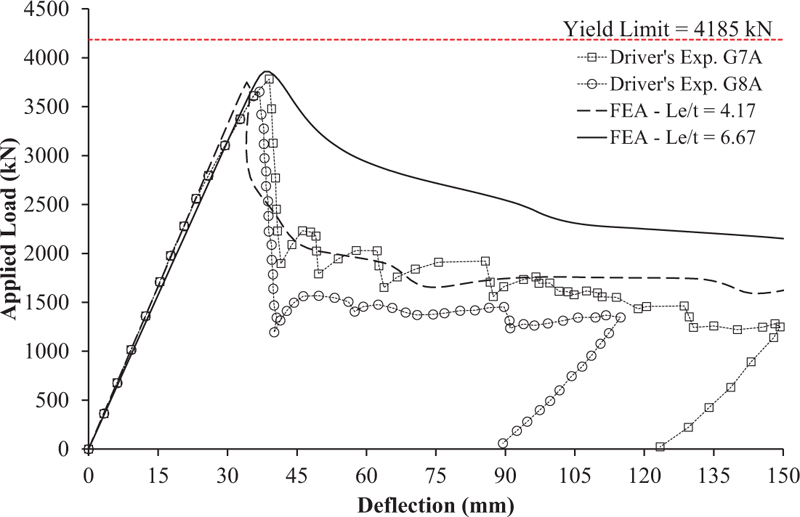
Fig. (12) shows the predicted response of the G7A/G8A specimen using the G7A/G8A+ model. As shown in Fig. (12), the initial stiffness of the model coincides with the test result. Once the buckling load was achieved, snap-back behavior was observed in the simulation, while in the experimental test, no snap-back behavior was observed. As the load continues, the load eventually reaches the residual stress. In the case of the G7A/G8A specimen, no strain hardening was observed in the test result and the model. The predicted peak load for specimen G7A/G8A is 3748.47 kN, while the peak load from the test result for G7A and G8A was 3781.57 kN and 3653.50 kN, respectively. The peak load difference between the model and the test result is -0.875% and +2.599% for G7A and G8A specimens, respectively.
Fig. (13) shows the load-deflection curve for specimen S2-2. To get the correct buckling load, the amplitude of the initial geometric imperfection was set to 5.5 mm. Unlike specimen G7A/G8A, there was no snap-back observed after the buckling load was reached. The post-buckling behavior shows softening behavior up to a point where the strain hardening in the load-deflection curve occurred with a small increase in the stiffness. The strain hardening behavior in the load-deflection curve was in line with both the test result and the numerical model. It should be noted that there exist some differences between the numerical and test results once the peak buckling load is reached. These differences can be caused by different imperfections between the model and the real specimen. It is nearly impossible to map real imperfection in the model. Hence, rather than focusing on the exact accuracy of the load-deflection curve once the buckling occurred, the author thinks it is wiser to have a model that can capture the general response of the post-buckling behavior, which was the presence of strain hardening in the load-deflection curve. The prediction of the numerical model can also be verified by looking at the buckling shape of the specimen. With the given maximum imperfection amplitude of 5.5 mm, the predicted peak buckling load from the simulation is 67.49 kN, while from the test result was 67.05 kN (the predicted peak load was +0.656% higher than the test result).
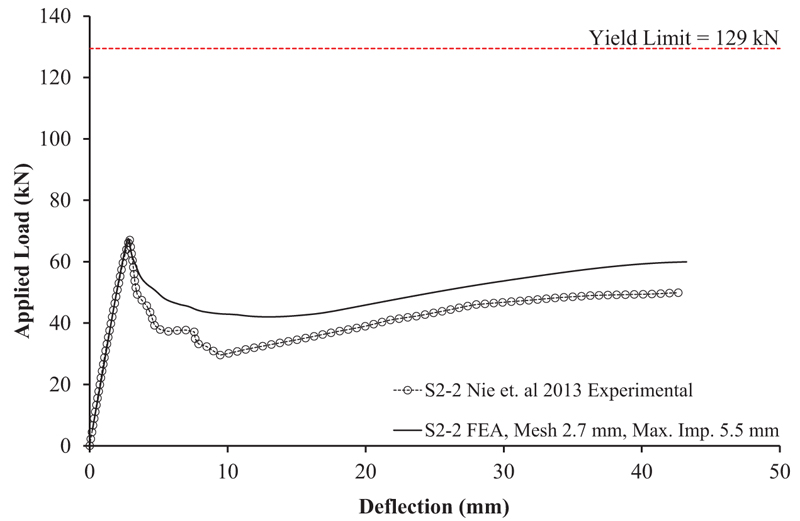
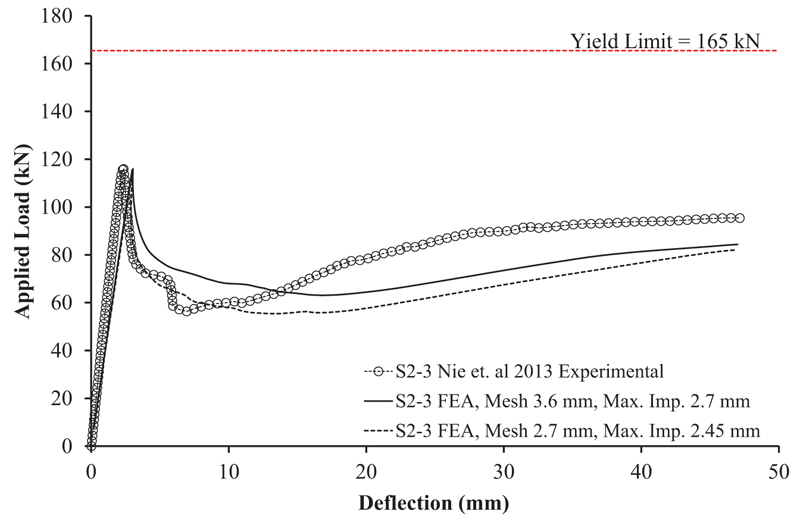
Fig. (14) shows the load-deflection curve of the experimental test for specimen S2-3 and the analysis results for both S2-3* and S2-3+ model specimens. For model specimen S2-3*, the amplitude of the initial geometric imperfection to capture the correct buckling load was set to 2.7 mm, while for model specimen S2-3+, the amplitude was set to 2.45 mm. As shown in Fig. (14), the response for both models (S2-3* and S2-3+) after the buckling load reaches is similar. The model S2-3+, which had a smaller mesh, gives a lower residual load than model S2-3*. Unlike the model for specimen S2-2, both models of S2-3* and S2-3+ showed a lower residual load than the test result. The predicted peak buckling load from the two simulations with different mesh sizes are 115.98 kN (mesh size 3.6 mm) and 114.79 kN (mesh size 2.7 mm). On the other hand, the peak buckling load from the test result was 115.94 kN. It was found that the model prediction was 0.035% higher (mesh size 3.6) and 0.991% lower (mesh size 2.7 mm) than the test result.
No snap-back behavior is observed in the analysis for S2-3*. On the other hand, snap-back behavior was encountered in the numerical model of S2-3+. Hence, it can be concluded that the snap-back behavior in the numerical model is affected by the element mesh size. After the lowest load is reached, a hardening response in the load-deflection curve is observed both in the test result and the numerical models. A similar hardening response was also observed in the S2-2 specimen.
4.3. Effect of The Corrugated Web Plate Element Aspect Ratio (Le/t)
It is well known that shell element is more appropriate when used to model a thin plate. However, it should be noted that most of the shell elements degenerate from solid hexahedral elements. Therefore, using solid elements to model a thin plate should pose no problem. During the research, the authors found that using elements with the ratio of the element length to the element thickness (element aspect ratio) resulted in a higher residual load. This can be understood by noting that the curvature of the buckled web plate cannot be maintained smoothly if a larger element is used. A larger aspect ratio can also deliver a stiffer response to the steel plate girder.
Fig. (15) shows the load-deflection curve of the G7A specimen modeled using 97,332 (G7A+) and 32,760 (G7A*) hexahedral elements. As shown in Fig. (15), the load-deflection response after the buckling load reached is higher for the G7A* model. No snap-back behavior is observed for G7A* model. On the other hand, the model of G7A+ compares well with test results, and snap-back behavior was observed. This significant difference can be caused by the selection of a large value of the element aspect ratio (Le/t) for specimen G7A*, which is 6.67. For comparisons, the significant effect on the load-deflection curve response between meshes can be said to be almost similar if the value of Le/t is lower than 4.0.
4.4. Effect of The Scaled Deformation Magnitude on The Buckling Load Capacity
The magnitude of the scaled deformation plays an important role in the buckling load capacity. If the scaled deformation magnitude is too small, the buckling load capacity may not be obtained. On the other hand, large-scale deformation magnitude may not represent the real geometry of the structures. For a corrugated steel web girder, there is no direct number for the scaled deformation magnitude. The best estimate can be taken from the measurement of the real tested specimen.
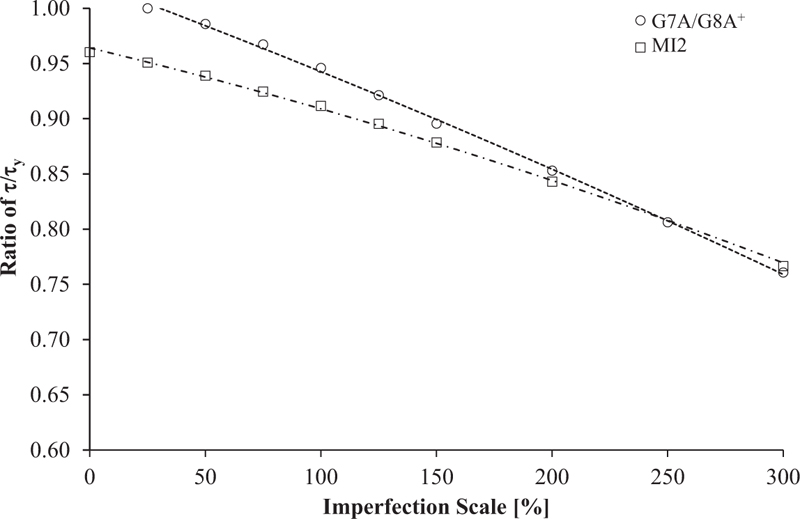
Fig. (16) shows the effect of the imperfection scale on the buckling load capacity normalized with the yield load of the corrugated steel web plate. For the zero-imperfection scale, the applied load is not always equal to the yield load. This can be seen in Fig. (16) for specimen MI2, where for the zero-imperfection scale, the applied load is only 96% of the yield load. This lower load can be attributed to a numerical precision error during computation.
Driver et al. [1] measured the web imperfection of a 1500 mm height CWSPG specimen with a 6 mm web thickness. It was found from the observation that the imperfection varies between folds, and the maximum imperfection reaches about 5.8 mm and is located approximately 300 mm from the bottom of the girder. The imperfection directions only formed a single curvature, and the center of the curvature is shifted away from the centroid of the girder.
The scaled deformation for specimen G7A/G8A in the model of G7A/G8A+ is 9 mm or equal to 150% of the web thickness to get a similar buckling load from the test result. Hence, it is difficult to estimate the proper magnitude of the scaled deformation. In addition, the deformed imperfection that occurred in the real specimen may vary depending on the quality of the fabrication. However, it is possible to generate many parametric studies along with the experimental test to propose an estimate of the imperfection scale in the numerical analysis. It is also worth mentioning that different types of elements used in the numerical simulation will also affect the value of the imperfection scale.
To match the predicted buckling load from the numerical model with Eq.(4), a similar method shown in Fig. (16) can be generated. Once the line equation is established, the required imperfection scale can be computed by equating the line equation from Fig. (16) with Eq.(4). Finally, with the obtained imperfection scale, an exact match of the peak buckling load from the numerical analysis with Eq.(4) can be obtained.
CONCLUSION
This paper presents an alternative way to predict the buckling load and post-buckling response of the CWSPG girder using the random material properties and the first 2nd order analysis as the initial geometric imperfection. By using the proposed method, the requirements of utilizing the enforced scaled deformation from more than two buckling modes as the initial geometric imperfection can be avoided.
There are two steps of analysis carried out in the proposed method. The first step consisted of the first 2nd order non-linear analysis with random material imperfection to be prepared as the initial geometric imperfection. The second step consisted of the 2nd order non-linear analysis with the initial geometric imperfection obtained from the scaled-down final deformed shape from the first step. In the second step, the random material imperfection and both geometric and material nonlinearities are included in the analysis. Please note that the final deformed shape in the first step is scaled down with a certain magnitude to match the first peak buckling load obtained in the second step. Hence, there are trial and error procedures to get the exact match of the first peak buckling load with the test result. In the absence of the available experimental test with a similar geometric configuration, the estimate of the first peak buckling load can be estimated using the expression proposed by Sause and Braxtan [5] or Eq.(4).
The numerical simulation observed that the scaled magnitude of the imperfection required to match the buckling load was affected by the mesh aspect ratio, which eventually is affected by the mesh size. For the hexahedral solid element with the BBar element technology used in this paper, the ideal mesh aspect ratio with respect to the thickness of the web (Le/t) is 4. It was also found that the post-buckling response is affected by the mesh size. The smaller the mesh size, the smaller the energy that the specimen can absorb. In extreme cases, snap-back behavior was observed.
After the lowest residual load was reached, a strain-hardening response was observed in the numerical analysis for some specimens. This can be attributed to the geometric properties of the specimen. Hence, further parametric studies with different geometric inputs can be investigated to get the root cause of the strain hardening response in the CWSPG specimen. In addition, more parametric studies are also required to get an expression for the estimated scaled deformation to be used as the initial geometric imperfection for the proposed method.
It should be noted that the work in the paper is at an initial stage and possible avenues of future research should be carried out. Some of the possible avenues of future work are 1) Further verification is required by considering spatial correlation in the random material properties; 2) Further studies on the effect of variation level should also be investigated in the future work; 3) The effect of different material assignment to the peak buckling load should be examined.
LIST OF ABBREVIATIONS
| CWSPG | = Corrugated Web Steel Plate Girder |
| FEA | = Finite Element Analysis |
AUTHORS' CONTRIBUTIONS
Conceptualization of the manuscript was prepared by H.K., B.P., and P.S.; H.K. and B.P. prepared the methodology; software development was prepared by B.P and F.F., and D.I.; H.K. and D.I. carried out validation with the available test result; H.K., B.P., and D.I. prepared the manuscript, F.F. prepared the visualization; P.S. provided supervision and re-reviewed the draft. All authors read and agreed to the published version of the manuscript.
CONSENT FOR PUBLICATION
Not applicable.
AVAILABLE OF DATA AND MATERIALS
Not applicable.
FUNDING
This research was funded by Direktorat Riset dan Pengabdian kepada Masyarakat (DRPM), Institut Teknologi Sepuluh Nopember, Surabaya, Indonesia. Research grant number: 1211/PKS/ITS/2018.
CONFLICTS OF INTEREST
The authors declare no conflict of interest, financial or otherwise.
ACKNOWLEDGEMENTS
Declared none.

