All published articles of this journal are available on ScienceDirect.
Effect of Inadequate Lap Splice Length on the Collapse Probability of Concrete wall Buildings in Malaysia
Abstract
Background:
In recent decades, Malaysia has shown a significant increase in the number of constructed high-rise buildings due to rapid urbanization and an increase in its population. However, due to the country's low seismicity, the majority of such tall buildings and infrastructures have not been designed against seismic actions. Therefore, they do not comply with the required seismic detailing and often suffer from inadequate lap splice length. After the 2015 Sabah earthquake that imposed significant damage to public buildings, the seismic vulnerability of buildings in Malaysia received increasing attention. As a result, researchers have tried to quantify the seismic vulnerability of buildings in Malaysia through the development of fragility curves.
Objectives:
In Malaysia, most developed seismic fragility curves for buildings have not taken into account the effect of inadequate lap splice length. Therefore, this study investigates to what extent an inadequate lap splice length can alter the concrete wall buildings’ probability of collapse.
Methods:
Two 25-story concrete wall buildings with an identical plan but different parking levels were selected. Fifteen natural far-field earthquake records were used in the incremental dynamic analysis to calculate the inter-story drift demand and capacities. The inelastic response of beams and columns was simulated through the lumped plasticity model, and that of concrete walls and slabs was taken into account through the fiber-based distributed plasticity model. The effect of inadequate lap splice length in columns was simulated in the finite element models using the proposed method in ASCE/SEI 41-17 code. The developed fragility curves were compared with those established by other researchers for the same buildings.
Results:
It was observed that seismic-induced damage mostly concentrated on the columns of parking levels while the concrete walls remained in the elastic region. The obtained inter-story drift capacities were all less than 2%. Besides, the inter-story drift capacities of interior frames were less than half of exterior frames. The exterior frame of the building with three parking levels exhibited a larger probability of exceeding the CP limit state than the interior frame. A similar observation was made for the building with five parking levels when the PGA was more than 0.25g. Moreover, the probability of exceeding the CP limit state of the exterior frame with three parking levels was significantly more than that of the exterior frame with five parking levels. A similar observation was made for the interior frames when the PGA was larger than 0.2g. Furthermore, the conducted comparison showed that an inadequate lap splice length could increase the concrete wall buildings’ probability of collapse between 38 to 89%. The increase in the collapse probability of the interior frame with five parking levels was almost twice that of the exterior frame.
Conclusion:
It was concluded that the inadequate lap splice length could significantly reduce columns’ rotational capacity and result in brittle failure mode and limited residual strength. Besides, the inadequate lap splice length of columns reduced the inter-story drift capacity of investigated buildings and significantly increased their probability of collapse. Therefore, it was strongly suggested to include the effect of inadequate lap splice length in the finite element models when conducting seismic vulnerability studies.
1. INTRODUCTION
Peninsular Malaysia is located within the Sunda plate with historically low seismic activities. During the past decades, most low-intensity ground motions felt in Peninsular Malaysia have been related to the far-field Sumatran subduction and fault zones [1]. The most seismically active region in Malaysia is Sabah which lies within the Sunda block, between the oceanic basins of South China, Sulu, and Celebes Seas [2]. On 5th June 2015, an Mw 6 earthquake struck Ranau city in Sabah and imposed significant damage to structures and infrastructures [3]. This earthquake raised a lot of attention regarding the safety of existing structures against seismic actions and became one of the main reasons for the development of Malaysia’s national annex to Eurocode 8 [4] and further seismic vulnerability studies [5-7].
Some researchers have tried to investigate the seismic vulnerability of structures in Malaysia. For instance, Ahmadi et al. [8] worked on the seismic vulnerability of an irradiation plant in Peninsular Malaysia using pushover analysis. The developed seismic fragility curves showed that the structure reached its mean acceleration capacity at 0.68g while the expected peak ground acceleration for the construction site was 0.13g. In another study, Nor Hayati and Nor Mayuze [9] derived seismic fragility curves for a precast double-story building through an analytical approach. They concluded that the shear key between the precast walls and columns needed to be modified to reach a higher ductility level. Siti Nur and Fadzli Mohamed [10] derived seismic fragility curves for 3- and 6-story steel and concrete moment resisting buildings in Malaysia. Seven earthquake records were selected for performing the incremental dynamic analysis (IDA). They reported that the steel moment-resisting frames had a lower probability of collapse when compared with concrete moment-resisting frames. Besides, 3-story frames had a better seismic performance than the 6-story frames.
The seismic vulnerability of concrete box reinforced concrete bridges was studied by Ghazali et al. [11]. They employed IDA to estimate the drift demand and drift capacity of three bridges with different pier heights of 10 to 30 m. It was reported that the bridge with the tallest pier had the lowest probability of damage. In another study, Nurul Nabila et al. [12] derived seismic fragility curves for 3, 6, and 9-story RC frames in Malaysia. They showed that an increase in the number story increased the probability of damage. Kok Tong et al. [13] worked on the seismic fragility of a 4-story school building and a 3-story office building that had been designed only for gravity loads. The obtained results indicated that the buildings had an acceptable seismic performance when subjected to the target seismic hazard scenarios. Siti Aisyah et al. [14] worked on the seismic vulnerability of 25-story concrete wall buildings in Malaysia. Incremental dynamic analysis was employed to estimate structures’ drift demand under far-field earthquakes. They reported that the probability of exceeding collapse prevention damage states in Kuala Lumpur city was less than 15% for the investigated buildings. Kotaiba et al. [15] investigated the seismic vulnerability of the same 25-story concrete wall buildings but under the near-field earthquake excitations. They also showed that only a minor damage level was expected for the concrete wall buildings if constructed in Kuala Lumpur. Recently, Hui Siang et al. [16] studied the effect of roof garden weight on the seismic fragility of tall concrete wall buildings in Malaysia. They reported that tall buildings with roof garden had a larger probability of collapse compared with similar tall buildings without roof garden.
With an increase in urban sprawl in recent years, the construction of tall buildings in Malaysia has also significantly increased, especially in big cities like Kuala Lumpur. According to the Council on Tall Buildings and Urban Habitat (CTBHU), there are 78 buildings of 150+ m in height and 25 under construction as of 2019. It is also noteworthy that 90% of such tall buildings are made of concrete, and 45% of them are used as office buildings. The majority of such buildings have not been designed for seismic actions. As explained earlier, one main reason is the low seismicity of the country due to its specific seismotectonic condition. Therefore, the majority of concrete wall buildings in Malaysia do not satisfy the required lap splice length by seismic design codes, which has been one of the reasons for the observed damage during the 2015 Sabah earthquake [3]. A review of the literature shows that the previous studies on the seismic vulnerability of buildings in Malaysia have ignored the effects of inadequate lap splice length. However, many studies have shown that an inadequate lap splice length inversely affects the ultimate strength, stiffness, and ductility of structures [17-19], which ultimately increases, to a great extent, the probability of collapse [20]. Therefore, it is of great importance to investigate to what extent the inadequate lap splice length employed in the existing concrete wall buildings in Malaysia affects their collapse probability. In this study, the effect of inadequate lap splice length has been considered to derivate seismic fragility curves for concrete wall buildings in Malaysia. Besides, comparisons have been made between the fragility curves obtained from the current study and that of the Siti Aisyah et al. [14], which did not consider the effect of the inadequate lap splice length.
2. MATERIALS AND METHODS
2.1. Reference Buildings
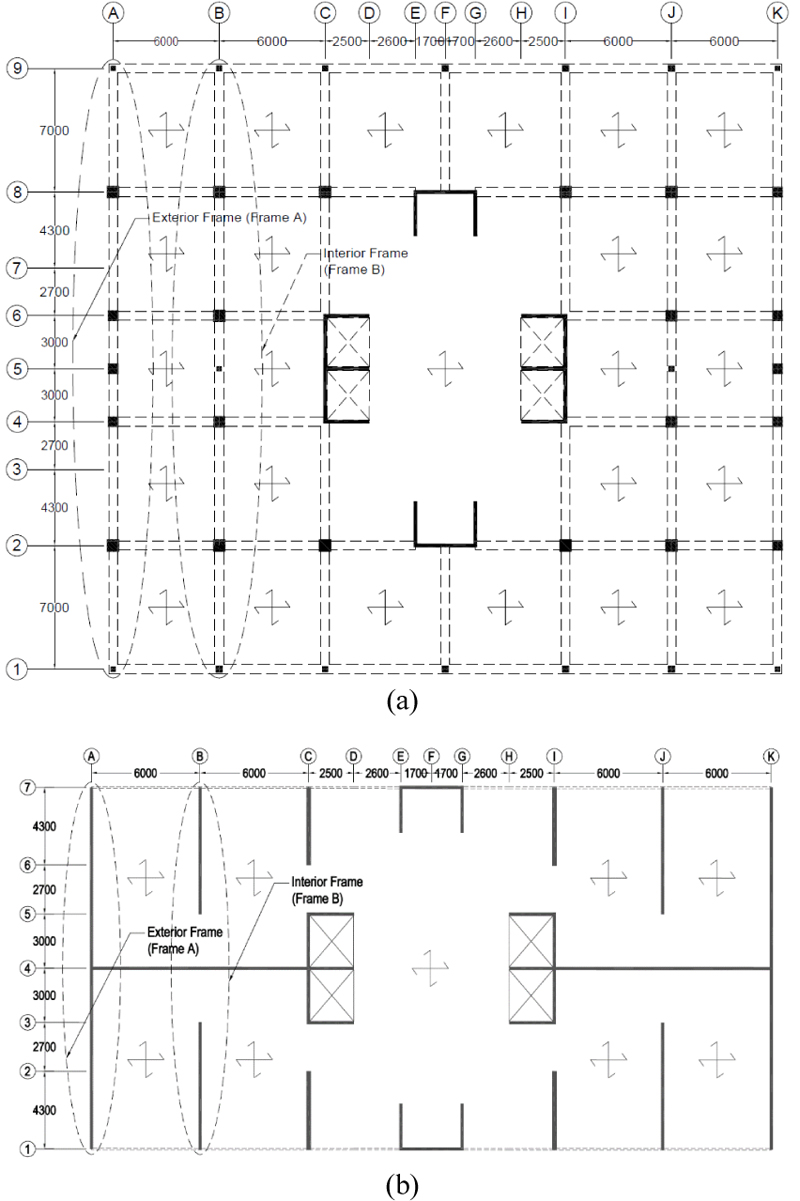
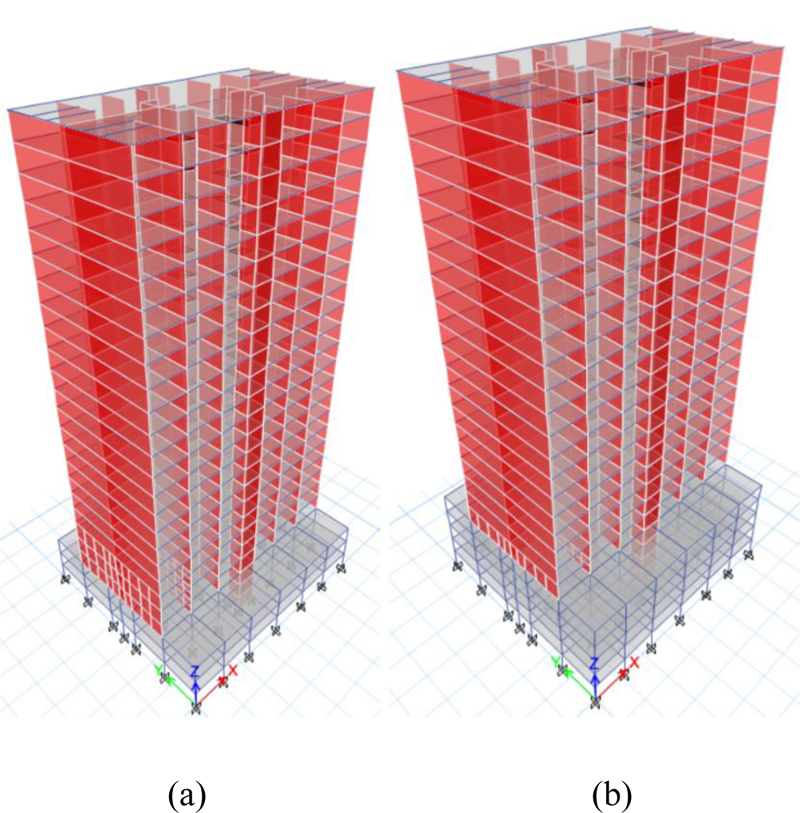
This study investigated the seismic vulnerability of two 25-story concrete wall buildings through the development of seismic fragility curves. The reference buildings are similar in plan but have a different number of parking levels, as shown in Figs. (1 and 2). As can be seen, the first building (referred to as building 1) has three, and the second building (referred to as building 2) has five parking levels. The layout plan of these buildings was selected to be similar to those used in Malaysia for residential buildings. As Figs. (1 and 2) show, the gravity and lateral loads in the parking levels are transferred to the foundation through a moment resisting frame system.
However, the upper levels' lateral load resisting system (i.e., residential floors) comprises only concrete shear walls. In other words, the concrete shear walls of the upper levels sit on the transfer beams of the last parking level and do not continue to the foundation level. The discontinuity of concrete shear walls imposes a sudden change on these buildings' lateral stiffness and strength. Although many seismic design codes have avoided such a structural system, it has been widely used in Malaysia and other low seismicity countries.
The buildings were designed in accordance with the previous practice in Malaysia. That means only gravity and wind loads were considered in the design of structural elements. In the design of buildings, the live load was taken as 5 kN/m2 for parking levels and 2 kN/m2 for the residential floors. Besides, superimposed dead loads of 1.2 kN/m2 and 1.6 kN/m2 were considered for the parking and residential levels, respectively. The wind load was estimated based on the IBC 2000 [21] code using a wind speed of 33 m/s and the exposure category C. The sizes of structural elements were determined using BS 8110-1-1997 [22], as it has been widely practiced in Malaysia. In the design of the structural elements, the compressive strength of concrete was assumed to be 40 MPa, and the yield strength of reinforcing bars was 460 MPa.
The following dimensions were obtained for structural elements under the combination of gravity and wind load actions: columns in the parking levels had a square cross-section with three different sizes of 350×350 mm at the axes 1 and 9, 550×550 mm at the middle of axes A and K, and 700×700 mm at other locations. The longitudinal reinforcement ratio of columns varied from 1.05% to 3.8%. The transfer beams had a rectangular cross-section with two different sizes of 750×700 mm (for beams supporting the concrete shear walls) and 550×500 mm (for other beams). Moreover, the longitudinal reinforcement ratio of beams ranged from 0.23% to 1.15%. The thickness of concrete shear walls varied from 150 mm on lower floors to 100 mm on upper floors. The longitudinal reinforcement ratio in concrete walls varied from 0.53% to 0.83%. The transverse reinforcement ratio equaled 0.25%. All floors were covered by a two-way 170 mm thick concrete slab. It should be mentioned that the layout plan and design parameters of the reference buildings were exactly similar to those used in the study of Aisyah et al. [14], in which the effect of inadequate lap splice length was not included in the analysis. This consideration allowed us to make an unbiased comparison between the obtained results.
2.2. Finite Element Simulation
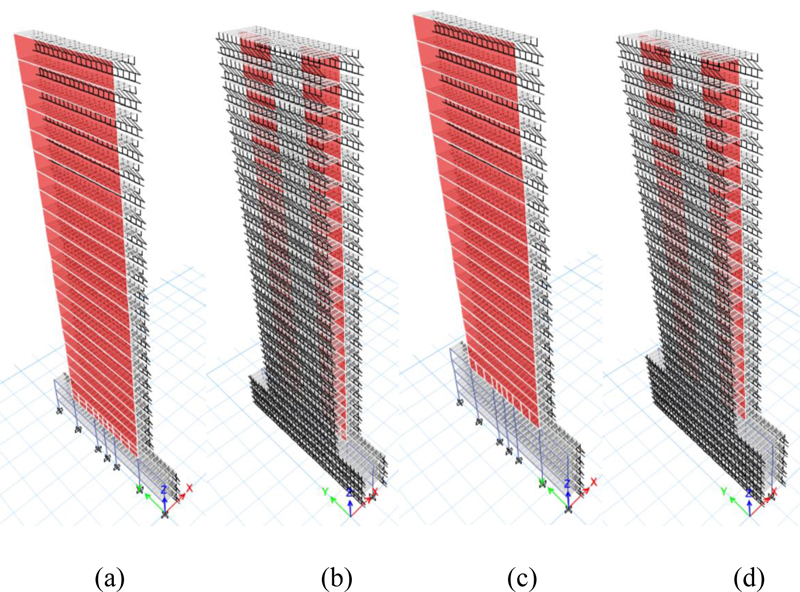
The finite element models of the reference buildings were established in CSI, ETABS software [23]. This software can simulate the elastic and inelastic response of beams, columns, slabs, and concrete shear walls and has been used by many researchers [24-26]. In addition, It has been shown that the software provides accurate results for the nonlinear analysis of tall buildings with a concrete shear wall structural system [27]. In this study, the finite element analysis of the buildings had two phases. In the first phase, a 3-dimensional model of each building was established in the software Fig. (2). These models were used to conduct a linear analysis and determine the structural elements’ sizes according to the common practice in Malaysia. In the second phase, from each building, two frames (i.e., an exterior frame and an interior frame, as shown in Figs. (1 and 3) were selected for the derivation of seismic fragility curves. The main reason for using the frames rather than the 3D models was to reduce the computational time of the incremental dynamic analysis (IDA). It should be mentioned that many researchers have also employed the same approach to decrease the computational efforts of nonlinear analysis in tall buildings [28, 29].
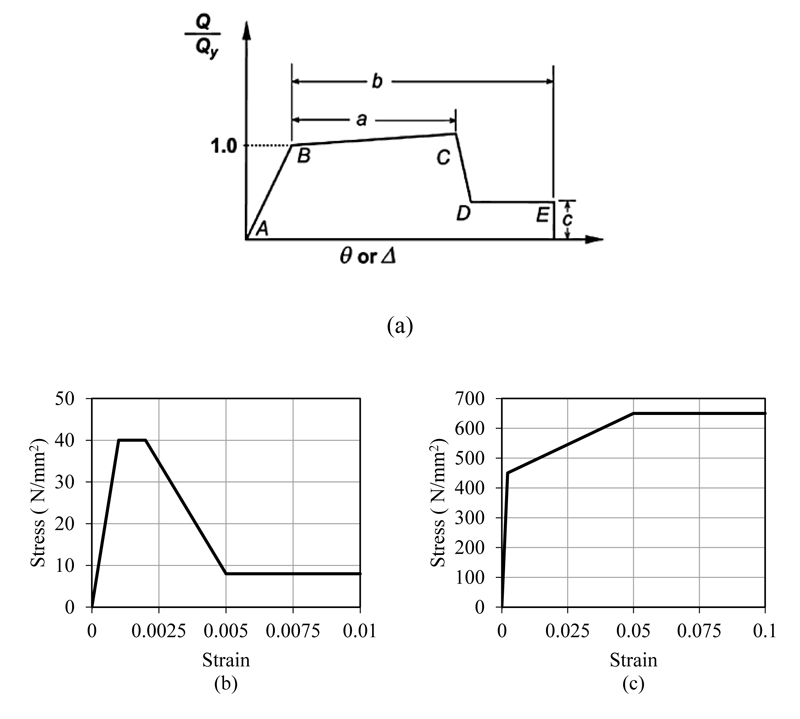
In the nonlinear models, the inelastic response of beams and columns was taken into account using the lumped plasticity model [30]. In this model, plastic hinges are assigned to the critical locations of beams and columns (often at both ends where the bending moment is maximum). The plastic hinges determine the moment-rotation relationships of beams and columns when subjected to gravity and seismic actions. In this study, the moment-rotation relationships of plastic hinges were determined in accordance with the recommendations of ASCE/SEI 41-17 [31]. As shown in Fig. (4), the plastic hinge's moment-rotation response has three distinct segments of AB, BC, and CD that represent elastic, post-yield, and failure responses, respectively. In addition, the residual strength of the plastic hinge is shown by point E. The bending strength was determined for each element based on its cross-sectional and material properties. The rotational capacities corresponding to each segment of plastic hinges were extracted from the equations and tables given in ASCE/SEI 41-17 [31].
It should be mentioned that ASCE/SEI 41-17 [31] takes into account the effect of inadequate lap splice length through a reduction in the yield strength of reinforcing bars. Besides, a decrease in the rotational capacity of plastic hinges is imposed when the lap splice length is inadequate. Equation (1) has been proposed by ASCE/SEI 41-17 to account for the reduction in the yield strength of reinforcing bars with inadequate lap splice length. In this equation, ld is the required length of development for a straight bar which was calculated using the specification of ACI 318 [32], and lb is the lap splice length of the reinforcing bar. Considering the standard practice in Malaysia lb was assumed as 25d, where d was the diameter of the bar. fy is the yield strength of the longitudinal reinforcement bar.
 |
(1) |
The inelastic response of slabs and shear walls was taken into account through fiber-based distributed plasticity [33]. In this method, the cross-section of structural elements is divided into small steel or concrete fibers. The stress-strain relationship is defined for each fiber based on the employed material properties. During seismic events, each fiber's stress intensity is monitored and compared with the predefined thresholds to determine the damage level. Fig. (4) depicts the employed stress-strain relationships for steel and concrete materials, and Table 1 shows the considered threshold for different damage states. As shown in Table 1, based on the recommendation of ASCE/SEI 41-17, three different damage states were considered for structural elements. Immediate Occupancy (IO) represented minor repairable damage, Life Safety (LS) indicated moderate damage, and Collapse Prevention (CP) showed extensive damage with a small margin against collapse.
| Damage State | Strain in Concrete | Strain in Reinforcement |
|---|---|---|
| IO | 0.002 | 0.010 |
| LS | 0.003 | 0.025 |
| CP | 0.005 | 0.050 |
Since the seismic detailing was not considered in the design of structural elements, the employed stress-strain relationship for the concrete material followed that of an unconfined condition. It should also be mentioned that the shear behavior of concrete walls was simulated as an elastic response because their shear strength was significantly larger than the calculated shear force demand. As shown in Fig. (3), the slabs of all floors were also simulated in the finite element models of the frames. The boundary of the frames’ slab was supported by some springs that had only a vertical stiffness. The vertical stiffness of these springs was calculated based on the vertical elastic stiffness of the slabs in the 3-D models. It should also be mentioned that a 0.75% stiffness-proportional Rayleigh damping was considered in the nonlinear analysis [29].
2.3. Selection of Earthquake Records
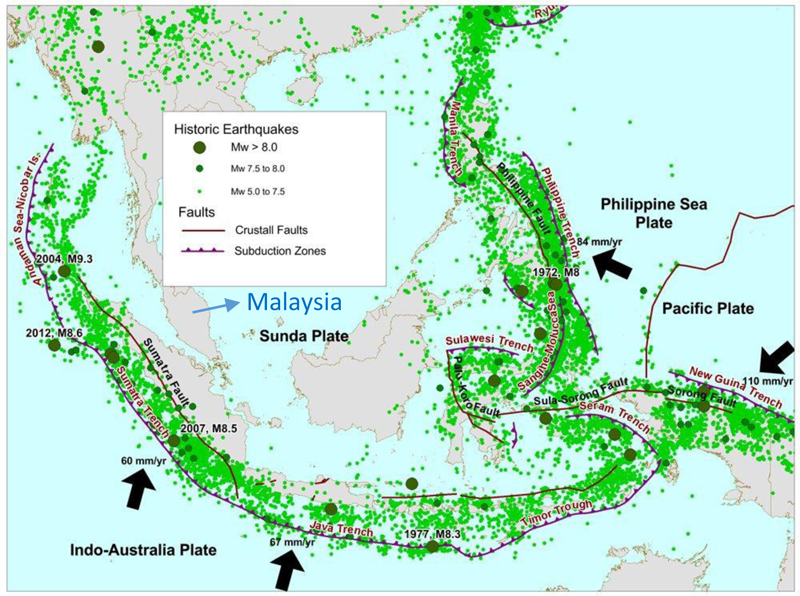
In this study, 15 far-field natural earthquake records were selected to conduct incremental dynamic analysis. The reason for choosing far-field earthquakes was the fact that the main seismic hazard scenario for Peninsular Malaysia is related to the distant earthquakes that occur in the Sumatra fault zone or subduction zone [1]. Fig. (5) shows the active faults and historical seismicity adjacent to Malaysia [34]. The specifications of the selected records are shown in Table 2. The duration of selected records varies from 20 to 60 sec., and their PGA varies from 32 to 221 cm/sec2. Besides, all records have a PGA/PGV ratio of less than 8, implying they have high energy in the low-frequency range [35]. It is seen that the selected earthquake records have a magnitude ranging from 6.3 to 8.1 Mw, and their source-to-site distance ranges from 40 to 379 km. It should be mentioned that earthquake records should be scaled before being used in IDA. Different methods, such as linear scaling using spectrum matching, amplitude scaling, and linear scaling of spectral acceleration at the first natural period, have been suggested by researchers [36]. Following previous studies on tall buildings [29], the peak ground acceleration of earthquake records was selected as the ground motion intensity measure, and the magnitude of earthquake records was linearly scaled from 0.05g to 0.5g with an increment of 0.05g to conduct IDA.
| Seismic Record | Year | Location |
Duration (sec) |
Source-to-site distance (km) |
PGA cm/sec2 |
Magnitude Mw |
PGV cm/sec |
PGA/PGV 1/sec |
|---|---|---|---|---|---|---|---|---|
| L1 | 1933 | Long Beach | 30 | 59 | 95.6346 | 6.3 | 23.6861 | 4.04 |
| L2 | 1933 | Long Beach | 30 | 59 | 62.3281 | 6.3 | 17.3429 | 3.59 |
| L3 | 1934 | Lower California | 25 | 58 | 156.821 | 6.5 | 20.8557 | 7.52 |
| L4 | 1971 | San Fernando | 20 | 290 | 98.7472 | 7.9 | 19.3034 | 5.12 |
| L5 | 1971 | San Fernando | 25 | 40 | 129.816 | 6.6 | 21.5835 | 6.01 |
| L6 | 1971 | San Fernando | 25 | 39 | 126.889 | 6.6 | 18.6331 | 6.81 |
| L7 | 1971 | San Fernando | 20 | 41 | 111.844 | 6.6 | 18.5641 | 6.02 |
| L8 | 1971 | San Fernando | 20 | 39 | 114.976 | 6.6 | 21.5351 | 5.34 |
| L9 | 1971 | San Fernando | 20 | 38 | 116.964 | 6.6 | 17.3109 | 6.76 |
| L10 | 1971 | San Fernando | 20 | 41 | 103.784 | 6.6 | 16.9648 | 6.12 |
| L11 | 1968 | Undefined | 45 | 32 | 221.5 | 6.6 | 33.4 | 6.63 |
| L12 | 1973 | Undefined | 35 | 112 | 200.9 | 7.4 | 27.5 | 7.31 |
| L13 | 1985 | Undefined | 35 | 135 | 101.3 | 8.1 | 15.02 | 6.74 |
| L14 | 1985 | Undefined | 30 | 333 | 32 | 8.1 | 7.38 | 4.34 |
| L15 | 1985 | Undefined | 60 | 379 | 38.83 | 8.1 | 7.37 | 5.27 |
2.4. Derivation of Seismic Fragility Curves
In this study, the proposed equations by Wen et al. [37] (i.e., equations (2-4)) were used to derive the seismic fragility curves for the selected frames.
 |
(2) |
 |
(3) |
 |
(4) |
In the above equations, P(DS|SI) is the conditional probability of exceeding a damage state (DS) for a given seismic intensity (SI). ɸ is the standard normal distribution; λC is the natural logarithm of the median of the drift capacity for a particular damage state; λD│SI is the natural logarithm of calculated median demand drifts given the seismic intensity from the best fit power-law line. S2 is the standard error, and ln is the natural logarithm. βD│SI stands for demand uncertainty, while βc and βM reflect uncertainties associated with capacity and modelling, respectively. Cov is the coefficient of variation for the computed limit state capacities. In this study, βM was assumed to be 0.3, as suggested by other researchers [29].
In this study, the uncertainties related to the structural material properties were not taken into account, and it was assumed that the employed material properties represent their respective mean values [38]. This assumption was made because it has been shown that uncertainties related to the seismic demand govern the overall response variability [39]. The uncertainties related to the capacity (βc) calculated by equation (4) varied from 0.13 to 0.28 for the IO damage level and from 0.15 to 0.28 for the CP damage level.
3. RESULTS AND DISCUSSION
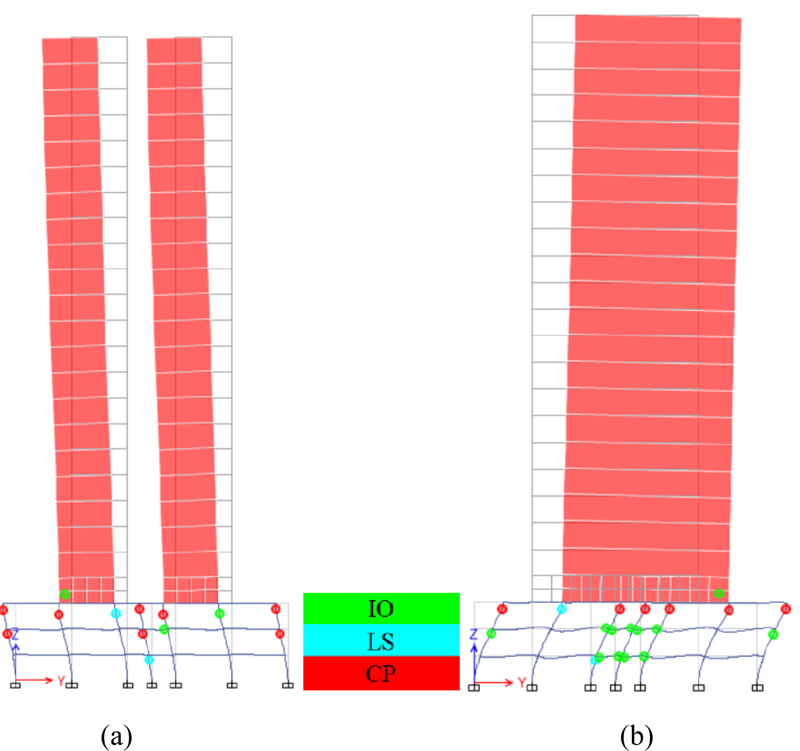
The obtained median inter-story drift capacities from IDA are shown in Table 3. As can be seen, no result has been reported for the LS limit states because the investigated buildings were not designed for seismic action and therefore exhibited a brittle seismic response. This can also be seen from the differences between the drift capacities of IO and CP limit states that are very small in general. It should be mentioned that design codes often propose a drift capacity not less than 2% [40] for the CP limit states of concrete wall buildings, which is larger than the obtained results for the investigated buildings. The main reason for this observation relies on the sudden change in the stiffness of the buildings and the inadequate lap splice length of columns. As can be seen from Fig. (6), these two parameters have forced seismic-induced damage to concentrate mostly on the columns of parking levels, while the concrete shear walls have remained almost intact under seismic actions.
| Building 1 (3 parking levels) | Building 2 (5 parking levels) | ||||||
|---|---|---|---|---|---|---|---|
| Exterior Frame | Interior Frame | Exterior Frame | Interior Frame | ||||
| IO (%) | CP (%) | IO (%) | CP (%) | IO (%) | CP (%) | IO (%) | CP (%) |
| 1.40 | 1.46 | 0.56 | 0.81 | 1.52 | 1.75 | 0.33 | 0.56 |
It can also be seen from (Table 3) that, in both buildings, the interior frames exhibit a significantly smaller inter-story drift capacity for IO and CP limit states when compared with the exterior frames. This is mainly because, unlike the exterior frames, the concrete walls of the interior frames are connected by relatively thin slabs that undergo a large flexural rotation during seismic events. It is also noteworthy that an increase in the number of parking levels has enhanced the drift capacity of the exterior frame; however, it has reduced that of the interior frame. It should be mentioned that the obtained results for the exterior frames’ drift capacities at the CP limit state are less than those reported by Siti Aisyah et al. [14] which is mainly due to the effect of inadequate lap splice length. The obtained drift capacities by Aisyah et al. for the exterior frames of buildings with three and five parking levels were 1.54% and 2.58%, respectively. However, the reported drift capacities for the interior frames were close to those presented in Table 3.
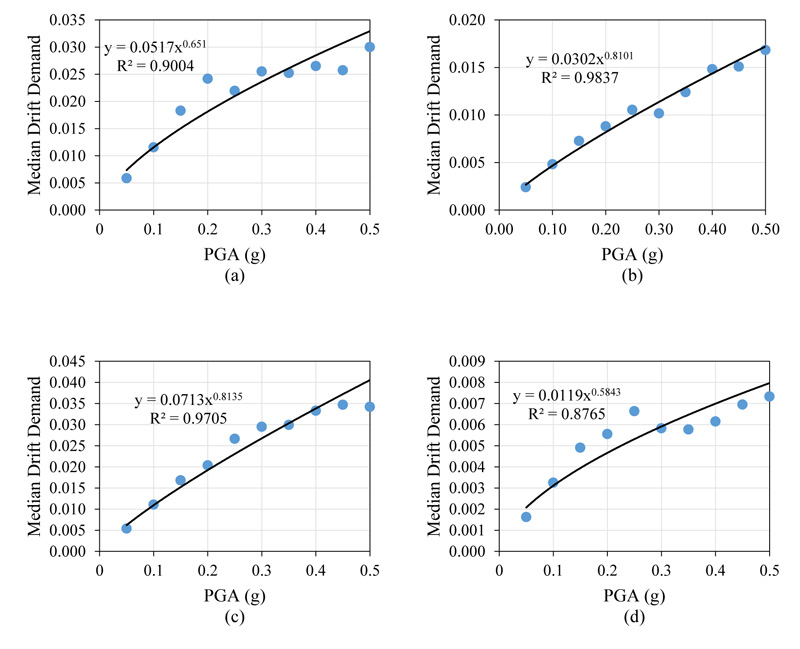
The obtained relationships between the median inter-story drift demand and the PGA of records are shown in Fig. (7). It is evident from the graphs that, for all frames, there is a strong correlation (see R2 values) between the median drift demands and the PGA of records. This observation implies the appropriateness of the selected engineering demand parameter (i.e., inter-story drift) and the ground motion intensity measure (i.e., PGA) to develop the seismic fragility curves.
Figs. (8 and 9) depict the seismic fragility curves derived for the frames with 3 and 5 parking levels, respectively. As can be seen from Fig. (8), the obtained fragility graphs for the IO and CP damage states of the exterior frame are very close to each other. This is because the inter-story drift captivity of IO and CP damage states have an insignificant difference (Table 3). This observation clearly shows the brittle behavior of this frame when subjected to a seismic event. It can also be seen from Fig. (8) that the exterior frame has a larger probability of exceeding the CP damage states compared with the interior frame. This observation is similar to the findings of the study conducted by Siti Aisyah et al. [14]. Besides, as the PGA increases, the difference between the probabilities of exceeding the CP damage states of interior and exterior frames decreases. In addition, it can be seen from Fig. (8b) that the fragility curve obtained for the IO damage state is steeper than that of the CP damage state. This means that, for this frame, an increase in the PGA of ground motions can elevate the probability of minor damage more than severe damage.
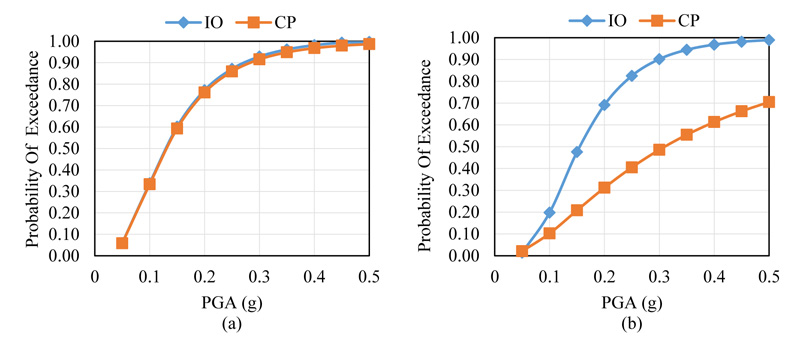
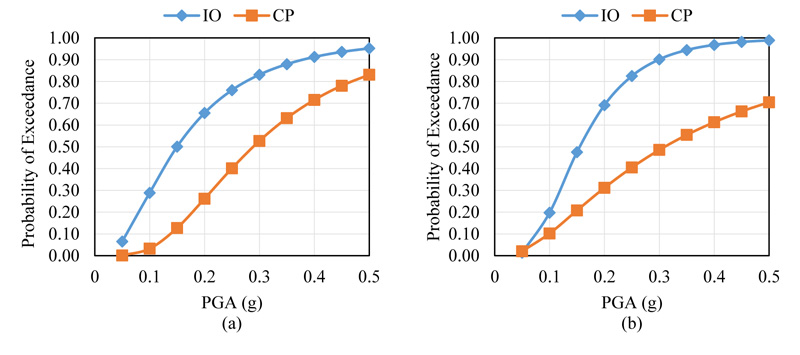
As shown in Fig. (9), the probability of exceeding the IO damage states for the interior frame with five parking levels is slightly more than that of the interior frame up to PGA of 0.15g. However, as the PGA increases, the exterior frame exhibits a larger probability of exceeding the IO limit states than the interior frame. Moreover, the exterior frame exhibits a slightly larger probability of exceeding the CP damage state than the interior frame when the PGA is more than 0.25g. However, for PGAs less than 0.25g, the interior frame is more likely to exceed the CP damage states.
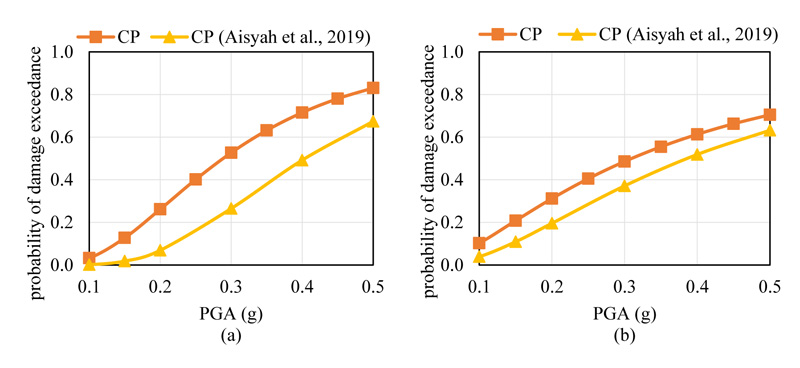
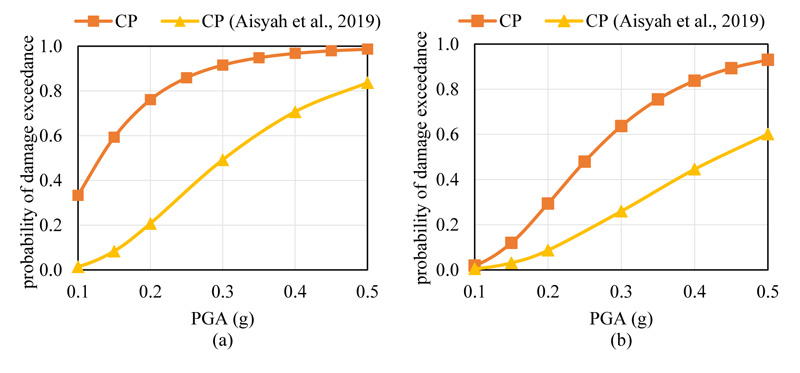
A comparison between Figs. (10 and 11) shows that the probability of exceeding the CP limit state of the exterior frame with three parking levels is significantly more than that of the exterior frame with five parking levels. A similar observation can be made for the interior frames when the PGA is larger than 0.2g. However, for PGAs smaller than 0.2g, the differences between the CP damage states of exterior frames are insignificant. It is also noteworthy that there is an insignificant difference between the probabilities of exceeding the IO damage state of interior frames. Therefore, a decrease in the number of parking levels has mostly elevated the probability of severe damage, especially for larger PGAs. Similar observation has also been reported by Siti Aisyah et al. [14].
| - | Interior Frame | Exterior Frame | ||||||
|---|---|---|---|---|---|---|---|---|
| 3 Parking Levels | 5 Parking Levels | 3 Parking Levels | 5 Parking Levels | |||||
| KL | Ranau | KL | Ranau | KL | Ranau | KL | Ranau | |
| Probability of exceeding CP “Current Study” |
7 | 39 | 16 | 36 | 52 | 82 | 8 | 34 |
| Probability of exceeding CP “Siti Aysiah et al.” |
2 | 14 | 10 | 26 | 6 | 27 | 2 | 13 |
| Increase (%) | 71 | 64 | 38 | 38 | 89 | 67 | 75 | 62 |
In order to investigate the effect of inadequate lap splice length on the obtained seismic fragility curves, a comparison has been made with the study conducted by Siti Aisyah et al. [14]. Figs. (9 and 10) compare the seismic fragility curves of the current study with those reported by Siti Aisyah et al. [14]. It is evident from these two figures that the inadequate lap splice length considered in the analysis of the current study has significantly increased the probability of collapse in both buildings. It is seen that the increase in the probability of collapse of the building with three parking levels is larger than the building with five parking levels. Besides, in general, the inadequate lap splice length has increased the exterior frames’ probability of collapse more than the interior frames. Table 4 compares the developed fragility curves for two cities located in Peninsular and East Malaysia. According to the Malaysia national annex to Eurocode 8 [4], the PGA of the design basis earthquake for the Kuala Lumpur (KL) and Ranau cities is 0.09g and 0.16g on bedrock. The annex suggests a soil amplification factor of 1.4 for the stiff soil in these two cities. Therefore, the expected design PGAs on stiff soil equals 0.13g and 0.22 g for Kuala Lumpur and Ranau, respectively. As Table 4 shows, the probability of exceeding the CP damage state has been increased between 38 to 89% when the effect of inadequate lap splice length has been taken into account. It is evident from this table that the increase in the probability of CP damage states is more pronounced for the exterior frame (i.e., up to 89%). Besides, the inadequate lap splice length has increased the probability of exceeding the CP level in the frame with three parking levels more than that of the frame with five parking levels. It should be mentioned that the conducted study by Koon et al. [20] on ground soft-story RC frames also indicated that the inadequate lap splice length increased the collapse probability of 3- and 6-story structures by 40% and 64%, respectively. Therefore, the effect of inadequate lap splice length should be included in the seismic vulnerability studies of similar buildings.
CONCLUSION
This study investigated the effect of inadequate lap splice length on Malaysia's seismic fragility of concrete wall buildings. Two 25-story concrete wall buildings with similar plans but different parking levels were designed for gravity and wind loads using the standard practice in Malaysia. Two frames (i.e., an exterior and an interior) were selected from each building to derive seismic fragility curves. Moreover, 15 far-field natural earthquake records were selected and employed in the incremental dynamic analysis to estimate the inter-story drift demand and capacities. The seismic-induced damage to buildings was mostly concentrated on the columns of parking levels, while the concrete shear walls remained in the elastic region. The inter-story drift capacities of the interior frames varied from 0.33% to 0.51%, which were significantly less than that of exterior frames (i.e., 1.4% to 1.75%). The developed fragility curves showed that frames with five parking levels had a higher probability of exceeding the CP damage state than the frames with three parking levels. In addition, the exterior frames exhibited a larger probability of collapse when compared with the interior frames. Furthermore, the consideration of inadequate lap splice length in the analysis significantly increased the probability of collapse. The increase in the probability of collapse for buildings located in Kuala Lumpur varied from 38% to 89%, while for Ranau, it ranged from 38% to 67%. Therefore, it was concluded that the effect of inadequate lap splice length should be considered in the seismic vulnerability studies.
LIST OF ABBREVIATIONS
| IDA | = Incremental Dynamic analysis |
| PGA | = Peak ground acceleration (m/s2) |
| PGV | = Peak ground velocity (m/s) |
| DS | = Damage state |
| SI | = Seismic Intensity |
| IO | = Immediate Occupancy |
| LS | = Life Safety |
| CP | = Collapse prevention |
CONSENT FOR PUBLICATION
Not applicable.
AVAILABILITY OF DATA AND MATERIALS
The data that support the findings of this study are available from the corresponding author [M.Y.] upon reasonable request.
FUNDING
This work was financially supported by the Malaysian Ministry of Higher Education and Universiti Teknologi Malaysia under the grant numbers (4J224, 5F365, and 4B728).
CONFLICT OF INTEREST
Dr. Mohammadreza Vafaei is the Associate Editorial Board Member of the journal TOCIEJ.
ACKNOWLEDGMENTS
The authors would like to thank the provided financial support from the Malaysian Ministry of Higher Education and Universiti Teknologi Malaysia.


