All published articles of this journal are available on ScienceDirect.

Measurement of the Hygric Resistance of Concrete Blocks with Perfect Contact Interface: Influence of the Contact Area – Complementary Comments
Abstract
Introduction:
In March 2021, this journal published the paper “Measurement of the Hygric Resistance of Concrete Blocks with Perfect Contact Interface: Influence of the Contact Area”. This commentary aims to provide readers with a set of complementary comments that seek to clarify a few issues that can be raised.
Methods:
The analysis was done based on the original paper “Measurement of the Hygric Resistance of Concrete Blocks with Perfect Contact Interface: Influence of the Contact Area”. The purpose was to complete and comment on the work developed in the original paper, and to clarify some points that might be less understood.
Results and Discussion:
Some interesting questions are presented, and the analysis results intend to clarify them, namely: (1) the magnitude of the quantified post-interface flows; (2) the distinguishability of the moisture absorption in the monolithic and perfect contact samples; (3) the robustness of the knee-point identification algorithm; (4) the dependability of the capillary absorption measurements; (5) the consistency of the capillary absorption processing; (6) the number and “quality” of samples that should be used.
Conclusion:
The conclusions to highlight are the following: the hygric resistance results would be different as they consider different methodologies for the knee point detection and a different number of data points after the knee (different ones) to calculate the slope; the monolithic samples reached the highest moisture masses, Mw, and the Mw values became lower with the interface occurrence; for the knee-point identification, it was only considered valid the use of the third of the three algorithms described in Section 2.3; the taping of the samples was carefully done, and absorption tests using epoxy resin is considered a better solution; the C calculation was made for all monolithic samples, but only the 3 more representative experimental results for each contact area were represented (as mentioned) and the Aw of the 10x10 cm2 cross-section should be 0.1013 kg/m2s0.5, which does not influence the conclusions/findings.
1. INTRODUCTION
The analysis of moisture migration in building materials and elements is crucial for its behaviour knowledge, also affecting its durability, waterproofing, degradation and thermal performance. A building wall generally consists of multiple layers, and thus the investigation of the moisture transfer presumes knowledge about the continuity between layers [1, 2].
In literature, there are several studies concerning liquid transport in multilayered porous structures, but only a limited number of experimental values for the interface resistance in multilayered composites are found [3-6]. Qiu [4] showed that if the interface resistance is determined after the capillary saturation of the first layer, the change in material properties could be neglected. The author analysed experimentally the liquid transport across the interface between aerated concrete and mortar and compared the experimental results with numerical results obtained by using an interface resistance. Derluyn et al. [7] considered an interface resistance as well as a change in mortar properties. The authors showed that for dry-cured mortar, a higher interface resistance was obtained compared to the wet-cured composite.
The interface is a problem in building construction, especially when thinking about the moisture transfer phenomenon. When reflecting on several previous research works, namely [2], it can be identified as a hygric resistance promoted by the interface, and has been possible to study the hygric resistance approximate value and the dependence on the interface type, material, and position.
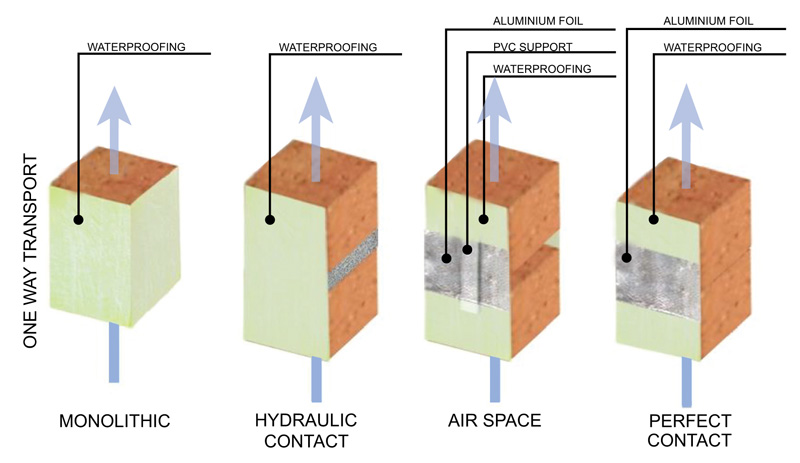
The paper “Measurement of the Hygric Resistance of Concrete Blocks with Perfect Contact Interface: Influence of the Contact Area” [8] is part of extended research work. This paper was developed in cooperation between Portugal and Brazil on the topic of moisture transfer in building materials with different interfaces. This paper presents an experimental study, developed in Brazil, that was carried out to specifically analyse the effect of contact area on the capillary absorption coefficient of concrete samples, according to several standards: NBR 9779 [9], EN 1015-18 [10], ISO 15148 [11] and ASTM C1794 [12]. Two types of specimens were analysed, monolithic samples and samples with a perfect contact interface, at different interface heights. It is important to clarify that a perfect contact interface is here considered when building materials are in contact without interpenetration of the porous structure, i.e., two “pieces” are just in contact without the continuity of the porous structure.
In a paper [8], it is revealed that the analysed international standards have some divergences and different approaches. The capillary water absorption coefficient Aw results obtained with the standards ISO 15148 [11] and ASTM C1794 [12] are very similar, and there is some coherence with the “C” value obtained with the Brazilian standard NBR 9779 [9]. Finally, the mortar absorption test recommended by EN 1015-18 [10] presented very different results in comparison to the other standards, which was expected considering that the material studied was concrete, and this standard is not ideal for analysing this type of material. In addition, the hygric resistance values in multilayer building components with a perfect contact interface were calculated using the “knee point” methodology. Considering that, the main achievements and conclusions presented [8] were that the samples with perfect contact interface indicate that the water absorption before the interface presents similar behaviour to the monolithic samples and there is a reduction in the absorption rate when water reaches the interface due to the hygric resistance. The interface contact area does not greatly influence the water-resistance values.
Certainly, in research works, there is always a set of questions that can be asked and discussed.
Some interesting questions are here presented, several promoted [13], and the analysis results intend to clarify them, namely: (1) the magnitude of the quantified post-interface flows; (2) the distinguishability of the moisture absorption in the monolithic and perfect contact samples; (3) the robustness of the knee-point identification algorithm; (4) the dependability of the capillary absorption measurements; (5) the consistency of the capillary absorption processing; (6) the number and “quality” of samples that should be used.
2. INTERFACE INFLUENCE IN PERFECT CONTACT SAMPLES
2.1. Magnitude of the Quantified Post-Interface Flows
It is quite clear that for the determination of the post-interface flows, it is necessary to identify, as good as possible, the knee point in the moisture absorption process, i.e., the moment of interface passing, to quantify the moisture absorption, after that.
In a paper [8], the hygric resistance was determined by the “knee point” methodology, using the third of the three algorithms [14] and more detailed in Section 2.3. Considering that the hygric resistance should be measured immediately after the first changing point, it was considered important to detect the instant time of the “knee point” using a numerical tool and with better precision as possible. An algorithm based on discrete methods, which was intuitive and easy to implement, was developed by the authors [14] based on literature methods of knee or jump point detection to optimise and overtake some identified limitations.
In a paper [13], the data for the 18 perfect contact moisture absorption curves were digitally extracted [8], and the subsequent knee points were identified using the first method of three algorithms [14], considering the easiest to implement. However, as it will be better explained in Section 2.3, the authors [8] only consider valid the use of the third of the three algorithms. This important difference influences the quantified post-interface flows.
It is clearly explained [13], “for the post-interface flow quantification, at first, the slope of all data points from the knee point onward is calculated, and alternatively, the slope of four data points from the knee point onward…”. Therefore, as a first assumption, the post-interface flow quantification is naturally different when comparing the experimental results [8] and the values extracted digitally.
However, for 2 out of 18 cases, as this option gave a “negative flow”, six data points from the knee point onward were adopted for the slope fitting. As it can be seen, the decision for the number of points to be considered (after the knee) for the post-interface flow quantification was not based on an “independent” methodology. The decision to use 4 or 6 points can change the results of the obtained flow.
The authors [8] do not have a specific methodology (as they proposed for the keen point detection –Section 2.3), so this is a very interesting point to be discussed in the future, i.e., the development of an accurate and independent algorithm to the post-interface flow quantification. Till there, different results can be presented depending on the number of points considered. A scheme of the method adopted for the hygric resistance determination is shown in Fig. (1). This is an interesting topic to be studied deeper, enabling the development of a methodology based on an independent criterion.
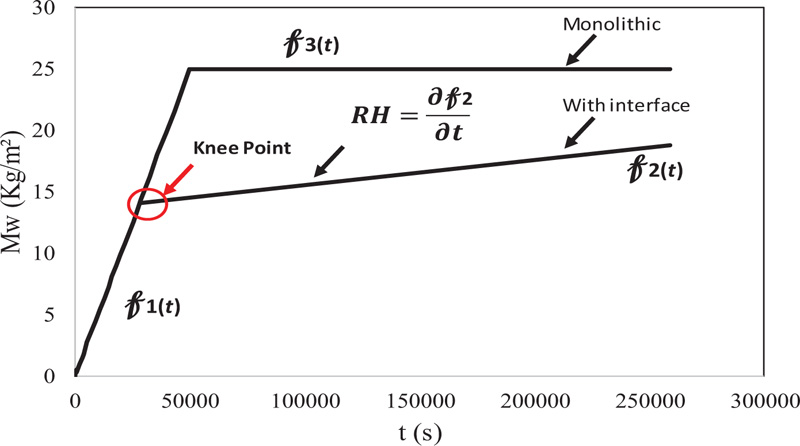
At this stage, the hygric resistance results [8, 13] are different, as the authors consider different methodologies for the knee point detection, and they consider a different number of data points after the knee (different ones) to calculate the slope. A new set of questions that can now be emerged are: Is there a specific number of points to guarantee the “correct” flow? Can a methodology be developed to define which points should be considered? Is this methodology independent of the material, the interface type and position?
However, generalisation of hygric resistance values should be carefully considered. These values are determined specifically for these materials and conditions. The usefulness of the study is more related to the possibility of determining the hygric resistance, when necessary, that could be needed to simulate moisture transport phenomenon than the values themselves Figs. (2 and 3).
2.2. Distinguishability of the Interface Impacts
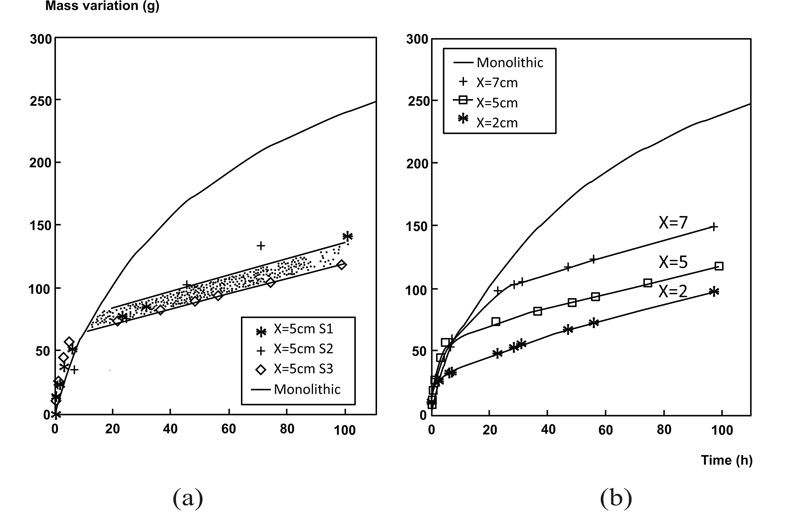
In a paper [8] the moisture transport in multilayer porous materials by a gravimetric method was analysed, with discontinuities caused by the existence of perfect contact interfaces between the materials at different interface heights. It is well known that these discontinuities cause hygric resistance that retards moisture transport [2, 15-20]. This specific conclusion was not the goal of the paper, as this work aims to understand the effect of the sample cross-section size on the capillary absorption coefficient of concrete samples with and without discontinuities (monolithic samples and samples with perfect contact interfaces at different heights).
The results presented in Fig. (4) of [8] showed that before the interface, the water absorption of the samples with a perfect contact interface presented similar behaviour as the monolithic samples. However, it is possible to identify a different behaviour when reaching the interface and that change is dependable on the interface position.
It can be said that the hygric resistance (expressed in kg/m2s) is the greater or lesser ease of moisture transfer and is calculated experimentally by the slope of the mass variation curve as a function of time, during a water absorption test, after reaching discontinuity [18, 21, 22]. The “knee point” methodology, using the third of the three algorithms described in a study [8], and more detailed in Section 2.3., was used to determine the hygric resistance values. In a paper [12], the author used data digitally extracted from another study [8] and these data are presented in Fig. (2), “the measured moisture absorption curves for the monolithic of [13] (blue) and perfect contact (orange) samples over the first half-day of the test”. It is considered difficult to identify each class if no colour distinction has been made. However, it is simultaneously said that “the moisture absorption in the perfect contact samples does not reach the highest moisture masses”.
In fact, looking at Fig. (4) of [8] and (Fig. 2) of [13], it is possible to observe and identify a different behaviour when reaching the interface. In the monolithic samples, moisture masses, Mw, reached the highest, and the Mw values became lower when having interface (Fig. 2); similar observations are made in a study [2]. There are some materials where this difference is more evident than other materials.
Additionally, in a paper [13], to further establish the overly similar nature of the moisture absorption in monolithic and perfect contact samples, knee points and quantified post-interface flows were identified for the monolithic samples, a very subjective exercise, given that these samples should not be influenced by an interface. Even considering a strange way of doing it, the most important question is the way of determining the knee points and, consequently, the post-interface flows. It was clearly said [13], “knee points were identified based on the first algorithm of the related paper”, and the authors only consider valid the use of the third of the three algorithms [8].
According to what is explained above, it is possible that the knee-point identification was different, where the authors used a methodology that was validated with many experimental measurements and where they could observe that the first algorithm gives possible incorrect values. This difference has important consequences on the determination of post-interface flows.
2.3. Robustness of the Knee-Point Identification Algorithm
For the knee-point identification, the authors [8] only consider valid the use of the third of the three algorithms [14]. In a study [13], the author applied the first out of three algorithms, considering the easiest to implement, however, this methodology is not considered by the authors [8] as a good solution. In fact, the authors exactly suggest this third methodology (the first two were not developed by the authors but are methodologies proposed in the literature [23-28]) to avoid the limitations identified using those two methods.
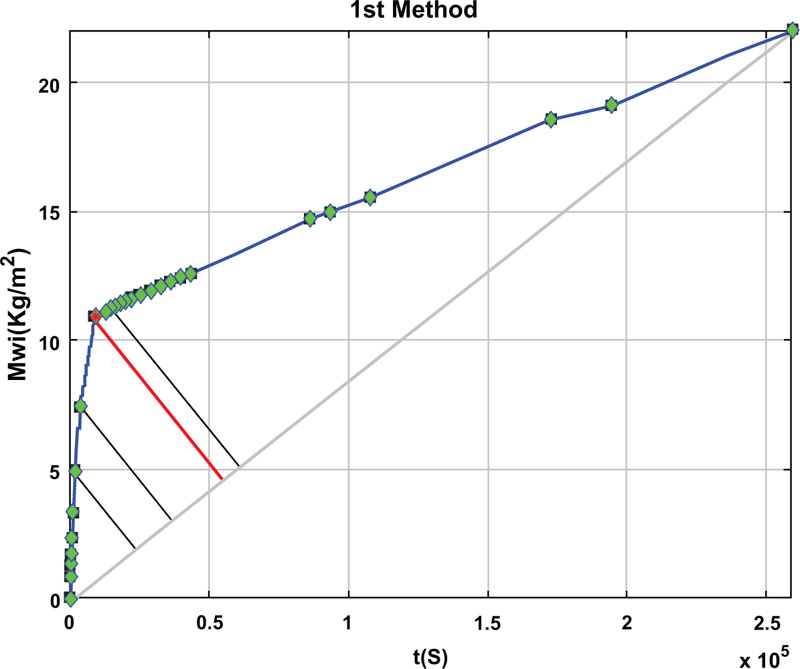
The first method connects the first and last data point with a straight line and identifies the knee point as the point furthest away from that line – (Fig. 3) [13].
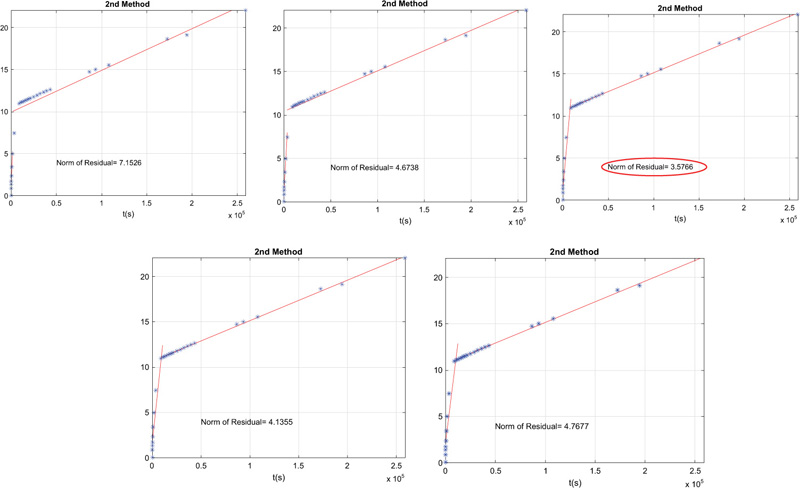
The second method splits the moisture absorption curve into two parts, before and after each measured point and fits separate straight lines to both parts. The point that gives the smallest total deviation between these two lines and the data points is identified as the knee point (Fig. 4). A complete explanation, with examples of knee point detection methods, is presented in previous works [14, 19].
The third method, proposed by the authors, is a combination of the two methods previously presented. The steps of this algorithm are:
(1) Use the 1st method to calculate, for each point obtained in the measuring procedure, the length of the line segment that is perpendicular to the line that connects the two extreme points of the set. Sort the length of the perpendicular line segment by decreasing order. Let M1 be the set of indices of the points corresponding to this ordering.
(2) Use the 2nd method to determine the sum of the errors for the two linear fittings found for each point obtained in the measuring procedure. Sort the sum of the errors for the two linear fittings by ascending order. Designate by M2 the set of indices of the points associated with this ordering.
(3) Determination of the knee point. Find the point xi = (ti, Mwi) whose index, i, occupies the best positions in sets M1 and M2, using the following algorithm:
Step 0. Let k= 1 be the position of an element in a set, i = 1 an index position and n the total number of points obtained in the measuring procedure.
Step 1. If i > k, let j = 1 and go to Step 3.
Step 2. If M1(k) = M2i), the knee point is t(M1(k)), Mwi(M1(k)) and stop the algorithm. Otherwise, let i=i + 1 and return to Step 1.
Step 3. If j ≥ k, go to Step 5.
Step 4. If M2(k) = M1(j), the knee point is t(M2(k)), Mwi(M2(k)) and stop the algorithm. Otherwise, let j = j + 1 and return to Step 3.
Step 5. Let k = k + 1. If k > n, an error message must be sent. Otherwise, let i = 1 and return to Step 1.
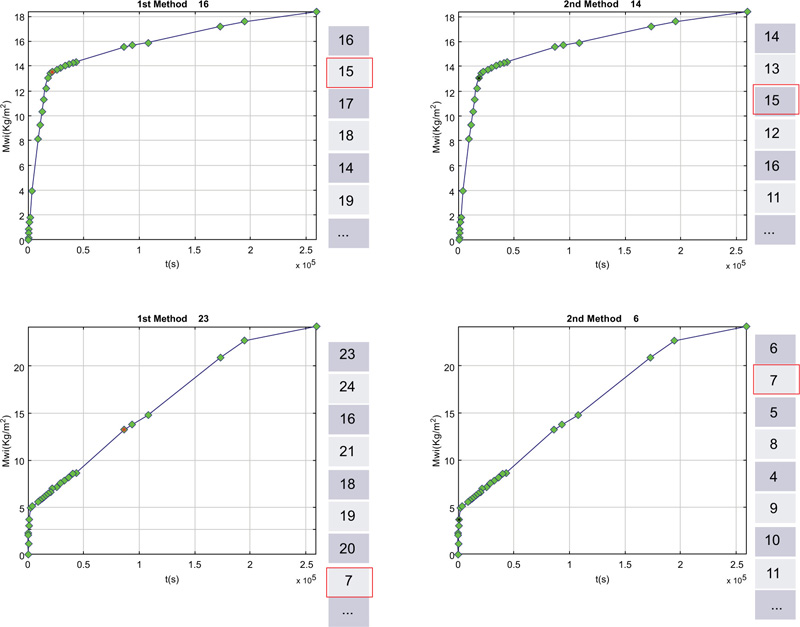
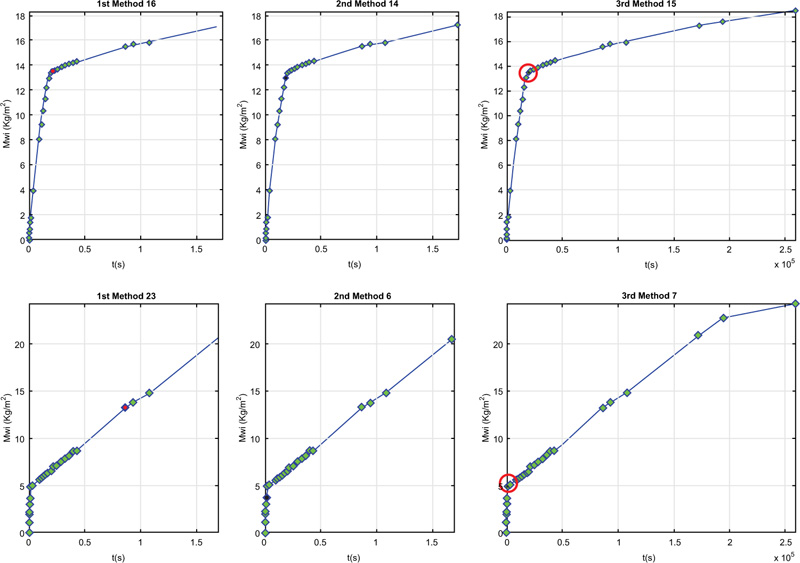
Since the main goal of the algorithm proposed is to find the “knee” point of a set of points xi = (ti, Mwi), i= 1, 2, …, n obtained in the measuring procedure (discrete points), where the data errors should be considered, the combination of the two previously presented methods can give a “better” knee point. However, as the method is based on discrete points, the data measurements are crucial to guarantee the determination of the best possible point. When proposing the third method, the method was programmed in MATLAB, and the authors did a significant validation of the knee point detection using several data measurements (Fig. 5).
Fig. (6) shows two examples of knee point detection (the same examples presented in Fig. (5), considering the first, the second and the third method, and it is possible to observe that a better solution is obtained with the third method. A complete explanation of knee point detection methods is presented in previous research [14, 19].
The robustness of this knee-point identification using the third algorithm method, which is described in detail [14, 19], could be used in several experimental tests of capillary water absorption existing in the literature with a variety of building materials, from the most common to the most sustainable. In this regard, even though it is not the purpose of this paper, it should not be forgotten that concrete is the most commonly used manufactured building material in the world, however, one of the disadvantages of conventional concrete is its high self-weight and carbon footprint. The manufacturing of 1 ton of ordinary Portland cement is estimated to release approximately 1 ton of carbon dioxide.
Lightweight concrete has low density, reduction of dead load, and increases thermal insulation. There are three types of lightweight aggregate used as a replacement for coarse aggregate: natural lightweight aggregate (as pumice aggregate, volcanic cinder, light sand, etc.), artificial lightweight aggregate (clay ceramisite, expanded perlite, sintered pulverized fuel ash, expanded clay, foamed slag, etc.), and industrial waste lightweight aggregate (as fly ash ceramisite, expanded slag ball, cinder, light sand, etc.). The lightweight aggregate used in this kind of concrete has high porosity, small apparent density, great water absorption, and low strength.
3. CAPILLARY ABSORPTION IN MONOLITHIC SAMPLES
3.1. Capillary Absorption Measurements
This topic discusses the evolution and variation of the moisture absorption for each of the monolithic samples. The presented results [8] were the ones that were experimentally obtained considering the same test methodology, at the same time and in the same conditions. The procedure and the obtained results can be analysed deeper to understand those obtained values.
One explanation could be the material porosity. The authors of a study [8] were not worried about that explanation, and if the authors of another study [13] think that it is important to analyse it deeper, it can be said that this could be verified with independent data. The porosity analysis obtained from vacuum saturation testing, as suggested, was out of the scope of the previous work. The results also showed fast moisture absorption during the first minutes. As was understood [13], one possible reason could be the large pore radii, which could also be verified with independent data, for example, pore volume distributions obtained from mercury intrusion porosimeter (again, this was out of the scope of the previous work).
Another issue is the taping quality. The authors have experience with those experimental tests, and when these kinds of tests are made in the Laboratory of Building Physics - LFC, FEUP, Portugal, the “tape” used is an epoxy resin, which is considered a better solution Fig. (7). Taping of the samples was done carefully to avoid additional absorption between the sample and the tape, as the authors are aware [8]. The authors did not try to execute the capillary absorption tests with an incomplete taping, as suggested [13], but this could be made in the future.
3.2. Consistency of the Capillary Absorption Processing
The authors [8] studied the capillary absorption of monolithic samples, in which the impact of the sample cross-section size is the main aspect. The capillary absorption tests on 15 cm height monolithic concrete samples, with cross-sections of 5x5 cm2, 7.5x7.5 cm2, 10x10 cm2, were made, and those results are shown in Fig. (3) of paper [8] (not in Fig. (3) of paper [13]). It is said that “data in that figure have been digitally extracted” and all the discussions after that, with precise numbers and deviations, were based on that “approximation” [13].
It seems to the authors that this procedure should be a way to obtain reasonable compared results but not the same as it is not possible to have that precision (especially in the first overlapped density of points). So, it is considered expectable some deviations between the C [g/cm2] and Aw [kg/m2s0.5] [8] and the Moisture Mass (3 days) [g/cm2] average and Moisture Mass (1 day) [kg/m2] average [13].
Apart from the expected deviation considering the digitally extracted method [13, 8], it is said that “The Brazilian standard NBR 9779 establishes only the “C” calculation (in g/cm2), called capillarity absorption, presented in Table 4, made for all monolithic specimens”. This means that all the samples were considered in the C calculations. Nevertheless, as it is also said, “The 3 more representative experimental results for each contact area are represented in Fig. (4)”. This does not influence the conclusions/finding of the article [8].
In fact, looking at Table 2 of [13], the only deviation that feels strange is the Aw of the sample with 10x10 cm2 of a cross-section. After a deep analysis of the entire study done [8], it was observed that the correct value (for the Aw of the sample with 10x10 cm2 of cross-section) should be 0.1013 kg/m2s0.5 (the value of a discarded sample was used instead of the presented samples). However, it should be highlighted that this does not influence the conclusions/finding of the article.
4. THE NUMBER AND “QUALITY” OF SAMPLES THAT SHOULD BE USED
In that section, it is intended to discuss the importance of having several identical samples of each test to get various results to see if there is consistency/reproducibility of those results. It is also discussed the designated “quality” of the samples, i.e., analyse if “atypical” results should be discarded as the definition of an “atypical” result.
In this kind of study, a common difficulty is the definition of the minimum number of identical samples that allows the researchers to get strong results. For example, for the capillary water absorption coefficient, Aw, some standards stand that at least three samples should be used for each test, but five samples would be the ideal scenario. Four samples were used, but only the three most representative were considered for the Aw determination [8]. About the “quality” of the samples, it remains some doubts about discarding the most “atypical” result that could be, for example, the one that deviates more from the average or considers all the obtained values. Another possibility is discarding “atypical” results but well defining a strong criterion about what should be considered an “atypical” result.
CONCLUSION
The interface is a problem in moisture transfer in building constructions. Following paper [8], some interesting questions were presented [13], and the analysis results intended to clarify them:
(1) Magnitude of the quantified post-interface flows – The hygric resistance results of the papers [8] and [13] were different as they consider different methodologies for the knee point detection and a different number of data points after the knee (different ones) to calculate the slope.
(2) Distinguishability of the moisture absorption in the monolithic and perfect contact samples – In the samples with a discontinuity (in that case, perfect contact interface), it is possible to observe a different behaviour when reaching the interface changing is dependence on the interface position. The monolithic samples (without interface) reached the highest moisture masses, Mw, and the Mw values became lower with the interface occurrence.
(3) Robustness of the knee-point identification algorithm – For the knee-point identification, the authors [8] only consider valid the use of the third of the three algorithms described in Section 2.3. The use of the first out of three algorithms applied to be considered the easiest to implement is not considered by the authors [8] as a good solution. In fact, the authors exactly suggest this third methodology to avoid the limitations identified using the other two methods.
(4) Dependability of the capillary absorption measurements – A deeper analysis to justify the evolution and the variation for the moisture absorption, experimentally obtained, for each of the monolithic samples, was out of the scope of the author’s research [8]. However, to analyse it deeper, it can be said that this could be verified with independent data. The taping of the samples was carefully done. Absorption tests using epoxy resin are considered a better solution.
(5) Consistency of the capillary absorption processing – The values presented [13] were digitally extracted [8] to obtain and compare results. It is considered a reasonable approximation, but differences are expected. So, some deviations were expected between the C [g/cm2] and Aw [kg/m2s0.5] [8] and the Moisture Mass (3 days) [g/cm2] average and Moisture Mass (1 day) [kg/m2] average [13]. The C calculation (in g/cm2) was made for all monolithic samples, but only the 3 more representative experimental results for each contact area were represented [8]. The Aw of the 10x10 cm2 cross-section should be 0.1013 kg/m2s0.5, however, this does not influence the conclusions/findings.
(6) The most important questions that can be studied in the future are: How to guarantee the “correct” post-interface flow quantification? Is there a specific number of points to guarantee the “correct” flow? Can a methodology be developed to automatically define which points should be considered? Is this methodology independent of the material, the interface type and position?
(7) A common difficulty is the definition of the minimum number of identical samples that allows the researchers to get strong results. Four samples were used, but only the three most representative were considered for the Aw determination [8]. Regarding the “quality” of the samples, it remains some doubts about discarding (when/why) or not “atypical” results.
CONSENT FOR PUBLICATION
Not applicable.
AVAILABILITY OF DATA AND MATERIALS
Not applicable.
FUNDING
This work was financially supported by: Base Funding - UIDB/04708/2020 and Programmatic Funding - UIDP/04708/2020 of the CONSTRUCT - Instituto de I&D em Estruturas e Construções - funded by national funds through the FCT/MCTES (PIDDAC); and by FCT – Fundação para a Ciência e a Tecnologia through the individual Scientific Employment Stimulus 2020.00828.CEECIND.
CONFLICT OF INTEREST
The authors declare no conflict of interest, financial or otherwise.
ACKNOWLEDGEMENTS
Declared none.

